Summary:
- Taiwan Semiconductor has shown strong trend performances, with a 25.5% return, outpacing the S&P 500’s 8.84% gain, and is nearing long-term highs.
- TSMC’s Q2 earnings exceeded expectations, with 36.3% net income growth and 40.1% revenue growth, driven by demand for 5nm and 3nm products.
- Despite potential risks from elevated price-sales valuations, TSMC’s forward PE ratio is attractive compared to peers, justifying a “strong buy” rating.
- Indicators suggest TSMC has room to extend higher, with support from AI and mobile phone demand, and potential for new all-time highs.
shih-wei
When I last covered Taiwan Semiconductor Manufacturing Company (NYSE:TSM) on May 13th, 2024 with “Taiwan Semiconductor: Breaking Major Upside Levels”, the stock was in the process of breaking through major resistance levels (located at $148.43) that were formed during the April 10th trading session:
TSM: Major Break of Historical Resistance (Income Generator via TradingView)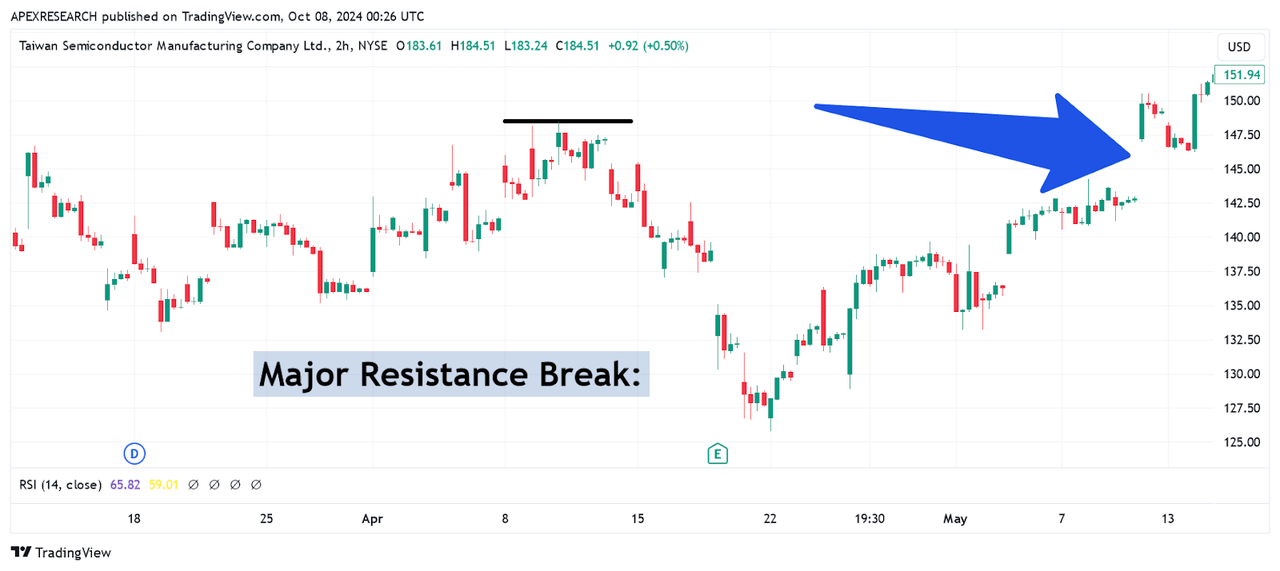
Since then, the upside follow-through that the stock has generated has been sizable and Taiwan Semiconductor is now showing total returns of $25.5% even while the S&P 500 is lagging far behind with gains of just 8.84%. Now that the stock is trading within relatively close proximity to long-term highs, I think it is time to reassess the outlook for Taiwan Semiconductor based on the company’s ability to sustain elevated share price trends on a consistent basis.
Q2 2024: Taiwan Semiconductor Earnings Figures (Taiwan Semiconductor: Quarterly Earnings Presentation)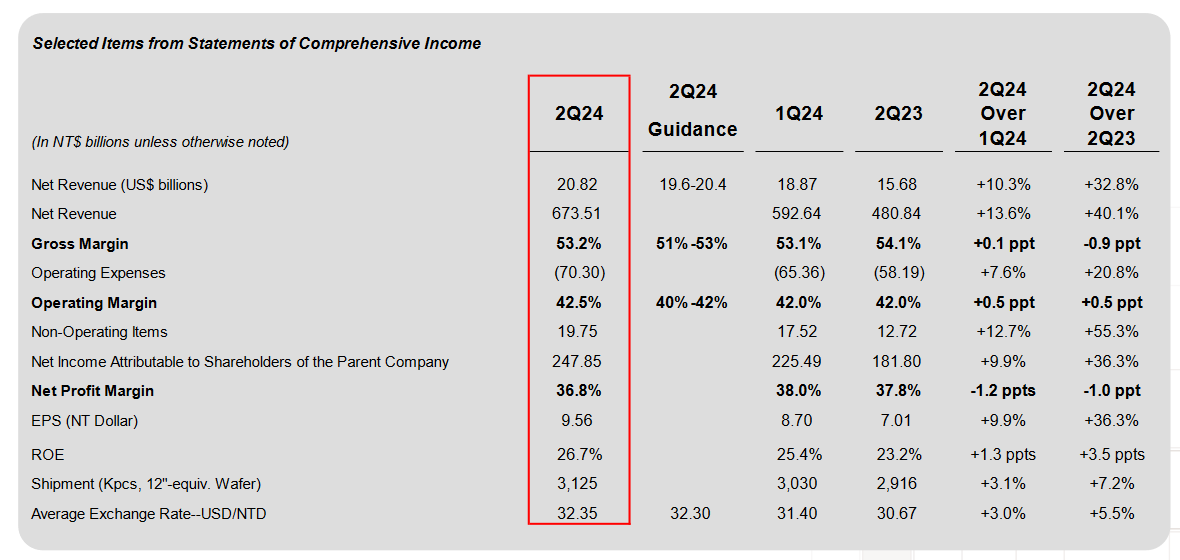
For the second quarter period, Taiwan Semiconductor recorded annualized growth of 36.3% in net income (at just under $7.72 billion) and 40.1% annualized growth in revenue (at just over $20.8 billion). Ultimately, this performance surpassed guidance figures for the period (with revenues expected to post at $19.6-20.4 billion) and commentary from management indicated that negative cyclical factors in the mobile phone segment were aided overall by improved demand for TSMC’s 5-nanometer and 3-nanometer product offerings:
Q2 2024: Taiwan Semiconductor Earnings Figures (Taiwan Semiconductor: Quarterly Earnings Presentation)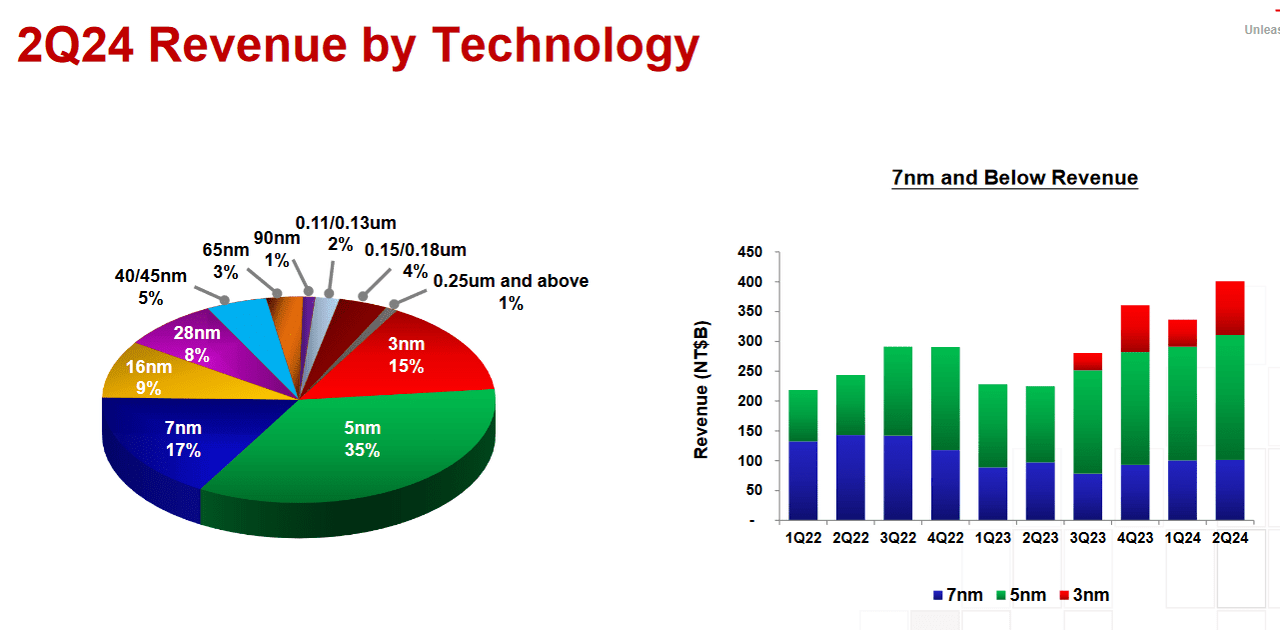
Current quarter guidance from TSMC suggests the potential for $22.4-23.2 billion in revenues, which would indicate annualized growth rates of nearly 31.8% relative to the 17.3 billion in revenues that was posted during Q3 2023 (when measured using the guidance midpoint). Now that we are beginning to see some evidence that weaknesses in global smartphone sales have started to wane, I think that portions of the company’s Q2 earnings report that were problematic previously might actually outperform in the Q3 release. So, when we add this possibility to what seems to be a widely anticipated expectation for continued strength in the company’s A.I. segments, it appears as though TSM share prices could continue to see gains after the Q3 earnings report is released.
Q2 2024: Taiwan Semiconductor Earnings Figures (Taiwan Semiconductor: Quarterly Earnings Presentation)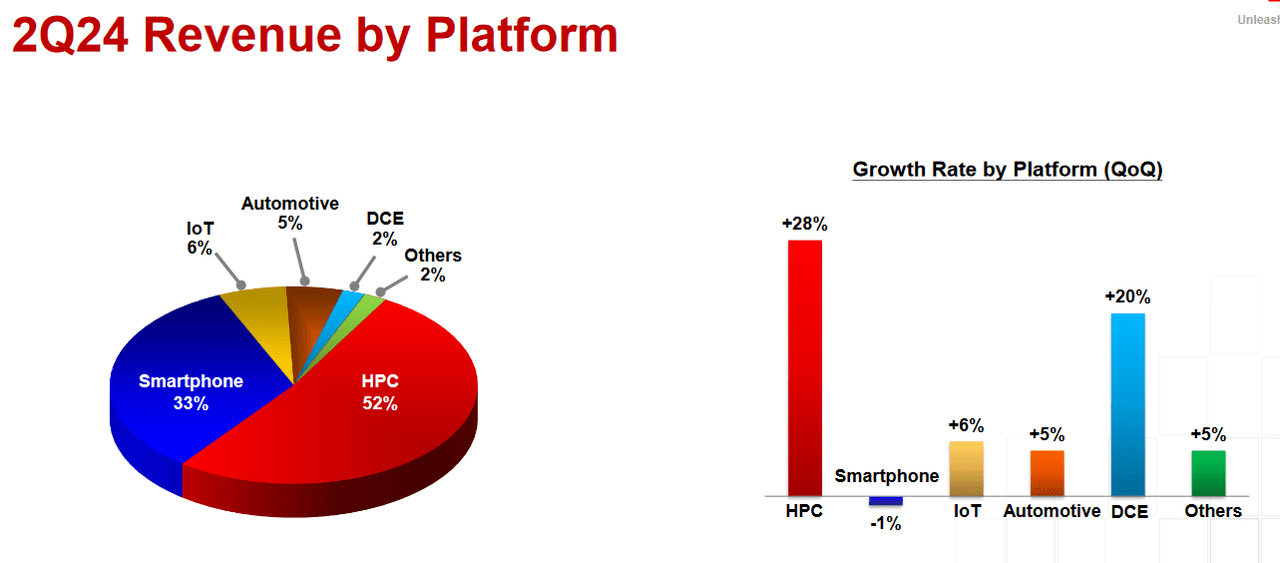
If we do see third quarter earnings results from Taiwan Semiconductor that surpass market expectations, I think it is important to prepare for potential upside given the stock’s history in sustaining long-term bullish trend activity. When starting to assess the extent to which TSM share prices can continue to rally higher, we must first define some critical support and resistance levels that have strong potential to influence price behavior going forward. Specifically, I would point to the stock’s all-time highs, which were printed during the July 11th trading session (coming in at $193.47). Unfortunately, the last time the stock tested this price zone, we ultimately saw eventual declines of nearly 30.1% (resulting in the August 5th lows of $133.57). As we can see, this was a price rejection that was quite severe, with the stock losing almost a third of its value in less than a one-month period.
TSM: Critical Resistance Zones Remain Nearby (Income Generator via TradingView)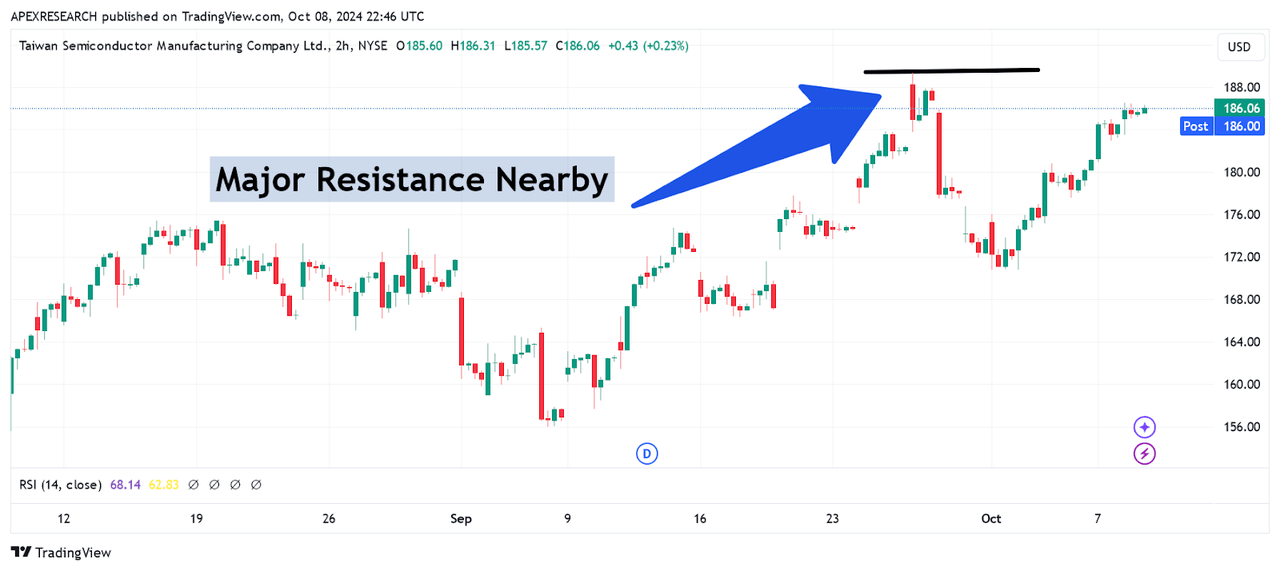
Currently, TSM share prices are trading within relatively close proximity to this heavily problematic price zone (which rests just 4.4% higher, at the time of writing). Given that we are now facing a critical event risk (with quarterly earnings scheduled to be released on October 17th), I would expect to see much choppier price action over the next two weeks. Ideally, I think the best-case scenario would be for share prices to break through the $193.47 resistance zone prior to the scheduled earnings release because this would at least give share prices time to allow the “dust to settle”, so to speak.
TSMC: Comparative Forward Price to Earnings Valuations (YCharts)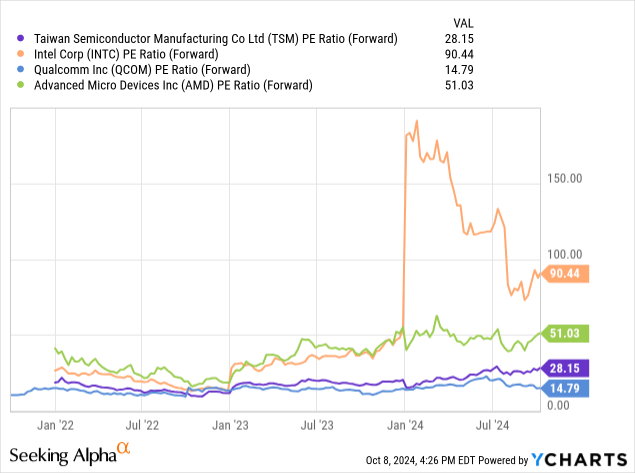
But even with the stock’s recent rallies, we can see that Taiwan Semiconductor still remains relatively cheap when viewed from the perspective of comparative forward price-earnings ratios. Specifically, we can look at the stock’s forward price-earnings metrics in relation to comparable statistics from industry rivals Intel Corporation (INTC), Advanced Micro Devices, Inc. (AMD), and Qualcomm, Inc. (QCOM). Here, we can see that TSMC’s forward PE ratio of 28.15x trades far below industry peers Intel (at 90.44x) and AMD (at 51.03x) but is still somewhat elevated when compared to Qualcomm (at 14.79x). As a result, we can see that TSMC is positioned quite well in terms of the company’s current forward price-earnings valuation.
TSMC: Comparative Forward Price to Sales Valuations (YCharts)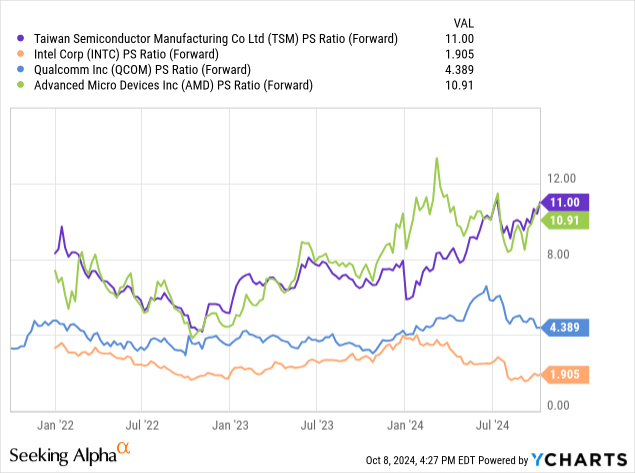
However, one factor that concerns me about the potential outlook for Taiwan Semiconductor is the current forward price-sales valuation, and this is one aspect that could give the stock added difficulties as we approach these major long-term resistance zones. In this respect, we can see that TSMC’s 11x forward price-sales valuation is trading slightly above AMD’s valuation (currently seen at 10.91x) and far above Qualcomm (at 4.39x) and Intel (at just 1.9x).
Using both of these important valuation metrics, we can see that Qualcomm might be more attractively valued at the moment – and this is why I have upgraded QCOM stock as a “strong buy” in my recent article “Qualcomm: Buy The Drop”. But, at the same time, I do not see TSMC’s current forward price-sales valuation as being excessive (or unsustainable) because AMD is currently trading with similar valuation metrics.
TSM: Weekly Price Chart History (Income Generator via TradingView)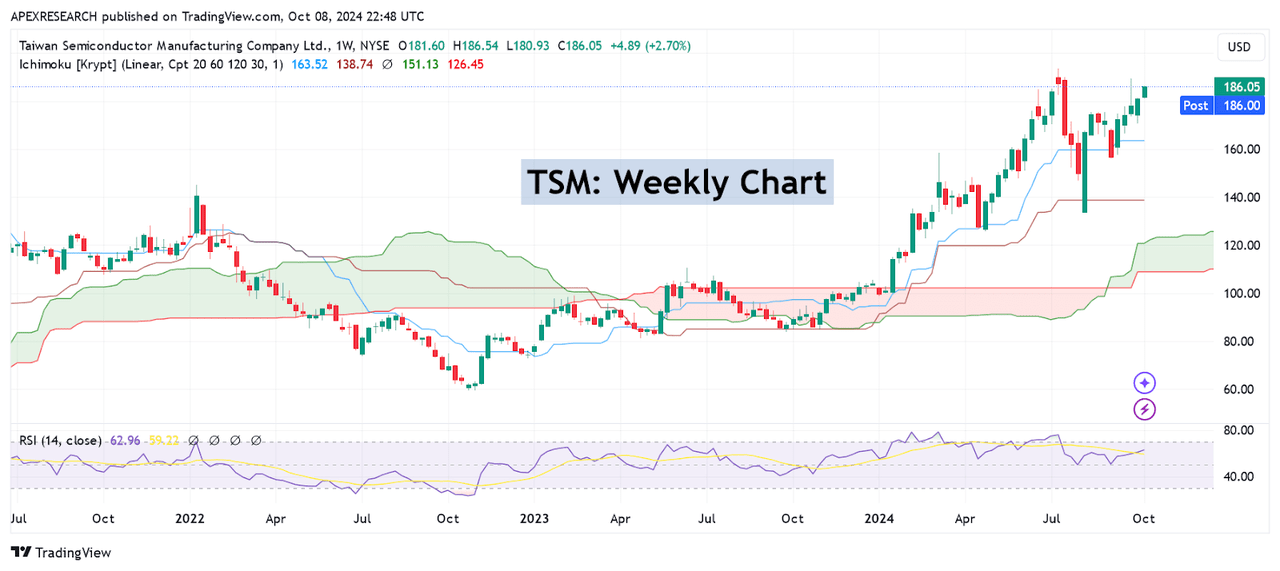
Overall, the potential for a strong quarterly performance stemming from continued demand for hardware used in artificial intelligence processes and from recovering demand for hardware used in mobile phones might be enough to send TSM share prices to new all-time highs. Of course, certain risks remain present (such as the elevated price-sales valuation that is seen currently). However, these concerns can also be seen in highly relevant industry rivals and do not appear to be unsustainable at the moment. As a result, I am raising my rating outlook for this stock to a “strong buy” and I would not consider changing this position unless I see share prices fall below the August 5th lows of $133.57. On the weekly time frames, indicator readings in the relative strength index are holding firmly below overbought readings (currently holding at 62.8) and this suggests that the stock should have plenty of room to extend higher without becoming over-extended.
TSM: Daily Price Chart History (Income Generator via TradingView)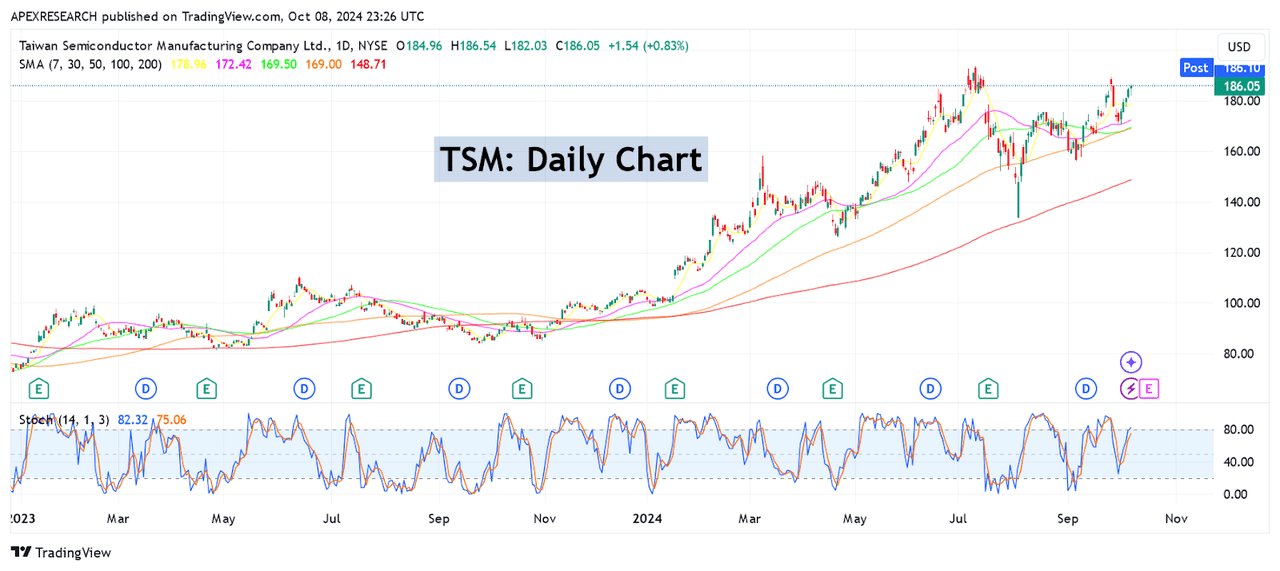
We are currently trading less than 5% below the stock’s all-time highs, so any further extension to the topside might also benefit from stop-loss activity connected to intraday short positions that have been established at elevated levels. On October 3rd, share prices bounced quite forcefully from the 30-day simple moving average, and this is the initial near-term support signal that I will be watching to the downside. Daily readings in the stochastics indicator have started to move toward overbought territory, but this stock has a fairly well-established history of trading at somewhat elevated readings in this specific indicator (as we can see in the chart shown above). On balance, I think all of these factors suggest that the stock still has plenty of potential to move into record territory, and I have upgraded my prior rating to reflect this improved outlook.
Analyst’s Disclosure: I/we have a beneficial long position in the shares of TSM either through stock ownership, options, or other derivatives. I wrote this article myself, and it expresses my own opinions. I am not receiving compensation for it (other than from Seeking Alpha). I have no business relationship with any company whose stock is mentioned in this article.
Seeking Alpha’s Disclosure: Past performance is no guarantee of future results. No recommendation or advice is being given as to whether any investment is suitable for a particular investor. Any views or opinions expressed above may not reflect those of Seeking Alpha as a whole. Seeking Alpha is not a licensed securities dealer, broker or US investment adviser or investment bank. Our analysts are third party authors that include both professional investors and individual investors who may not be licensed or certified by any institute or regulatory body.
