Summary:
- TSMC’s Q3 earnings exceeded expectations with $10.1 billion net income and $23.5 billion revenue, driven by strong smartphone demand and advanced artificial intelligence hardware.
- I maintain a “buy” recommendation, even though TSMC’s forward valuation metrics now favor competitors like Qualcomm, suggesting a need for cautious trading.
- The stock’s recent break above $193.47 is bullish, but RSI nearing overbought territory indicates potential momentum slowdown; wait for retracement opportunities.
- Maintain a positive outlook unless TSMC breaks critical support at $182.60, which could signal a bearish shift and necessitate reevaluation of the stock’s comparative outlook.
mesh cube
When I last covered Taiwan Semiconductor Manufacturing Company (NYSE:TSM) on October 9th, 2024 with “TSM: Buy Before Earnings”, the stock was attempting to recover from significant declining losses of nearly -10% that unfolded during a period of just five days. Unfortunately, it looks as though the market was concerned about the upcoming event risks associated with the release of TSMC’s next quarterly earnings report:
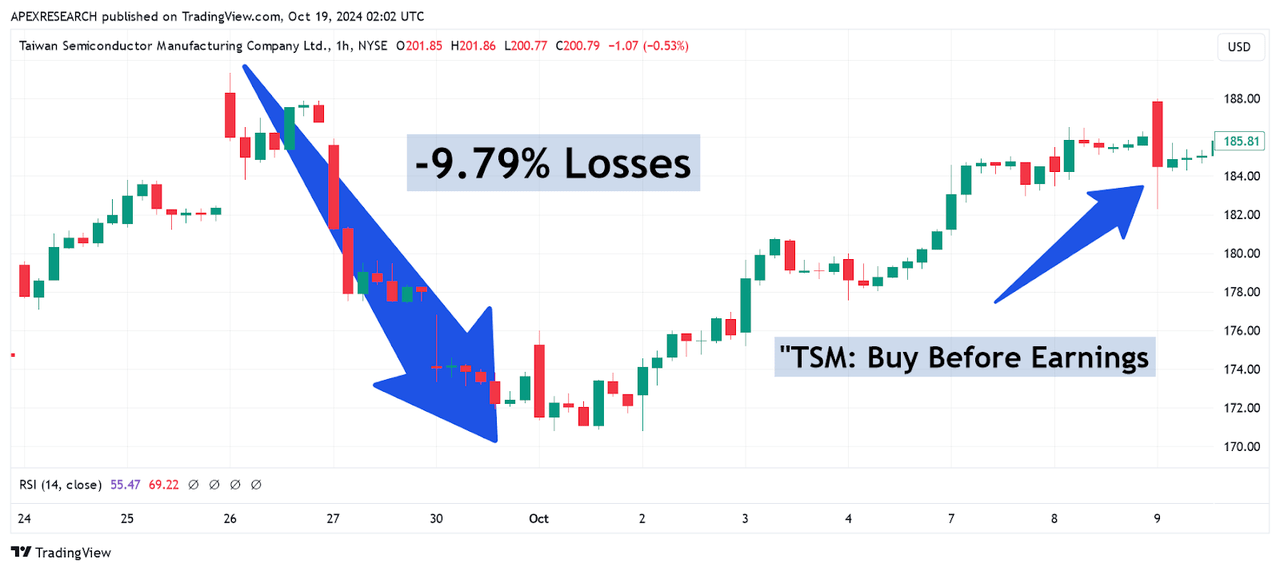
TSM Stock: Prior Declines Before Q3 Earnings Report (Income Generator via Trading View)
Fortunately, my “strong buy” recommendation helped investors capitalize on this prior weakness in share prices and capture gains that unfolded as TSM share prices rocketed higher and touched new all-time highs:
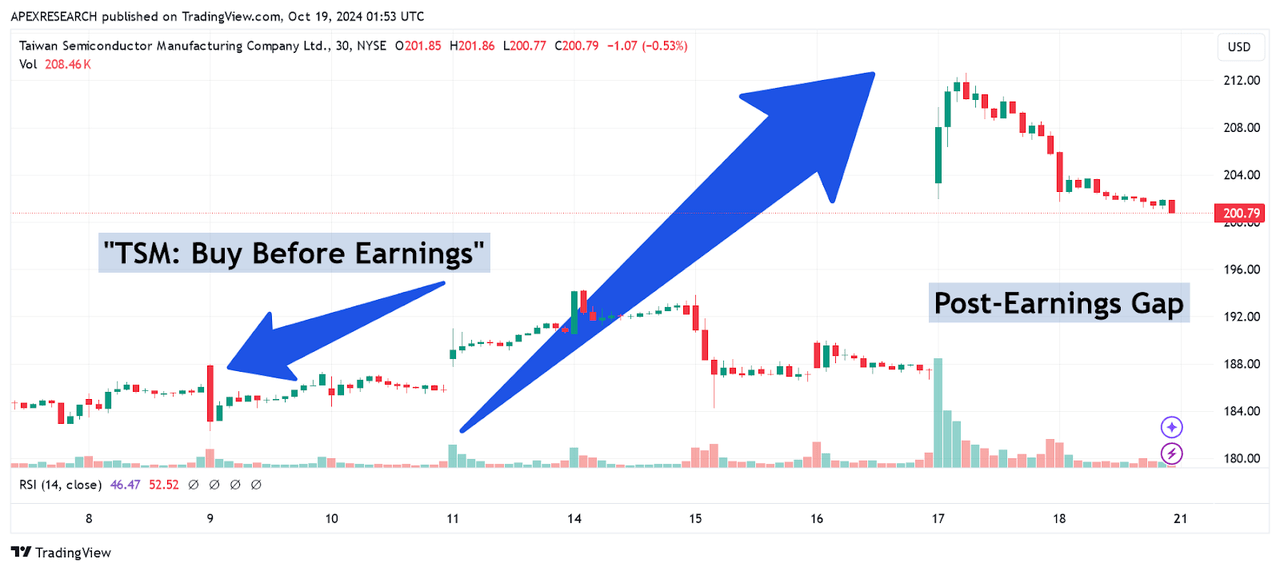
TSM Stock: Major Share Price Rallies Follow Q3 Earnings Release (Income Generator via Trading View)
For the third quarter period, TSMC generated $10.1 billion in net income, and this indicates incredible annualized growth rates of 54.2% for the industry’s largest manufacturer of advanced CPUs. Overall, this performance surpassed relatively lofty consensus estimates by 8.36% and similarly strong results were seen on the revenue side of the equation. Specifically, TSMC generated net revenues of $23.5 billion for the period, and this figure implies annual growth rates of 36.0%. Net profit margins were also quite strong at 42.8% while operating margins easily surpassed TSMC’s guidance range of 42.5-44.5% (at 47.5%). This was also true for the gross margin figure, which beat the prior guidance range of 53.5-55.5% (at 57.8%).
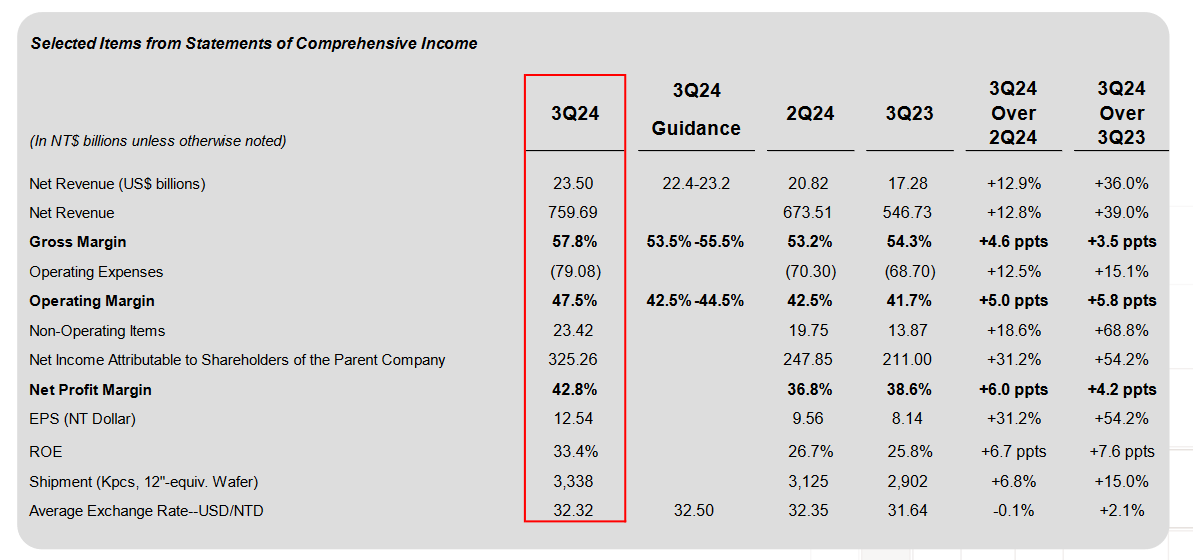
Taiwan Semiconductor: Q2 2024 Earnings Figures (Taiwan Semiconductor: Earnings Presentation)
Clearly, strength for the company during this quarterly period was driven in large part by an improved climate for global smartphone demand and 3nm / 5nm hardware that will ultimately be used in data centers and artificial intelligence processes.
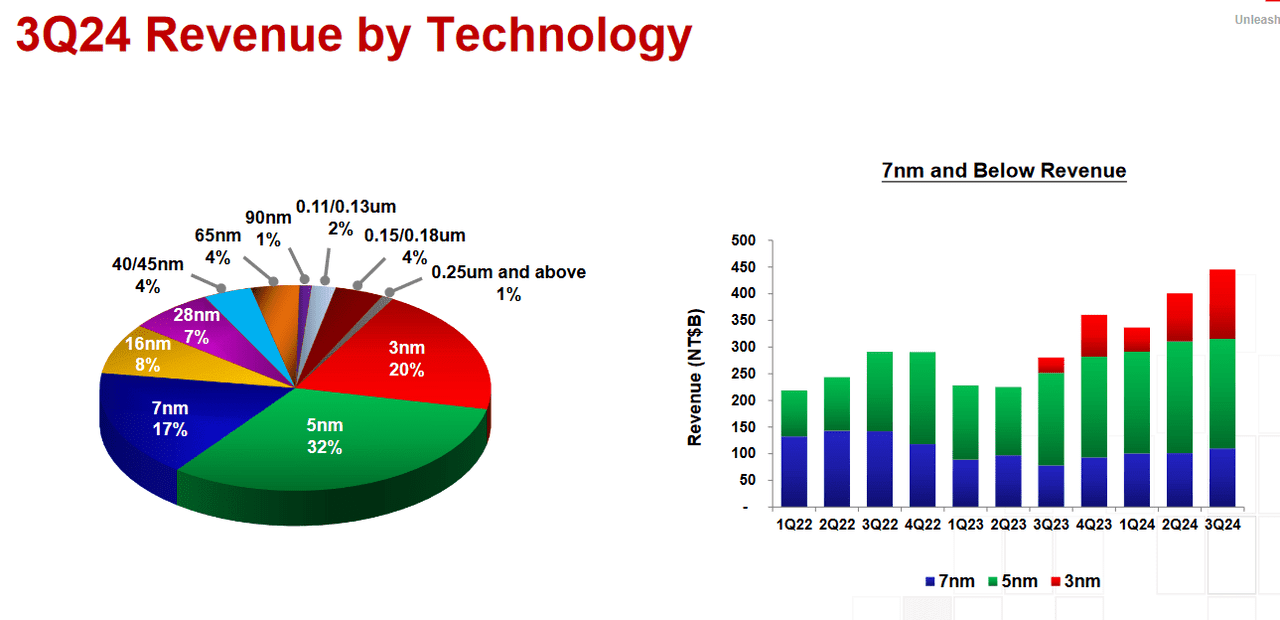
Taiwan Semiconductor: Q2 2024 Earnings Figures (Taiwan Semiconductor: Earnings Presentation)
For the current quarter, TSMC guidance figures suggest that investors will see revenues that fall within a $26.1-26.9 billion range. Using $26.5 billion in potential revenues as the midpoint, this would imply that TSMC expects to see quarterly growth rates of 13% (which would mean sustained, impressive annualized growth rates of 35%, if realized).
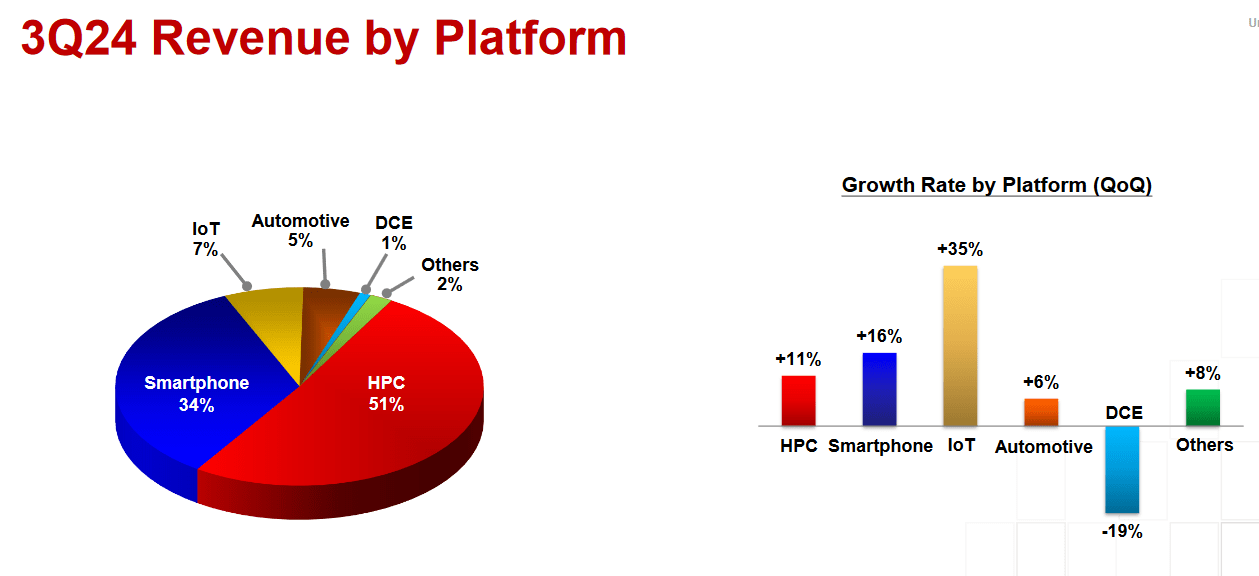
Taiwan Semiconductor: Q2 2024 Earnings Figures (Taiwan Semiconductor: Earnings Presentation)
Now that TSMC’s critical event risk is now in the rearview mirror for investors, we will need to reassess the company’s forward valuation metrics in relation to key competitors within the same industry group. Next, we will look at Taiwan Semiconductor’s updated forward price-earnings ratio, which currently stands at 28.55x. On the negative side, this figure is far above the forward price-earnings ratio that is associated with Qualcomm, Inc. (QCOM) at just 15.19x. However, on the positive side, TSMC’s updated forward price-earnings ratio is still trading at levels that are far more attractive in relation to Advanced Micro Devices, Inc. (AMD) at 46x and Intel Corp. (INTC) at 88.42x.
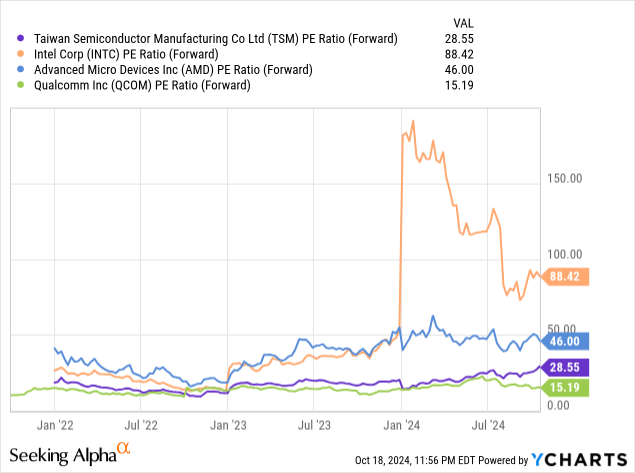
Comparative Forward Price to Earnings Valuations (YCharts)
Unfortunately, looking at TSMC’s updated forward price-sales ratio of 11.69x actually puts the company in a much worse position as the most expensive stock relative to this specific set of industry peers. Using this metric, all three of these alternatives are trading at cheaper valuations right now, with AMD the closest in the group at 9.85x. However, forward price-sales metrics are much more attractive when looking at Qualcomm (at 4.51x) and Intel (at just 1.86x).
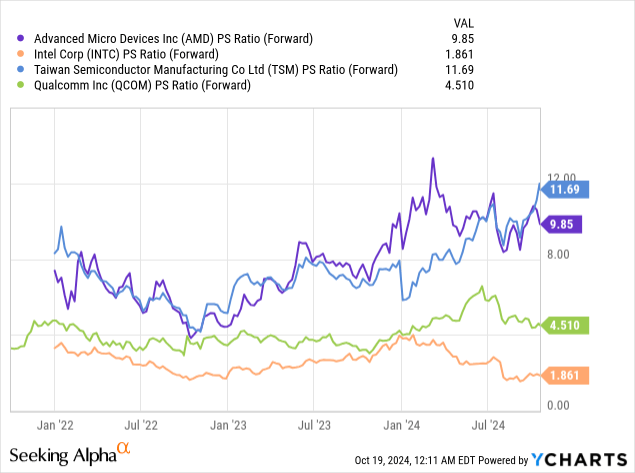
Comparative Forward Price to Sales Valuations (YCharts)
Finally, we will look at the comparative price-book valuation because similar trends can be seen there, as well. Of course, this metric has shown a few examples of extreme volatility in the past. Key examples can be seen in the historical valuations of AMD and Qualcomm, however, current readings have stabilized, and all four companies are now trading at levels that are more in-line with the long-term averages. As we can see, TSM is still the most elevated stock in this group (at 8.24x) with Qualcomm trading at slightly lower valuations (at 7.72x). Once again, much less expensive alternatives can still be found in this peer group in AMD (at 4.46x) and with Intel (at just 0.85x).
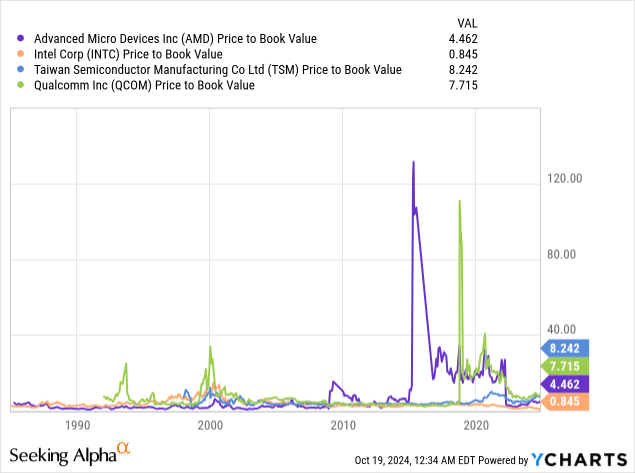
Comparative Forward Price to Book Valuations (YCharts)
For clarification purposes, I will reiterate that my rating downgrade is simply based on the fact that the Q3 event risk has now passed and the stock gains that are likely to be generated by this event are now likely priced-in. Please note that this is still a bullish rating for the stock. I am simply saying that the expected surge in share prices has now been seen, and I think that we are less likely to see outsized TSM gains near-term. Additionally, some of the most important forward valuation metrics seem to favor other stocks at the moment, and I think TSM investors must readjust the trading plan a bit now that we have seen the stock’s recent price moves surge in the bullish direction.
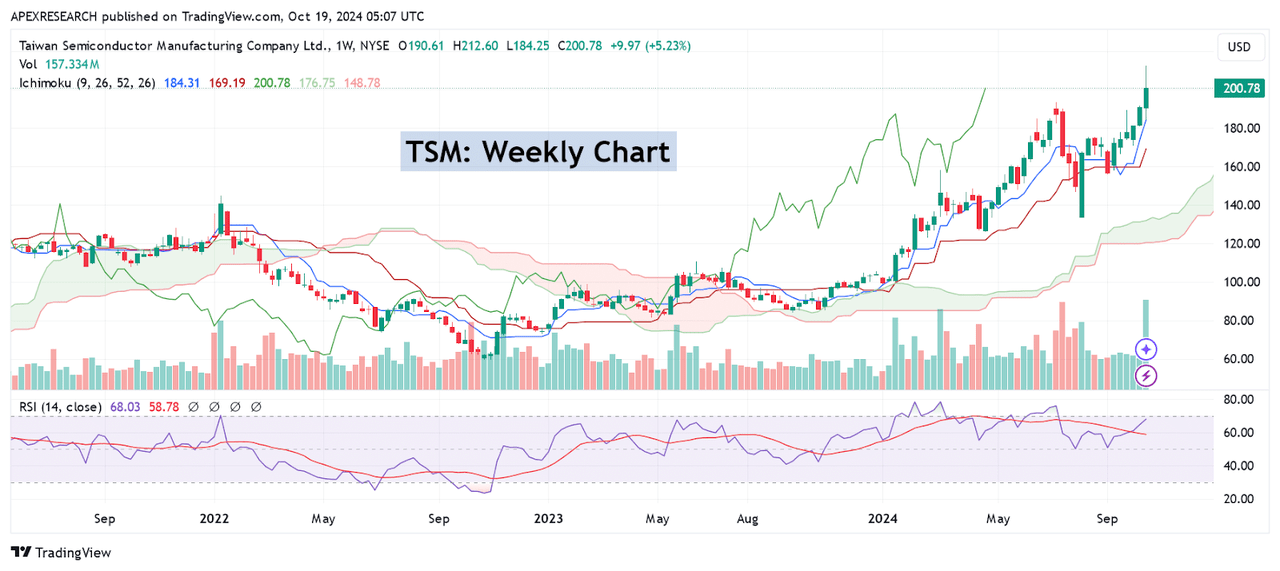
TSM Stock Weekly Chart: Major Support and Resistance Levels Develop (Income Generator via Trading View)
First, we must point-out that the stock’s recent break above prior resistance levels at $193.47 (July 8th, 2024 highs) was, in fact, a highly bullish event. That said, weekly readings in the relative strength index are starting to approach overbought territory (at 67.7) and this does suggest that momentum might start to slow for this stock near-term. Since prior resistance zones are generally expected to work as support levels once tested from the topside, we can view a retracement into $193.17 as an opportunity to either start buying the stock or to add to existing long positions. However, I think that it is important for investors to wait for retracement opportunities rather than to simply by the stock at its current elevated level. As a result, my outlook does remain positive (based largely on the exceptional revenue growth Taiwan Semiconductor is expected to deliver during the current quarter period).
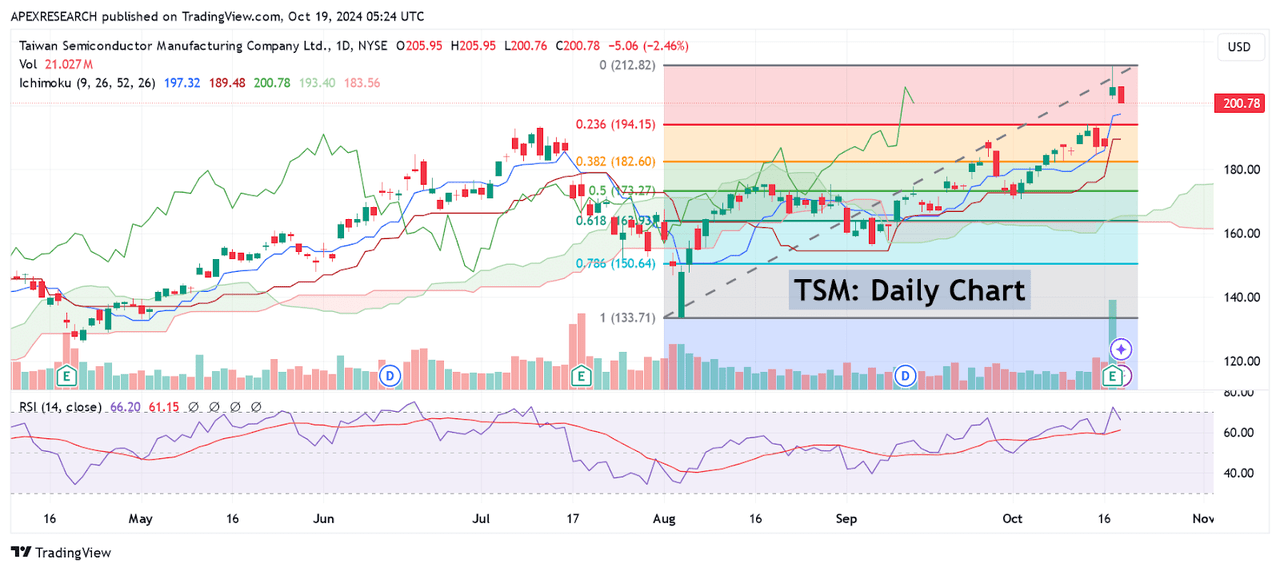
TSM Stock Daily Chart: Major Retracement Zones and Reversal Points (Income Generator via Trading View)
In order for me to change my outlook to a more bearish viewpoint, I would need to see share prices start to break through critical support levels. One area in particular that I would be watching is the 38.2% Fibonacci retracement zone that is based on the move from $133.57 (August 5th, 2024 lows) and extends to the new all-time highs at $212.60 (from October 17th, 2024). Specifically, this 38.2% retracement is currently found near $182.60 and this area rests within close proximity to the stock’s price low from October 4th and this strengthens the validity of this region as an area of viable support. Thus, if we started to see declines in share price action that broke through this support level in the downward direction, we can then reasonably assume that the paradigm has shifted and that a more significant bearish price move might be ready to develop. On the positive side, this type of price move could allow TSM’s forward valuation metrics to contract in ways that are more favorable in relation to the industry peer group and if all of this occurs we will need to reevaluate Taiwan Semiconductor’s comparative outlook. Until (or unless) this happens, I will maintain my current TSM long position, with the expectation that we are still likely to see new all-time highs in this stock before the end of this year.
Analyst’s Disclosure: I/we have a beneficial long position in the shares of TSM either through stock ownership, options, or other derivatives. I wrote this article myself, and it expresses my own opinions. I am not receiving compensation for it (other than from Seeking Alpha). I have no business relationship with any company whose stock is mentioned in this article.
Seeking Alpha’s Disclosure: Past performance is no guarantee of future results. No recommendation or advice is being given as to whether any investment is suitable for a particular investor. Any views or opinions expressed above may not reflect those of Seeking Alpha as a whole. Seeking Alpha is not a licensed securities dealer, broker or US investment adviser or investment bank. Our analysts are third party authors that include both professional investors and individual investors who may not be licensed or certified by any institute or regulatory body.
