Summary:
- Target Corporation’s Q2 2024 results were positive, the stock remains undervalued with a fair value estimate of $177, implying an 18% upside.
- Despite strong short-term potential, Target’s long-term growth is questionable due to moderate net margins, high CAPEX, and competitive pressures.
- Target’s digital sales grew significantly, but overall revenue growth and earnings predictability remain inconsistent, raising doubts about sustainable long-term performance.
- Market undervaluation justifies a “Buy” rating for speculative investors, but long-term investors should take into account financial performance risks and volatility.
Sundry Photography
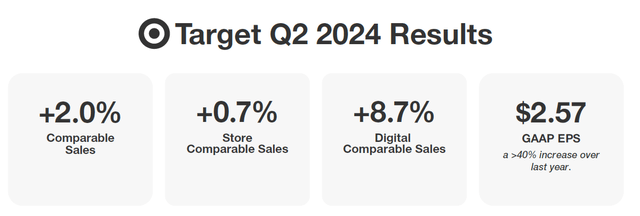
Target Corporation (NYSE:TGT) released positive Q2 2024 results, and management assured stockholders that the company “is back to sales growth.” With the holiday season approaching and the shopping spree already beginning, it would be expected that this story would be capitalized on until Christmas in anticipation of even stronger results next quarter.
TGT has lagged far behind S&P500 year to date (Seeking Alpha)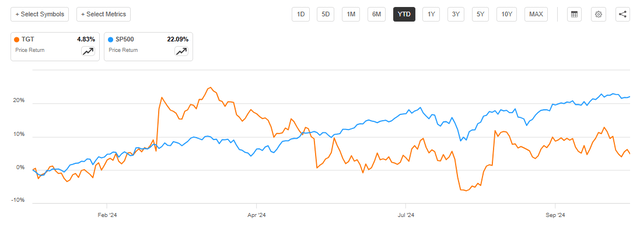
Instead, the price has closed the earnings gap and remains in a wide range, leaving Target’s valuation at a discount to the industry. My calculations put the stock’s fair value at $177, which implies an upside of 18.5%. That’s why I’ve put a BUY on this stock, but there are so many pitfalls to this investment idea that I would set an “avoid” status on it if it were available to conservative long-term investors. While there is short-term potential, I don’t see Target as a long-term favorite. These are the factors that were top of my mind when I compared having a short-term versus a long-term perspective.
Profitability Growth Should Not Be Misleading
By announcing earnings per share of $2.57, Target demonstrated significant growth of 42% year-on-year. However, the 2nd quarter comparable sales increased by 2%, and this growth is fully provided by the traffic growth of 3%.
The company’s Q3 guidance on earnings is more restrained and declares an earnings-per-share range of $2.1-2.4. If we take its middle, then in relation to the same quarter last year, growth will be only 7.2%, which is also not bad, but far from the astronomical figures above. Most likely, for this reason, the market practically ignored that positive statement.
Looking at the 6 months’ results, Target Corp., with a 29% gross margin, almost 6% operating margin and over 4% net profit margin, occupies a leading position in terms of efficiency in the Consumer Retailing industry. The company is ahead of giants Walmart (WMT) and Costco (COST), second only to Dollar General Corp (DG) in terms of profitability metrics.
Cash flows are also excellent, and the almost 2-fold excess of cash flow from operating activities over net profit indicates its high earnings quality. ROIC has grown from 13.7% to 16.6% over the year, which confirms high operational efficiency. I was surprised that the company calculated it and provided it in the report – usually have to count it myself. Despite my calculations of return on invested capital showing a slightly more modest value, I will operate with official data.
But there is always a “but” in this story for me. If the company stands out in the industry for its profitability, then concerning the broad market, a 4% net margin is not even a moderate level. I also look at the CAPEX, which is 73% of net profit (TTM), and the SGA share of gross profit, which is 71%, and conclude that despite the relative efficiency, the company does not have “killer” competitive advantages, which means it casts doubt on the sustainability of future growth for me.
Author’s Interpretation Of Growth Sustainability
I like the quantitative approach. Firstly, it is objective. Secondly, it provides answers even to questions in those areas where I am not a big expert. Even though the growth rate of e-commerce is higher than that of physical retail, this segment is also growing. By the way, the digital segment of Target showed a significantly greater increase in comparable sales (+8.7%) than the traditional one (+0.7%) in the second quarter.
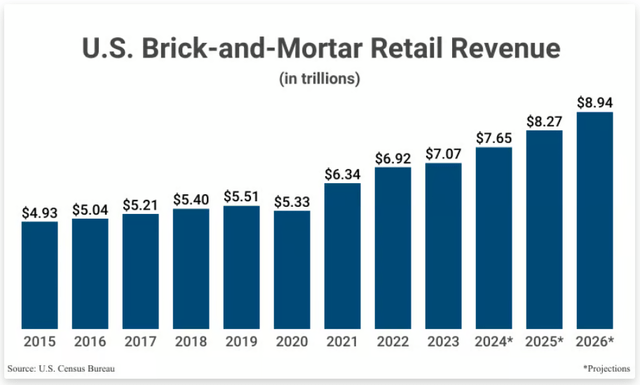
Back to US brick-and-mortar retail revenue. Actual growth was 4.2% CAGR with a high level of stability, and with the continued growth of the US economy, the acceleration of market expansion is expected to be significant (more than 8% CAGR until 2026). However, if we take the last 12 values of YoY changes in Target’s EPS, we will see an extremely low degree of consistency.
How did I determine this? The average value of 25% is 4.5 times lower than the standard deviation of this sample. Based on this, I am very cautious about consensus forecasts and the company’s guidelines. Even relying on them, the projected net income growth just is slightly higher than the actual one over 5 years: 9% vs. 7%. At the same time, the revenue growth rate is expected to fall: 3% vs. 7%. All these numbers are lower than the benchmark for industry.
Analyst future growth forecast: Target vs Consumer retailing (Simplywall.st)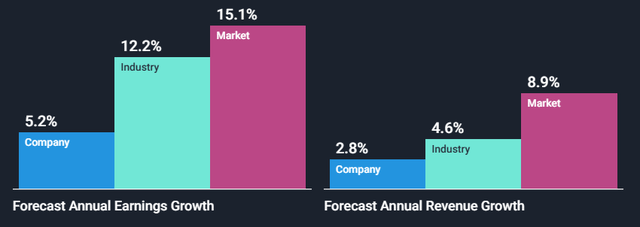
This fact and the low mathematical values of persistence make the company’s further growth questionable for me, which harms the long-term understanding of the stock’s prospects. TGT price jumps are directly related to the company’s net income dynamics.
TGT price and net earnings relation (TradingView)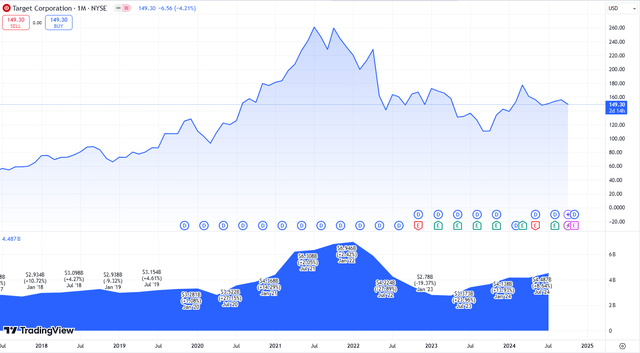
Not Much Room For Margin Increase
I don’t want to mislead by saying that I am relatively bullish in the short term and quite bearish in the longer period. It’s just that different factors come to the fore for different time frames. So despite the current upside, I doubt the company’s long-term confident development.
Here’s another reason: the current operational efficiency is huge, but I still have doubts that the company will be able to maintain its earnings growth rate if revenue growth slows. I did a detailed line-by-line analysis of the last 7 years of income statements and the current balance sheet and found the following interesting facts (comparable periods of 6 months):
- COGS has fallen in the last 2 years from $38.6b to $35.2b, and this decline was stronger than the decline in revenues. This allowed the gross margin to return to levels of ~30%. I see the main reason for this is the decline in inflation. Target cannot keep this factor, especially given the rate cut cycle is on.
- At the same time, SGA expenses are steadily growing even in this period, confidently holding above 70% of gross profit. This indicates an extremely high level of competition and an extremely high risk of losing the market when reducing marketing expenses.
Graphics and calculation by Author. (Company`s reports)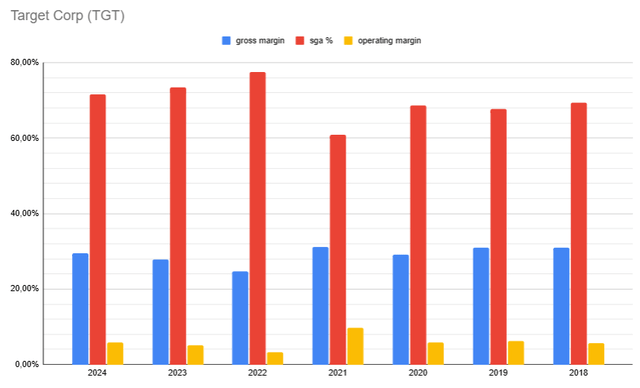
- Although interest expenses make up only 7% of EBIT, and I rate the key metric of debt burden as positive, the other debt indicators are not so good: Cash-flow-to-Debt ratio is significantly less than 1 (0.54) and the debt of $15.4b exceeded equity by 1.17 times. All this, with cash in the accounts of $3.5b, makes further acquisitions to keep the business growth burdensome. And competitors, especially from the e-commerce segment, are not asleep. Amazon (AMZN) invests almost as much in CAPEX as Target sells.
Back To The Undervaluation
Target has a fairly high valuation grade. But it is based on a comparison with the sector median. And here the company does have growth potential.
Seeking Alpha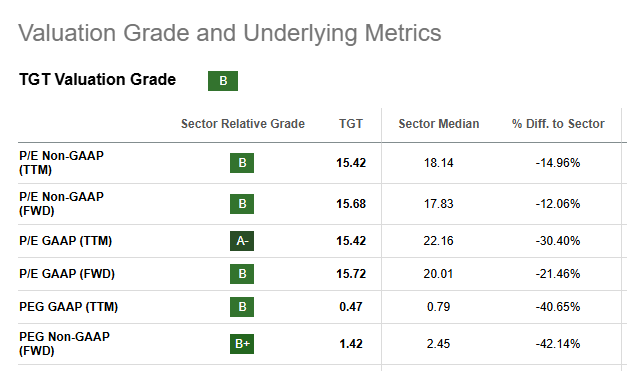
But I think the above risks partly justify this discount, calling into question the outstanding and sustainable growth rates of future periods.
The average price target upside is about 17%, and I pretty much agree with this, having made the calculation using my own method. I keep statistics of company valuation at the end of each report (at the close of the day after the release) and the median value of Target over the last 3 years is 18.3x net profits.
TGT quantitative valuation calculation (by Author)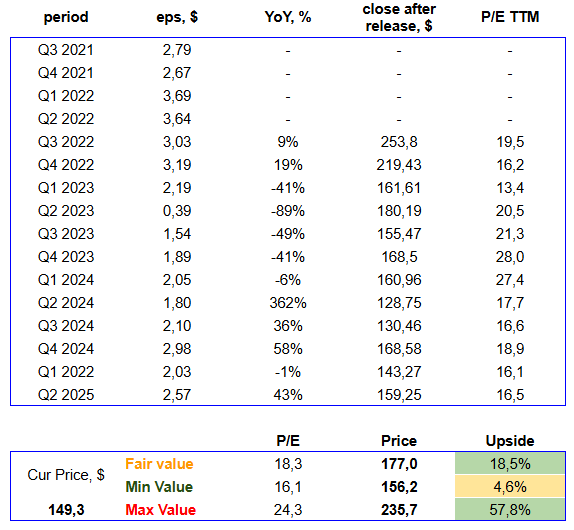
It seems to me that this approach to company valuation has a lot in common with the phrase “fair value” since it takes into account only the opinion of Mr. Market. Since the current P/E is around 15x, I got an upside of 18% to a fair level of $177 (current EPS for 12 months, multiplied by a multiple of 18.3). The current financial performance is quite close to the average and forecast, so I consider this valuation to be highly accurate.
Author’s chart markup by quantitative approach (TradingView)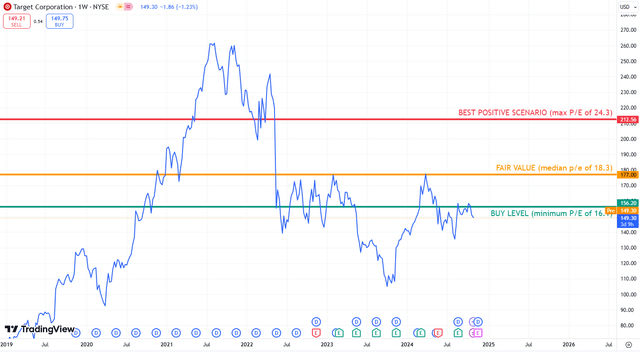
Risk Discussion
Market undervaluation is the core of this investment idea. “Buy” status is based on the historical multiples valuation method and is not supported by other areas of company analysis according to my quantitative model. This means that there are significant risks of revaluation in the long and even medium term in case of earning-per-share volatility.
Author`s comprehensive TGT analysis indicates undervaluation is a main thing (Own model)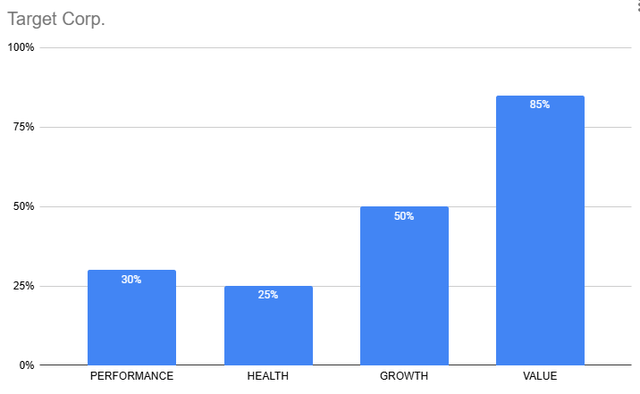
The simplest mathematical analysis above in combination with the characteristics of financial performance indicates a high degree of unpredictability of the company’s results in the midterm. Also, out of the last 10 quarters, 6 reports came out with a strong surprise over expectations, and 4 were missed.
Another pair of values demonstrating a high degree of risk for this investment is TGT`s average annual return and the standard deviation of returns over the last 5 years. The expected return is 6.6% while deviation is hugely 35.2% making this idea pretty risky by default. A beta greater than 1 can add volatility to your portfolio despite being in a defensive sector.
Your Takeaway
Following the latest earnings release, Target returned to the growth track. However, when analyzing the company through detailed quantitative research of the statements, I concluded that the current relative undervaluation by the market is partially justified. It is due to the financial characteristics of the business, which, although exceeding industry benchmarks, fall short of the benchmarks that I have set for myself. I mean low absolute levels of net and operating margins, positive net debt and insufficient growth rates. As a long-term investor, I will avoid investing in TGT, although speculative and riskier colleagues may participate in the campaign to get an 18% upside.
Analyst’s Disclosure: I/we have no stock, option or similar derivative position in any of the companies mentioned, and no plans to initiate any such positions within the next 72 hours. I wrote this article myself, and it expresses my own opinions. I am not receiving compensation for it (other than from Seeking Alpha). I have no business relationship with any company whose stock is mentioned in this article.
Seeking Alpha’s Disclosure: Past performance is no guarantee of future results. No recommendation or advice is being given as to whether any investment is suitable for a particular investor. Any views or opinions expressed above may not reflect those of Seeking Alpha as a whole. Seeking Alpha is not a licensed securities dealer, broker or US investment adviser or investment bank. Our analysts are third party authors that include both professional investors and individual investors who may not be licensed or certified by any institute or regulatory body.
