Summary:
- Target is significantly undervalued, trading at less than 15 times next year’s earnings, with better margins and a 3% dividend yield.
- Despite competition from AMZN, WMT, and COST, TGT’s strong financials and growth in physical retail sales make it a compelling investment.
- TGT’s profitability, with higher margins and dividend yield compared to peers, positions it as a superior income investment.
- E-commerce hasn’t killed physical retail; TGT thrives in this environment, offering the potential for capital appreciation and modest income.
PM Images
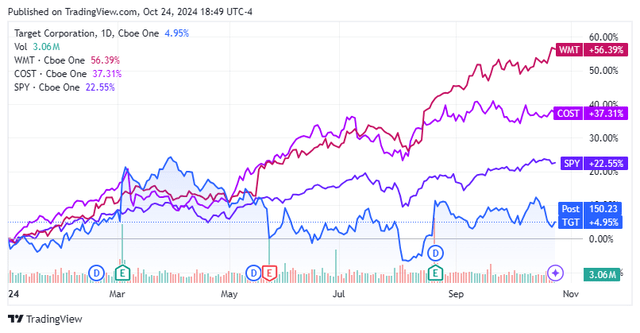
For years, people have discussed the Amazon (AMZN) effect on traditional brick-and-mortar businesses and how e-commerce would crush traditional retail. It’s been more than 4 years since the height of the pandemic, and the retail landscape is stronger than ever. Over the past 12 quarters, the United States has seen increased GDP growth 11 times, with the economy growing by 3% in Q2. While e-commerce has provided efficiency and the ability to save time, many individuals still shop at physical locations. I have been looking for value plays now that the Fed has started the rate-cutting cycle, and Target (NYSE:TGT) is at the top of my list. Shares of TGT are underperforming the market and their peers. After going through TGT’s numbers, I believe this Dividend King is on sale. TGT is trading at less than 15 times next year’s earnings, has better margins than its peers, and pays around a 3% dividend yield, which is also larger than its peers. TGT looks undervalued heading into the holiday season, and this investment could be the gift that keeps on giving.
Risks to investing in Target
Just because I am bullish on TGT doesn’t mean that there aren’t risk factors to consider. TGT continues to face immense competition from companies such as AMZN, Walmart (WMT), and Costco (COST), which can impact their pricing and market share. Global economic and geopolitical conditions are a big factor for TGT, as recessions can deteriorate their ability to generate revenue, while supply chain challenges can cause product shortages. TGT’s business is expensive to operate, and when the cost of goods increases due to inflation, its profit margins are impacted. TGT also faces increased competition from smaller specialty shops and local retailers. TGT is operating a difficult business with many risk factors that should be considered before investing.
Physical retail isn’t dead, and I believe that the consumer is in good shape, which should provide tailwinds for Target
I don’t know about other areas, but when I walk down the street in NYC, I see more AMZN trucks than any other company. I also see more AMZN packages in the package room than from any other company. For some, e-commerce has become second nature, and I feel like I am ordering more and more products online because of how quickly I receive them. Despite the perception I am seeing from looking at the packages in the package room or from the delivery trucks in my community, e-commerce isn’t outpacing physical retail. In 2024, e-commerce is projected to generate $1.32 trillion in sales, which is expected to increase to $1.67 trillion in 2026. While these may seem like large numbers, e-commerce is expected to represent 17.8% of retail sales in the United States this year. E-commerce isn’t expected to crack the 20% level until 2026. While e-commerce continues to increase its percentage of total retail sales, revenue spent in physical locations is still increasing. From the end of 2024 through 2026, e-commerce is expected to add $350 billion in sales, but it’s not causing the overall amount spent in physical locations to deteriorate. Physical retail sales are expected to grow by $109.83 billion over the next 2 years from $6.1 trillion to $6.21 trillion. Just because sales from brick-and-mortar locations is growing at a slower rate than e-commerce doesn’t mean that traditional retail is doomed.
Insider Intelligence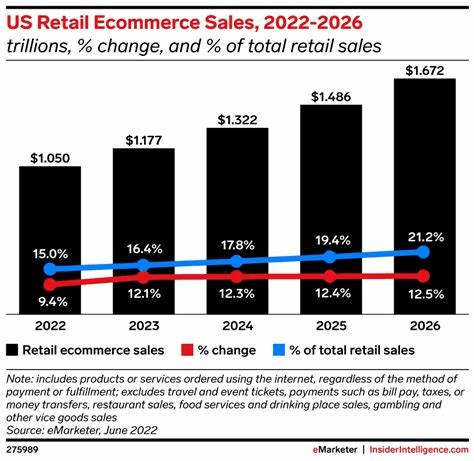
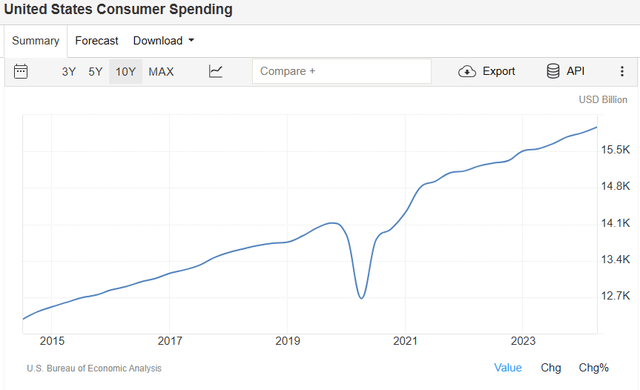
I think that we’re entering into a strong business environment, which should help TGT’s revenue grow. GDP continues to grow while consumer spending in the United States continues to climb higher. Disposable personal income is back to where it was during all the stimulus, and personal spending continues to grow monthly. The Fed just started its rate-cutting process with a 50 bps reduction in September. CME Group expects that we will finish the year with another 2 reductions of 25 bps each. Based on the Fed dot plot, 10 members believe we will have rates under 3% by the end of 2026. When rates decline, so does the cost of capital, creating an environment where businesses are more likely to expand. When businesses expand, they purchase additional goods and services. The carrying cost of debt also decreases, which can make spending on credit cards more affordable. I believe we’re entering a business environment that will be bullish for consumer staples and retailers like TGT. Unless there is a black swam event that causes a shift in economic policy, I believe that there are significant tailwinds from which TGT will benefit over the next several years.
Why I am bullish on Target instead of its competitors
I base a lot of my decisions on the numbers, and I see a great value opportunity in TGT shares. During Q2, traffic increased by 3% YoY, driven by its 6 core merchandising categories. TGT was able to increase its digital footprint as digital sales increased by 8.7%. This was driven by same-day services increasing by double-digit growth. This allowed TGT to beat non-GAAP EPS estimates by $0.39 and revenue estimates by $240 million. TGT raised its full-year guidance range from $8.60 – $9.60 to $9 – $9.70 as they are confident in continued progress. TGT foresees up to 2% in increased sales in Q3, which will help lead the way to a more profitable outlook. Over the past 3 years, TGT has continued to see YoY growth in the holiday season, going from $31 billion in Q4 2021 to $31.4 billion in Q4 2022 to $31.92 billion in Q4 2023. I believe that the macroeconomic setup is bullish for TGT, and there is a lot of value that can be unlocked from its shares.
Steven Fiorillo, Seeking Alpha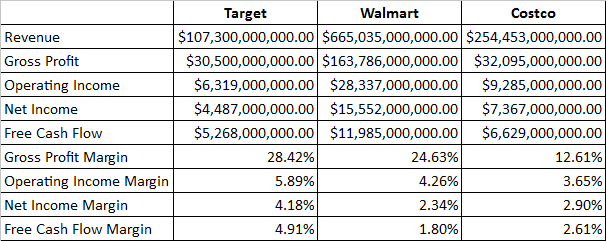
When I look at TGT compared to WMT and COST, it looks like Mr. Market is significantly undervaluing TGT’s shares. TGT generates a fraction of the revenue that WMT and COST, but it’s more profitable on a percentage basis. TGT operates at a 28.42% gross profit margin, compared to 24.63% for WMT and 12.61% for COST. TGT continues to outperform its peers throughout each line of profitability that I look at, including operating income, net income, and free cash flow (FCF) margins. The retail business is a low-margin business, but it is a necessity in society. I would rather invest in the one that has the highest margins and the largest dividend yield. TGT has a 5.89% operating margin, a 4.18% net income margin, and a 4.91% FCF margin. WMT and COST don’t exceed a net income margin of 2.9% or a FCF margin of 2.61%. For every dollar that TGT adds in revenue, it is able to generate more profits than its peers.
Steven Fiorillo, Seeking Alpha
When I look at how the market is valuing these 3 companies based on their current profitability and their forward earnings estimates, TGT looks like it’s in a completely different industry. TGT has a market cap of $69.18 billion and trades at 13.13 times its FCF over the trailing twelve months (TTM). TGT has generated $5.27 billion in FCF compared to COST, generating $6.63 billion, but COST trades at 59.71 times its FCF. These valuations don’t make sense considering WMT and COST trade for more than 55 times their FCF, yet TGT trades at less than 15 times. Some would argue that WMT and COST are probably growing at a quicker rate. The consensus estimates do indicate that there is more forward EPS growth in WMT and COST, but not by much. TGT is trading at 15.78 times its 2024 earnings and 13.17 times its 2026 earnings. TGT is expected to grow its EPS by 19.75% over the next 2 years. WMT trades at 27.50 times its 2026 earnings with 23.77% growth over the next 2 years, while COST is trading at 41.04 times 2026 earnings with 22.23% growth over the next 2 years. From a FCF and earnings perspective, TGT looks massively undervalued compared to its peers.
Steven Fiorillo, Seeking Alpha
Shares of TGT currently produce a $4.64 dividend per share, placing its dividend yield around 3%. TGT has a dividend payout ratio of 48.74% based on its 2024 projected earnings. TGT has also increased its dividend yield for 55 consecutive years, with a 5-year growth rate of 11.37%. WMT and COST have a dividend yield of around 1% and half a percent, with fewer years of dividend growth than TGT. From a dividend perspective, it’s hard not to consider TGT the superior income investment, as it has grown its dividend for the longest duration of years between these companies and has more than tripled the yield.
Steven Fiorillo, Seeking Alpha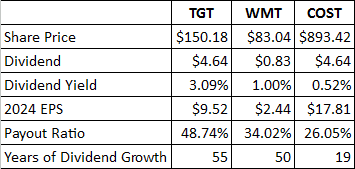
Conclusion
I think that TGT is significantly undervalued, and shares could be much closer to $200 during Q1 of 2025 after Q4 2024 earnings are reported. If TGT was trading at $200, it would still trade at less than 20 times 2025 earnings, which is still value territory. Today, investors are getting TGT at a valuation of 13.13 times its current TTM FCF and 13.17 times 2026 earnings with around a 3% dividend yield. E-commerce hasn’t been the category killer for physical retail, as some have proclaimed, and TGT has been able to thrive in the AMZN era. I think that TGT is trading at a valuation that can generate capital appreciation and modest income for investors going forward. Based on everything I see, TGT is still growing and looks undervalued compared to its peers.
Analyst’s Disclosure: I/we have a beneficial long position in the shares of AMZN either through stock ownership, options, or other derivatives. I wrote this article myself, and it expresses my own opinions. I am not receiving compensation for it (other than from Seeking Alpha). I have no business relationship with any company whose stock is mentioned in this article.
Disclaimer: I am not an investment advisor or professional. This article is my own personal opinion and is not meant to be a recommendation of the purchase or sale of stock. The investments and strategies discussed within this article are solely my personal opinions and commentary on the subject. This article has been written for research and educational purposes only. Anything written in this article does not take into account the reader’s particular investment objectives, financial situation, needs, or personal circumstances and is not intended to be specific to you. Investors should conduct their own research before investing to see if the companies discussed in this article fit into their portfolio parameters. Just because something may be an enticing investment for myself or someone else, it may not be the correct investment for you.
Seeking Alpha’s Disclosure: Past performance is no guarantee of future results. No recommendation or advice is being given as to whether any investment is suitable for a particular investor. Any views or opinions expressed above may not reflect those of Seeking Alpha as a whole. Seeking Alpha is not a licensed securities dealer, broker or US investment adviser or investment bank. Our analysts are third party authors that include both professional investors and individual investors who may not be licensed or certified by any institute or regulatory body.

