Summary:
- Peter Lynch is best known for identifying what he calls “10 baggers.”
- And the PEG ratio he developed to identify fast growers at a relatively reasonable valuation has become a standard part of the investing vocabulary.
- In this article, I will explain why Tesla, Inc. now begins to show some of the key traits that Lynch used to identify these 10 baggers.
- Its PEG is higher than the 1x ideal Lynch pick.
- My estimate is ~1.8x, justifiable for its unique strengths in my view.
phototechno
Thesis
Peter Lynch probably is best known for picking 10 baggers. In his writings (e.g., Beating the Street is my favorite one), he divided stocks into 6 categories ranging from stalwarts, to turnarounds, to fast growers. And fast-growers seem to be Lynch’s favorites. These are stocks that can grow their annual earnings at 20%+ year. He mentioned multiple times an investor’s biggest gains come from fast growers. However, these fast growers are also inherently riskier.
As such, he provided some guidelines for limiting the risks, which leads me to the main thesis of the day. in the remainder of this article, I will explain why Tesla, Inc. (NASDAQ:TSLA) begins to fit these guidelines under current conditions. More specifically,
- A scale leader in a fast-growing industry. TSLA is a dominant player in the burgeoning electric vehicle (“EV”) space, which has years, if not decades, of sharp growth curve ahead.
- Inventories. Inventory level is a place that investors can easily check (but often don’t sadly). Inventories are one of the most reliable financial data (in the sense that they are less open to subjective interpretation). And yet inventories are highly indicative of the demand and health of any business. And you will see TSLA’s inventory level indicates its products are hugely popular and it has been very effective in managing its vast logistic systems amid all the ongoing challenges.
- A reasonable valuation. As mentioned, the Lynch PEG ratio (P/E multiple divided by growth rate) is now part of the daily investing vocabulary. He prefers a PEG around 1x for fast growers. You will see that TSLA’s current PEG is not as low as 1x yet. But it is getting close. My estimate is around 1.8x, justifiable for its unique strengths such as those just mentioned above.
1. A scale leader in a fast-growing industry
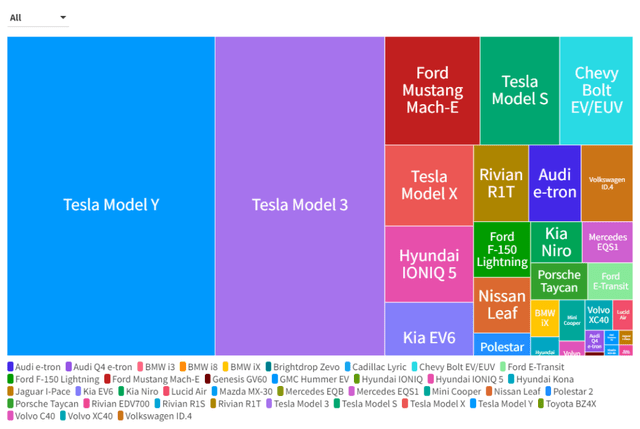
Tesla has been the leading producer and seller of electric vehicles globally for several years. Other major EV makers such as Volkswagen, General Motors, and Toyota have also been ramping up their electric vehicle production and sales in recent years, but their numbers are still significantly lower compared to Tesla’s as you can clearly see from the following chart. TSLA is the clear leader, with its Model Y and Model 3 X occupying the top 2 spots in market shares with Ford Mustang as distant third.
Looking ahead, I see its leading position to sustain for various reasons, with scale itself and brand appeal as the top ones.
In terms of manufacturing scale, Tesla has already passed the critical economies of scale as argued in my earlier articles, making it much more cost-competitive compared against other makers. And Tesla has cultivated a strong brand image and captured a large fan base with its sleek and minimalist design. At the same time, it keeps introducing “cool” features such as autopilot and over-the-air updates to keep the fans excited and anticipating.
2. Inventory control
As mentioned earlier, inventory is a place that investors can and should also check, especially for fast growers. It is a reliable indicator of the efficient use of resources, customer satisfaction, cash flow management, and also balance sheet management.
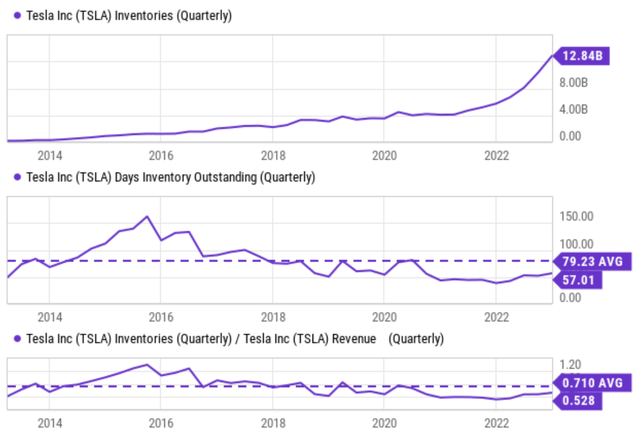
The next chart shows TSLA’s inventories in absolute dollar amount (top panel), in terms of days outstanding (mid panel), and finally also as a percentage of its sales on a quarterly basis. In my mind, these results show all the signs that Lynch would like to see for a fast grower. To wit, as seen in the top panel, TSLA’s inventories have been increasing rapidly in terms of dollar amount, reaching $12.8B in the most recent quarter.
However, the middle and bottom panels suggest that products are so popular and demand so strong that the inventories are below average in terms of day outstanding and as a percentage of sales. The middle panel shows that its current days of outstanding inventory hovers around 57 days, far below its historical average of 79 days. The bottom panel shows that its current inventory is only about 52.8% of its sales, far below the historical average of 71%.
All told, I view these results as very indicative of the health of TSLA’s grow and management’s effectiveness. Amid all the ongoing challenges (such as COVID lockdowns and global supply chain disruptions), it has achieved a good balance between customer satisfaction (with a reasonable amount of inventory) and cash flow management (without too much capital tied up in inventories).
3. Valuation and the Lynch PEG ratio
As aforementioned, TSLA’s current PEG is not as low as 1x yet. My estimates of its current PEG ratio(S) are shown in the two charts below. These estimates are made based on a few assumptions to be detailed just in a little bit. And all told, I see a PEG ratio around 1.8x currently, again, not as ideal as the 1x that makes a perfect Lynch pick. But I see it as justifiable for its unique strengths such as its scale and premium brand image mentioned above.
My PEG estimate is based on its FWD P/E ratio of 47.9x taken from Seeking Alpha as shown in the first chart below. Its EPS has been growing at a rate of 58% in the past 5 years (growth rates in the past 10 years are not meaningful in this case). Looking ahead, the consensus estimates project its EPS annual growth rates to be in the range of 18.8% to 30% as seen in the next few years. The CAGR is about 25%. And based on this CAGR, the PEG ratio turns out to be about 1.92x.
Then finally keep in mind that TSLA current has a net cash position of $22.1 billion on its ledger, translating into about $6.7 per share. Thus, its P/E ratio is a bit lower if its cash position is accounted for (about 46.3x compared to the 47.9x before the adjustment). As a result, its PEG ratio is also a bit lower due to this adjustment (about 1.85x).
Source: Seeking Alpha data Source: Author based on Seeking Alpha data

Risks and final words
Besides its PEG ratio being higher than 1x, TSLA investment entails a few other risks too. Competition in the EV is intensifying. A large part of TSLA’s success today owes to its early mover advantage. It was one of the first companies to enter the EV space and enjoyed a significant first-mover advantage. However, now all major auto makers, such as heavyweights like Volkswagen, General Motors, and Toyota, are all ramping up their electric vehicle productions. And as detailed in my earlier article, the colorful personality of its CEO, Elon Musk, is a double-edged sword. He has been criticized by the media for many things. And most recently, with his Twitter acquisition, he was criticized for being distracted with too many things (see details in this CNBC report).
To conclude, I see TSLA begins to fit into all the criteria of Peter Lynch fast grower. It is a scale leader in a fast-growing industry. And in the way I see things, its inventory level confirms the health of its continued growth curve. Its PEG ratio (~1.8x according to my estimate) does not make it a perfect Lynch pick with 1x PEG. But I view it as justifiable given Tesla Inc’s scale leader status and premium brand image.
Disclosure: I/we have no stock, option or similar derivative position in any of the companies mentioned, and no plans to initiate any such positions within the next 72 hours. I wrote this article myself, and it expresses my own opinions. I am not receiving compensation for it (other than from Seeking Alpha). I have no business relationship with any company whose stock is mentioned in this article.
As you can tell, our core style is to provide actionable and unambiguous ideas from our independent research. If your share this investment style, check out Envision Early Retirement. It provides at least 1x in-depth articles per week on such ideas.
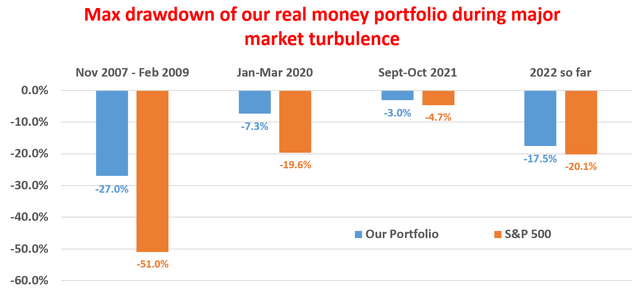
We have helped our members not only to beat S&P 500 but also avoid heavy drawdowns despite the extreme volatilities in BOTH the equity AND bond market.
Join for a 100% Risk-Free trial and see if our proven method can help you too.


