Summary:
- A previous Tesla, Inc. bearish target of $122 has been bypassed with intent.
- This article will cover how I determine targets through wave patterns and the origins of my theory.
- We will then examine the Tesla, Inc. charts to see where the technical next stop lies.
MikeMareen
In this article, we will cover how Tesla, Inc. (NASDAQ:TSLA) rapidly bypassed my additional bearish target to drop towards the $100 region with intent. We will examine the next technical stop for Tesla and how quickly it may get there.
For the best part of a year, the consensus has been that I have been bashing Tesla.
The truth is I have no ill feeling towards Tesla. I am not overly enamored about the next digital stratosphere the world is propelling itself into, and believe humans are happier making their own cup of tea rather than Cedric the Robot making it for them. That is, of course, before he knows before you do what tv channel you would like to watch next so that you don’t even have to go so far as lift a tv remote!
My job is to, for want of a better word, “predict” the future price of a financial market. And that’s what I try and do. How I do that didn’t actually come from technology. Yes, it was derived from all the technology available when making a future pricing decision, but the basis actually started from the 1700s. Supposedly, candle sticks were used to gauge future demand for rice in a market in Osaka by a Japanese rice trader named Muneshia Homna.
Undoubtedly he didn’t have a trading screen at his market stall, so who knows how he predicted future commodities pricing using these instruments. But a decade ago, I set about figuring out how any form of future pricing equation can be derived from the formation of certain candlesticks patterns.
During my studies, I noted that candlesticks can represent a wave of buying or selling if you know how to identify a said wave. Eliminating all indicators as lagging and unreliable while studying time frames extensively, it was Ralph Nelson Elliott that first identified buying or selling in a financial markets as “waves” in 1932. I determined that he could correctly identify the future price direction of a financial market through identifying waves. The issue that I have with his theory is that he charts five different waves where it is actually the third wave where the high probability lies. Elliott Wave theorists can give several different price predictions, and when one of them hits they say, “I called that.”
Where, if you narrow it all down, there is one exact price that has a high probability of being hit, so why put your chips on several.
To be able to assist aspiring traders and finance professionals to understand how a financial market moves from one price region to another, I wrote the Ward Three Wave Theory. It is my interpretation of how to identify with any form of certainty that a financial market will go from one price region to another.
I am using this interpretation to predict a future price for Tesla, because my initial price prediction in Spring last year was so low ($176) it was taken that I was bashing Tesla. I wasn’t, I was using my interpretation of how a financial market moves in waves to arrive at a certain price region.
You may have read the last Tesla article. At the time of writing, Tesla was lingering around the mid $150 region, with $122 showing as the technical next destination. What I wasn’t aware of, was how fast it would get there.
When an equity goes through a stock split, the cemented wave patterns are also split, and it can be challenging to derive a new wave pattern post-split for a considerable time.
In the case of this chart, C Trader has transferred the original wave pattern skeleton pre-stock split.
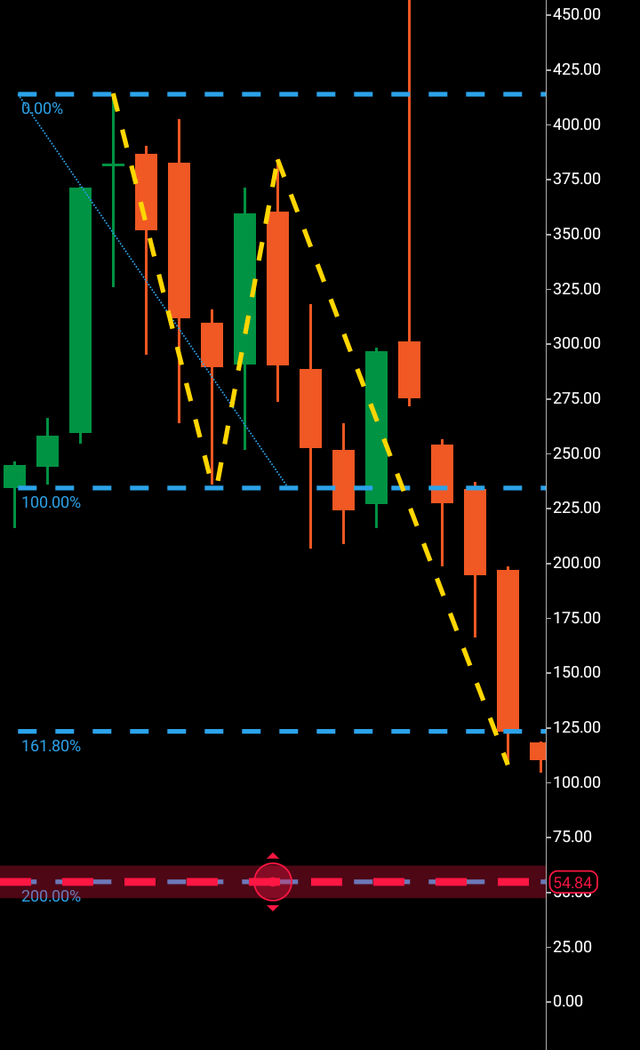
We can see in the chart below, the wave one $414-$233 was bypassed by the third wave, heading eventually to the Fibonacci 161 at $122.
Tesla current monthly chart with targets (C Trader )
The next stop should be $90 from here before an attempt at completion for a numerical wave one replication at the $55 region.
To summarize, I would expect Tesla to first arrive at $90 within the next 30 days or before, and look to complete its third wave at $55 within the next 30-90 days. Should this be the case, I will be publishing a follow-up article at any of the outlined target regions charting any bullish turnaround patterns. I have selected Hold, as a sell signal has already been issued circa the $150 region in a previous article.
Disclosure: I/we have no stock, option or similar derivative position in any of the companies mentioned, and no plans to initiate any such positions within the next 72 hours. I wrote this article myself, and it expresses my own opinions. I am not receiving compensation for it (other than from Seeking Alpha). I have no business relationship with any company whose stock is mentioned in this article.
