Summary:
- Tesla, Inc. stock is exhibiting weakness and is at a critical juncture, presenting both downside risk and short-term profit opportunities.
- The U.S. economy shows mixed signals, with the technology sector performing well but consumer sectors facing slower growth and mounting debt.
- Tesla might rebound and reach overhead resistance, yet there’s a higher probability of a retracement toward support levels, indicating further decline in the stock.
- In this technical article, I discuss important price levels for Tesla and metrics that investors could consider for gaining an edge on the stock’s likely price action.
seraficus
In my recent analysis, I’ve observed Tesla, Inc. (NASDAQ:NASDAQ:TSLA) exhibiting weakness following a failed breakout attempt, signaling a critical juncture. While there’s potential for further downside risk, there are also opportunities for profit in the shorter term. I’ve confirmed TSLA as a sell position, but I also highlight a scenario that could be profitable for investors interested in scaling into the stock. Not getting trapped in a downtrend is crucial, and I discuss strategies to navigate this situation effectively.
A Macro Perspective
On an annual basis, the technology sector in the U.S. continues to lead in performance, closely trailed by companies in communication services. However, while performing well, the U.S. consumer cyclical sector is experiencing significantly slower growth than in previous months. Despite indications of resilience in the U.S. economy and the widespread adoption of a soft landing scenario, questions arise about the actual brightness of the economic situation.
Globally, millions of jobs are at risk due to automation, robotics, and AI displacing traditional skills and knowledge. Recent announcements, such as United Parcel Service, Inc. (NYSE:UPS) cutting 12,000 jobs, DocuSign, Inc. (NASDAQ:DOCU) reducing its workforce by 6%, and Snap Inc. (NASDAQ:SNAP) downsizing by 10% following a 20% reduction in 2022, add to a growing list of layoffs across various industries. Also, Tesla is reportedly exploring possible layoffs, hinting at weakness also in the promising electric vehicle [EV] industry. An increasing number of companies are announcing significant staff reductions, with over 5,487 mass layoff announcements made since January 2023, and 776 since the start of 2024.
Several factors drive the resilience of the U.S. economy, despite concerning trends in consumer debt. The massive $1.13 trillion credit card debt held by U.S. consumers, which saw a notable 14.5% increase in Q4 2023 alone and has surged by 136% over the past 23 years, underscores a significant financial burden. Since the onset of the pandemic, credit card debt has disproportionately risen by $273 billion since Q4 2021, exacerbated by soaring interest rates now averaging 24.59% for new credit cards, with many exceeding 30%. These factors suggest a likelihood of continued debt accumulation in the foreseeable future.
Additionally, the decrease in the personal saving rate to 3.7% in December 2023, down from 8.5% pre-pandemic and a peak of 32% in April 2020, raises concerns about financial stability. Auto debt has surged to $1.61 trillion in Q4 2023, a $12 billion quarterly increase and a $55 billion rise over the past year, surpassing its $1 trillion average over the past two decades. Student loan debt remains stagnant at record levels of $1.60 trillion, while mortgages have soared to new highs of $12.25 trillion, significantly exceeding the two-decade average of $8.67 trillion.
Despite encountering challenges associated with debt, the U.S. economy has displayed resilience, primarily credited to robust consumer spending, investment activity, and government stimulus initiatives. However, the endurance of this resilience is now under scrutiny amid escalating debt levels and ongoing shifts across various industries. The latest inflation reading of 3.1%, primarily propelled by rises in services, utilities, and food costs, underscores the presence of inflationary pressures.
While credit card delinquency remains relatively low at 2.98% in Q3 2023, its nearly doubled rate over the past two years raises alarms, although it remains below the peak of 6.77% observed in 2009. Furthermore, concerns persist as personal and commercial bankruptcies surged by 18% in 2023 compared to the previous year, with commercial filings experiencing an even sharper rise of 72%. Projections indicate a further increase in bankruptcies in 2024, signaling underlying financial strain despite low delinquency rates. This amalgamation of factors casts doubt on the sustainability of consumer resilience amidst mounting debt, industry transformations, and persistent inflationary pressures.
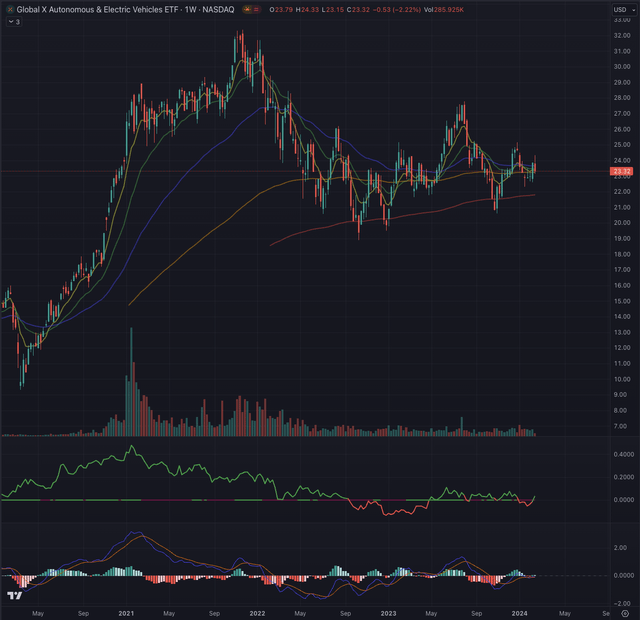
The Global X Autonomous & Electric Vehicles ETF (DRIV) has recently found support on its long-term exponential moving average [EMA] following its inability to establish a new uptrend. The industry benchmark is trading sideways within a range of $20 to $25. Neither the moving average convergence divergence [MACD] indicator nor the relative strength readings, particularly when compared to the broader stock market represented by the iShares Russell 2000 ETF (IWM), indicate any notable trend buildup.
Where are we now?
In my article “Tesla: Reality Check And Awakening” published on October 26, 2023, I decided to downgrade TSLA to a sell position. My analysis led me to anticipate a high probability of the stock weakening over the foreseeable future. However, as suggested, the stock could initially attempt to close a significant gap before further downward movement.
“TSLA could retrace from the recent drop and while trying to enter again the ascending trendline, fill the gap between $230.61 and $242.08.”
In my analysis, I identified the price range between $173 and $177 as a crucial support area. If TSLA failed to overcome overhead resistance and was rejected by the ascending trendline, it would likely head toward this support range.
“Long-term-oriented shareholders, or new investors interested in adding Tesla shares, could wait for a better entry, which I define as either at around $175”
The stock has indeed traced a very similar trajectory by filling the gap before heading to testing the support, allowing investors who followed my call to avoid losses or even achieve substantial performance, while it’s now the right time to update my contingency plan.
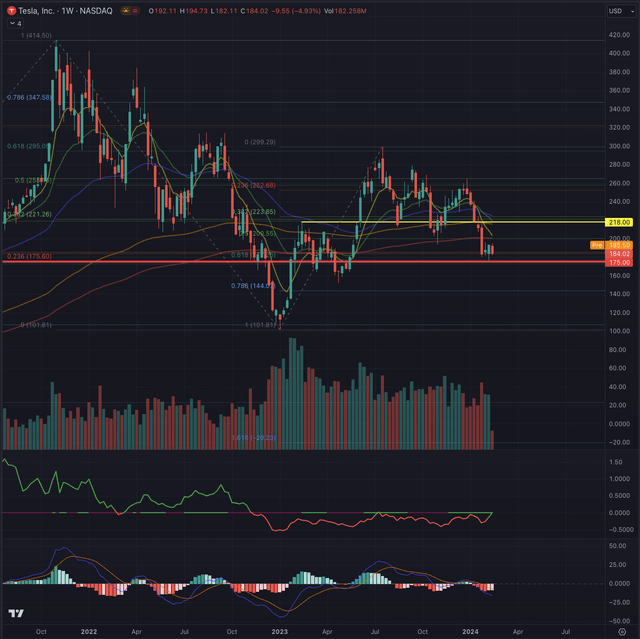
On its weekly chart, TSLA is currently hovering within the support area, which aligns with the 61.8% Fibonacci retracement from the previous peak. The stock faces challenges in overcoming negative momentum, as indicated by the declining MACD. Moreover, TSLA’s performance is weaker than the technology index, represented by the Nasdaq Composite (IXIC).
Recent price action suggests that TSLA has failed to establish an uptrend and is forming a new downtrend. As it tested the support area, an initial positive reaction was evident in the two weekly volume bars.
What is coming next?
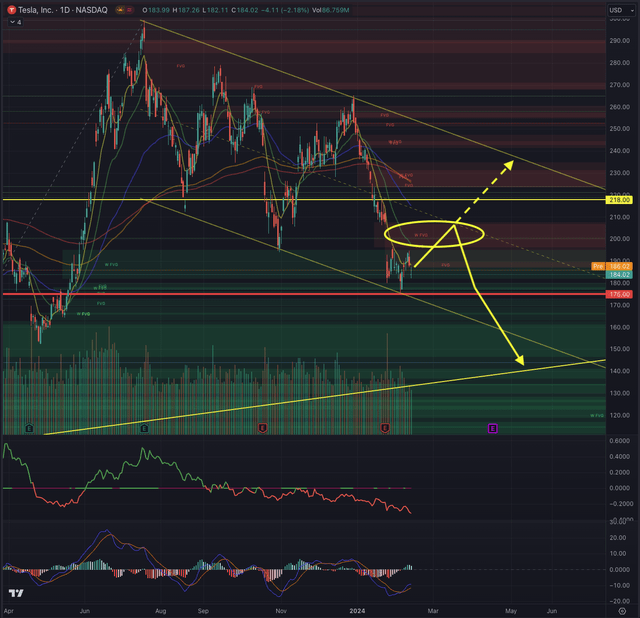
TSLA’s recent price action has resulted in another notable gap, from $196.36 to $206.77. This gap will likely be filled, potentially prompting the stock to re-test the mid-range of the downward trend channel. From this point, TSLA could encounter two potential scenarios.
In the first scenario, short-term positive momentum could propel TSLA to break the overhead resistance at $218. This could lead to a test of the ceiling of the trend channel, ranging between $230 and $235. However, this scenario is less likely due to the significant strength required for TSLA to overcome all its overhead resistance, including trailing resistances from moving averages pushing down the price.
The second scenario appears more probable. Here, TSLA would fill the gap and retrace towards its support level at $175. Upon its second attempt, it could break down further and reach a vital liquidity pool left between $152.37 and $146.41, closing the open gap in that area. This price range would align with the trendline traced from the pandemic low, confirmed by the significant rebound observed on January 6, 2023. This area is highly important for short- and long-term investors, offering opportunities alongside considerable risks.
While a rebound is not out of the question and could present intriguing swing-trade opportunities, the current circumstances do not favor long-oriented investors. Therefore, I maintain my sell rating on TSLA.
The bottom line
Technical analysis isn’t a definitive tool, but rather a means to increase the likelihood of success for investors and provide them with direction in the market. Just as one would only embark on a journey by consulting a map or using a GPS, investors benefit from using technical analysis to guide their investment decisions. I incorporate techniques grounded in the Elliott Wave Theory and Fibonacci’s principles to assess potential outcomes and probabilities over time. By validating the likelihood of specific outcomes based on these theories, I aim to identify stock entry points after examining their price action, sector, and industry dynamics. Ultimately, my technical analysis seeks to comprehensively evaluate a stock’s situation and calculate probable outcomes, empowering investors to make informed decisions and navigate the market effectively.
In summary, the U.S. economy shows mixed signals, with the technology sector performing well but consumer sectors facing slower growth and mounting debt. TSLA faces challenges amid fluctuating stock market trends, with two potential scenarios indicating a possible retracement towards support levels. Despite the chance of a rebound, the outlook for long-term investors remains uncertain, promoting a sell rating on TSLA.
Analyst’s Disclosure: I/we have no stock, option or similar derivative position in any of the companies mentioned, and no plans to initiate any such positions within the next 72 hours. I wrote this article myself, and it expresses my own opinions. I am not receiving compensation for it (other than from Seeking Alpha). I have no business relationship with any company whose stock is mentioned in this article.
All of my articles are a matter of opinion and must be treated as such. All opinions and estimates reflect my best judgment on selected aspects of a potential investment in securities of the mentioned company or underlying, as of the date of publication. Any opinions or estimates are subject to change without notice, and I am under no circumstance obliged to update or correct any information presented in my analyses. I am not acting in an investment adviser capacity, and this article is not financial advice. This article contains independent commentary to be used for informational and educational purposes only. I invite every investor to do their research and due diligence before making an independent investment decision based on their particular investment objectives, financial situation, and risk tolerance. I take no responsibility for your investment decisions but wish you great success.
Seeking Alpha’s Disclosure: Past performance is no guarantee of future results. No recommendation or advice is being given as to whether any investment is suitable for a particular investor. Any views or opinions expressed above may not reflect those of Seeking Alpha as a whole. Seeking Alpha is not a licensed securities dealer, broker or US investment adviser or investment bank. Our analysts are third party authors that include both professional investors and individual investors who may not be licensed or certified by any institute or regulatory body.


