Summary:
- Earlier this month, I published an article to address the concerns Charles Munger voiced about Tesla, Inc.
- The article triggered heated debate, and the goal of this article is to collectively address a key theme: The margin pressure that BYD can put on Tesla.
- Here, I will explain why this should not be a concern. I will analyze Tesla’s production cost to argue why it has passed the breakeven point already.
- And, more importantly, I foresee the recuperation of its fixed cost will hasten and its current superior margin will continue.
- Consensus projections seem to support my view (but still underestimate Tesla’s profitability potential).
Xiaolu Chu
Thesis and Background
Earlier this month, I published an article on Tesla, Inc. (NASDAQ:TSLA) to address the concerns Charlie Munger had voiced about it, especially compared to BYD Company Limited (OTCPK:BYDDF, OTCPK:BYDDY). The article was very well-received by the Seeking Alpha community. So first and foremost, I want to thank everyone for reading and for all the thoughtful comments and critiques.
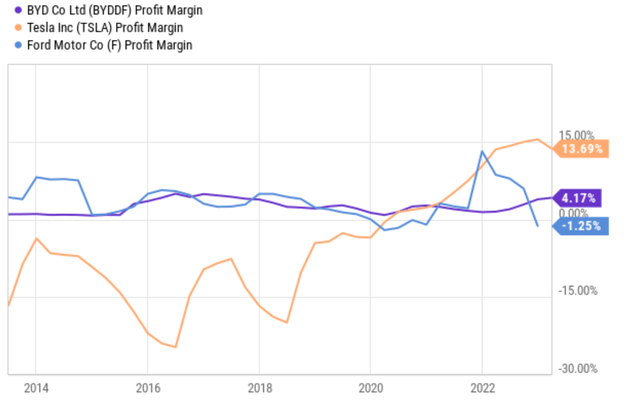
Given the volume of the comments (approaching 250 in total), I won’t be able to post individual responses. So here, I will do the next best thing feasible – I will collectively address a key theme in the comments section: the margin pressure that BYD can put on Tesla. Many of the discussions surrounding this theme were triggered by the following chart that I used in my original article.
I used this chart to address the following comments that Munger made about BYD and TSLA:
TSLA’s profit vs BYD’s. Munger lauded (see this Business Insider report) BYD for growing rapidly in its home market and leaving Musk in the dust. “BYD is so much ahead of Tesla in China it’s almost ridiculous,” The billionaire investor pointed out that Tesla cut its car prices in China last year, while BYD was able to raise prices.
And the key point I attempted to make with this chart is that TSLA’s profit margin was higher than BYD’s (and other EV makers’, too) despite the price cuts that Munger mentioned.
The comments that argued against my above point came in various forms and shapes. But an underlying theme behind all the forms and shapes is this: the above data is backward looking. And it is obviously a very fair and valid theme.
So, this article has one single purpose – to form a forward-looking analysis of TSLA’s future profit margin. Let’s begin.
Consensus Estimates
I will start with the consensus estimates, summarized in the following two tables below. The gist of these two tables is to show the profit margin implied by the consensus estimates of Tesla and BYD’s EPS and sales. The consensus estimates for Tesla’s EPS and total revenue in the next five years are shown in the first table. And the implied net profit margin (“NPM”) in the next five years is shown in the fourth column. Note that in this analysis, I assumed TSLA’s number of outstanding shares to be constant at the current level of 3.47B shares. The analyses for BYD were made in a similar way with two minor differences. First, there are only two years of consensus estimates available for BYD. And second, I assumed its number of outstanding shares to remain constant at 2.91 B shares.
As seen, consensus estimates imply an NPM of 11.7%-13.5% for TSLA in the 5 years (and the average is 12.6%) period. In contrast, consensus estimates imply an NPM of 4.6% and 5.6% for the next two years.
To conclude, consensus projections support the view that TSLA’s profit margin will remain far superior to BYD going forward. Next, I will explain why I agree with this view, and also go a step further to argue why this view may still underestimate Tesla’s margin potential.
Author based on Seeking Alpha data. Author based on Seeking Alpha data.

TSLA’s Cost Structure
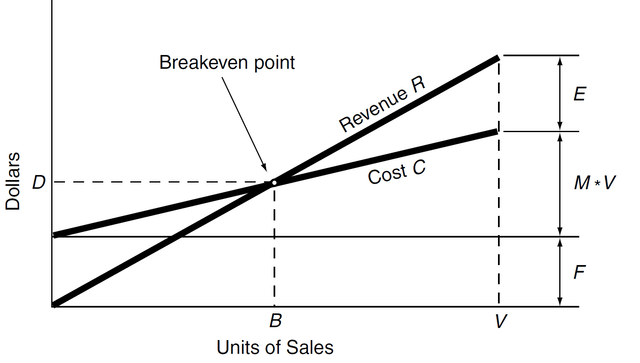
I will anchor my analysis with the very basics: variable and fixed costs. In case you need a refresher on these concepts, the chart below (taken from A Modern Approach to Graham and Dodd Investing by Thomas P. Au) does a good job. The concept behind the chart is very straightforward. Profit is determined by volume (e.g., the number of cars that TSLA sells), price, and cost. Costs are then further divided into fixed and variable costs. The former is incurred upfront (like the cost to build a factory) and does not vary too much with the level of output. The latter varies with the level of output, with almost a linear relationship.
Therefore, a business like TSLA must first reach the breakeven point (point B shown in the chart above) and recuperate its fixed cost before it can make a profit. After that, the higher the volume of sales, the lower the average cost per unit becomes because fixed costs are spread out over more units. As a result, profit margins should improve as the volume of sales increases.
And my analyses, summarized in the two charts that follow, show that TSLA has long passed this breakeven point and, therefore, enjoys either a stable margin or even expanding margin as its shipping volume increases. To wit, the first chart shows Tesla’s CFO (cash from operations) as a function of its average vehicle selling prices over the years. As seen, the average selling price tag declined dramatically from $80.9k in 2015 to $57.5k in 2021. This is while Tesla profits soared, instead of dropped, from a loss of $10.5k per vehicle in 2015 to a profit of $12.2k in 2021. This is a textbook sign of crossing the breakeven point.
Now, let’s zoom in on the recent 4 quarters from 2021, as shown by the last 4 data bars in the chart. In the past 4 quarters, Tesla continuously dropped its average vehicle selling price, from $66.5k to $55.2k per vehicle. There are some fluctuations in the average profit per vehicle sold, but I view these fluctuations in the past 1-2 years to be temporary and not representative of long-term fundamentals. Recall in the past 1~2 years, TSLA has been dealing with the logistic interruptions of the pandemic, its Shanghai factory lockdowns, the price hikes in raw material caused by the Russian/Ukraine situation, et al.
Author based on TSLA earnings reports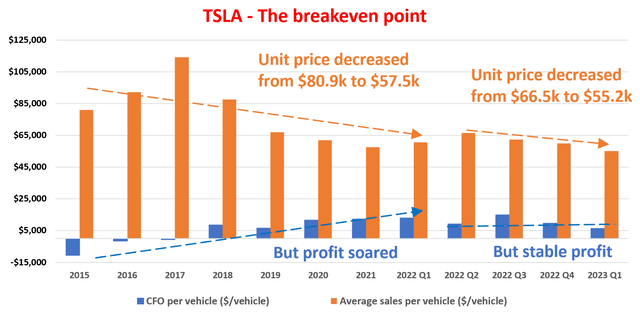
Furthermore, its average profit per vehicle remained very healthy even during this extremely turbulent period. To wit, the average CFO during the past 4 quarters dialed in at $9,997 per vehicle sold. The next chart drives the point further by highlighting the last two data points (Q1 2023 and Q4 2022) against a fit of its fixed and variable costs. The dark blue dots show Tesla’s total revenue (vertical axis) as a function of its total vehicles delivered during a given period. The orange dotted line shows the best fit of Tesla’s data since 2015 according to the cost model introduced at the beginning of this section. As seen, its performance during the past 2 quarters, again despite the turbulence and fluctuations, actually falls pretty close to the trend line.
Author based on TSLA earnings reports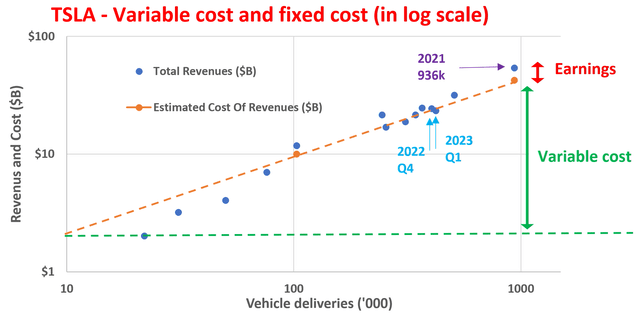
Risks and Final Thoughts
Just to clarify, the thesis is not to argue BYD is a bad company. On the contrary, BYD is a great company, too, and it has several competitive advantages over TSLA. I view BYD as a more vertically integrated company than TSLA. It manufactures most of its own components, including batteries (which batteries are leading TSLA in some key areas), motors, and electronic control units. This gives BYD more control over its costs and allows it to pass on savings to consumers. Tesla, on the other hand, relies more on third-party suppliers for some of its key components. Also, BYD has a strong presence and an almost inherent advantage, in my view, in the Chinese market, the world’s largest EV market, and a key market for TSLA.
The thesis is to address the profit margin of Tesla, Inc. in the coming years. And my point is that I see TSLA’s superior profit margin continuing or even expanding based on the analyses of its cost structure. I don’t see a necessary and direct connection between price cuts and profitability.
Editor’s Note: This article discusses one or more securities that do not trade on a major U.S. exchange. Please be aware of the risks associated with these stocks.
Analyst’s Disclosure: I/we have no stock, option or similar derivative position in any of the companies mentioned, and no plans to initiate any such positions within the next 72 hours. I wrote this article myself, and it expresses my own opinions. I am not receiving compensation for it (other than from Seeking Alpha). I have no business relationship with any company whose stock is mentioned in this article.
Seeking Alpha’s Disclosure: Past performance is no guarantee of future results. No recommendation or advice is being given as to whether any investment is suitable for a particular investor. Any views or opinions expressed above may not reflect those of Seeking Alpha as a whole. Seeking Alpha is not a licensed securities dealer, broker or US investment adviser or investment bank. Our analysts are third party authors that include both professional investors and individual investors who may not be licensed or certified by any institute or regulatory body.
As you can tell, our core style is to provide actionable and unambiguous ideas from our independent research. If your share this investment style, check out Envision Early Retirement. It provides at least 1x in-depth articles per week on such ideas.
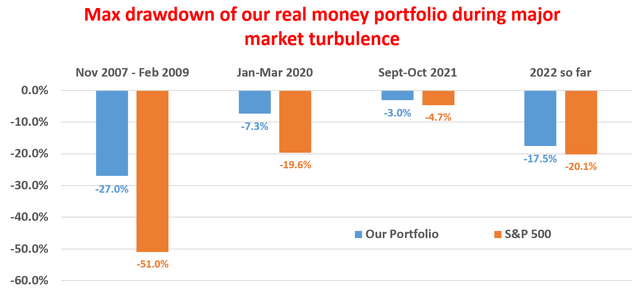
We have helped our members not only to beat S&P 500 but also avoid heavy drawdowns despite the extreme volatilities in BOTH the equity AND bond market.
Join for a 100% Risk-Free trial and see if our proven method can help you too.
