Summary:
- I have been a long-time bull on Tesla, Inc., but recently changed my thesis due to several concerns.
- After reading its Q2 earnings report, my concerns grew.
- This article will point out a few less-discussed issues from its Q2 report and evaluate the stock with Peter Lynch’s framework of identifying fast growers.
- You will see that Peter Lynch himself probably would not consider Tesla a good candidate under current conditions.
Blue Planet Studio
Thesis
Tesla, Inc. (NASDAQ:TSLA) just released its 2023 Q2 earning report (“ER”) last week. As a popular stock on the Seeking Alpha platform, the ER has been scrutinized by a series of excellent articles immediately after its release. Therefore, in this article, I won’t repeat the basics. Instead, I will focus on a few less-discussed issues from its ER. And I particularly picked these issues according to Peter Lynch’s framework of identifying fast growers.
With this background, in the remainder of this, I will examine the following 3 aspects of the ER:
- Its role in the electric vehicle (“EV”) sector. Its Q2 ER shows that TSLA continues to be a scale leader in a fast-growing industry – the first thing that Lynch himself would have checked.
- Its PEG ratio (P/E to growth rate ratio). Lynch developed and popularized the PEG ratio, and you will see that the stock’s current PEG Ratio is far above the 1x threshold that Lynch would like to see no matter how you slice and dice its Q2 financials.
- Its inventories. Lynch also has the insight that inventories are a good and reliable sign of showing the health of the company. And I see several concerning issues from its Q2 ER.
Still a clear scale leader
First, let’s look at the positives. Besides the many other positives that other bullish SA authors have detailed, one of the loudest messages to my ears from the ER is that TSLA continues to be a scale leader in a fast-growing sector. As seen in the first chart below (taken from its ER), its vehicle production and deliveries have been growing at a rapid pace quite consistently across all models. To cite a few numbers, its total vehicle production grew 86% YoY and total deliveries grew 83%. Both total production and total deliveries are approaching half a million vehicles per quarter now.
Source: Tesla 2023 Q2 Earnings Report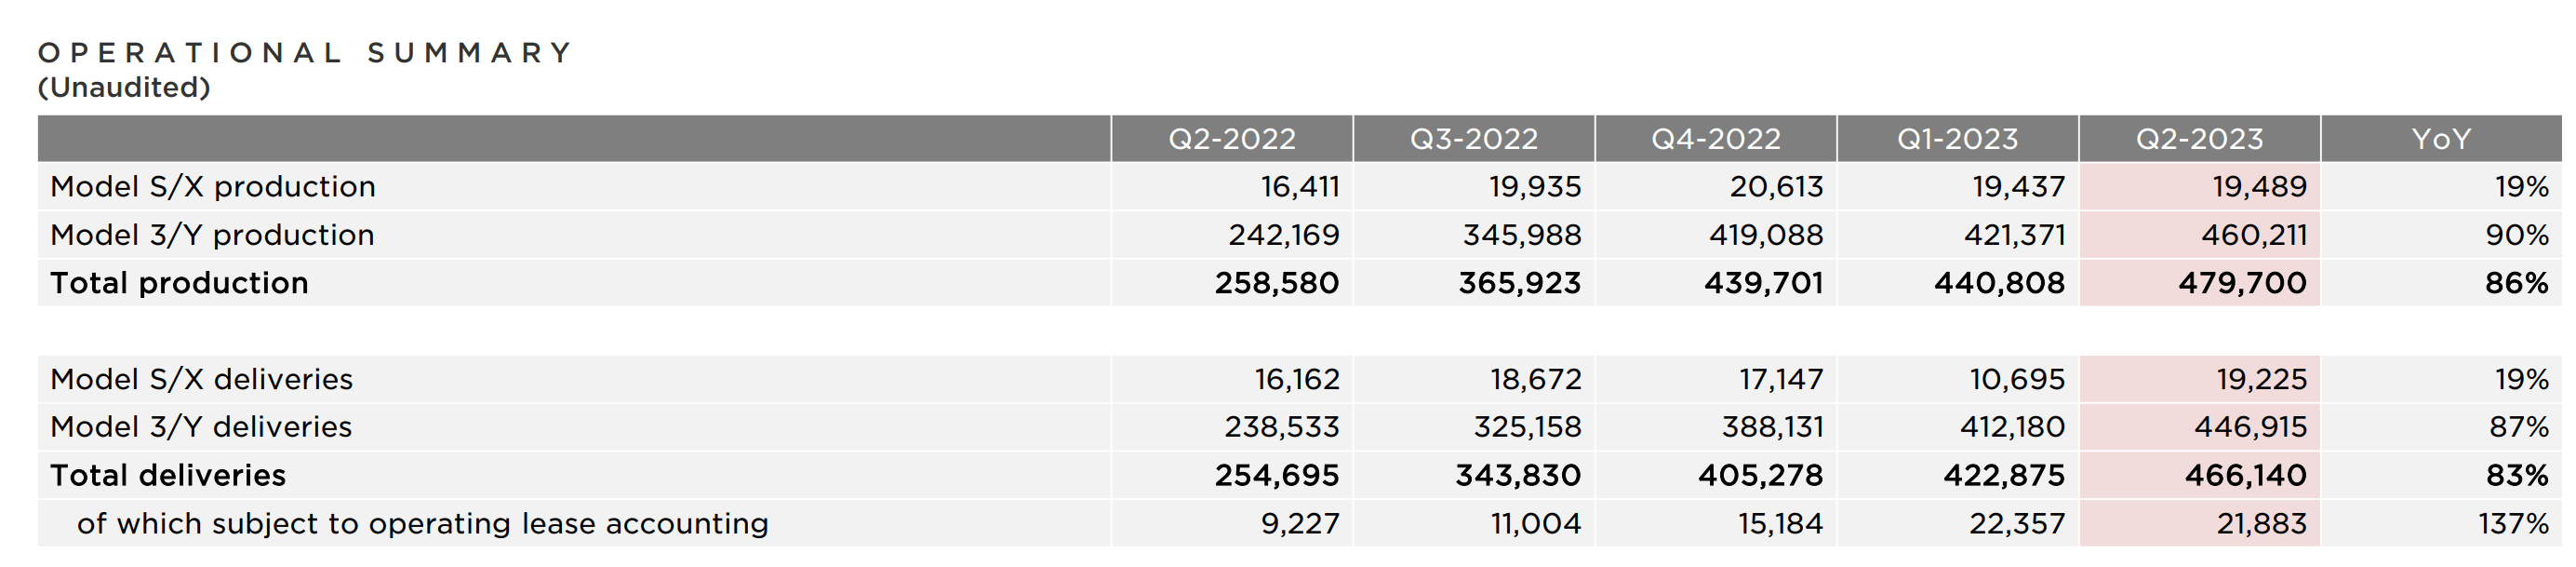
The next chart below broadens the view a bit beyond its Q2 ER to the larger EV space. As seen, TSLA enjoys a dominating role in the EV space because of its production capacity, technology, and brand recognition (see the chart below). Tesla has the largest production capacity of any EV maker, with its Gigafactory in Fremont, California, and Gigafactory in Shanghai, China. Tesla also has a successful combination of advanced EV technology and style. Its cars are known for their long range, fast charging, and sleek design. Thanks to its strong brand recognition, it is the most popular EV brand in the world, and its cars are seen as status symbols. This gives Tesla a significant advantage in terms of sales and marketing. Tesla owners are a loyal customer base and are willing to pay a premium for Tesla cars.
Source: counterpointresearch.com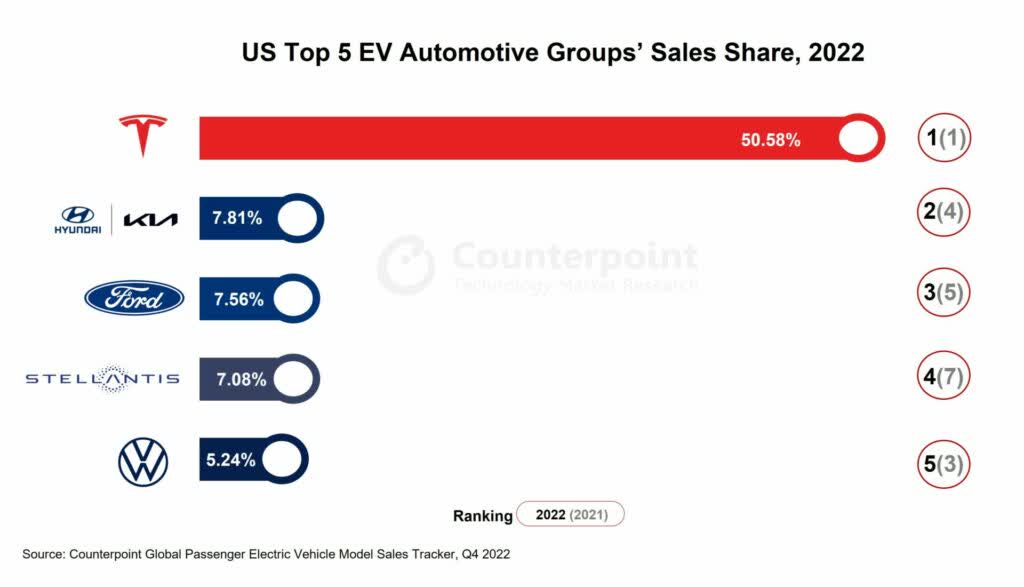
The Lynch PEG ratio
Now, the negatives. To start, TSLA’s current PEG (P/E ratio divided by annual growth rate) is 3.1x on a non-GAAP basis as seen in the chart below, far above the 1x threshold promoted by Lynch.
Source: Seeking Alpha data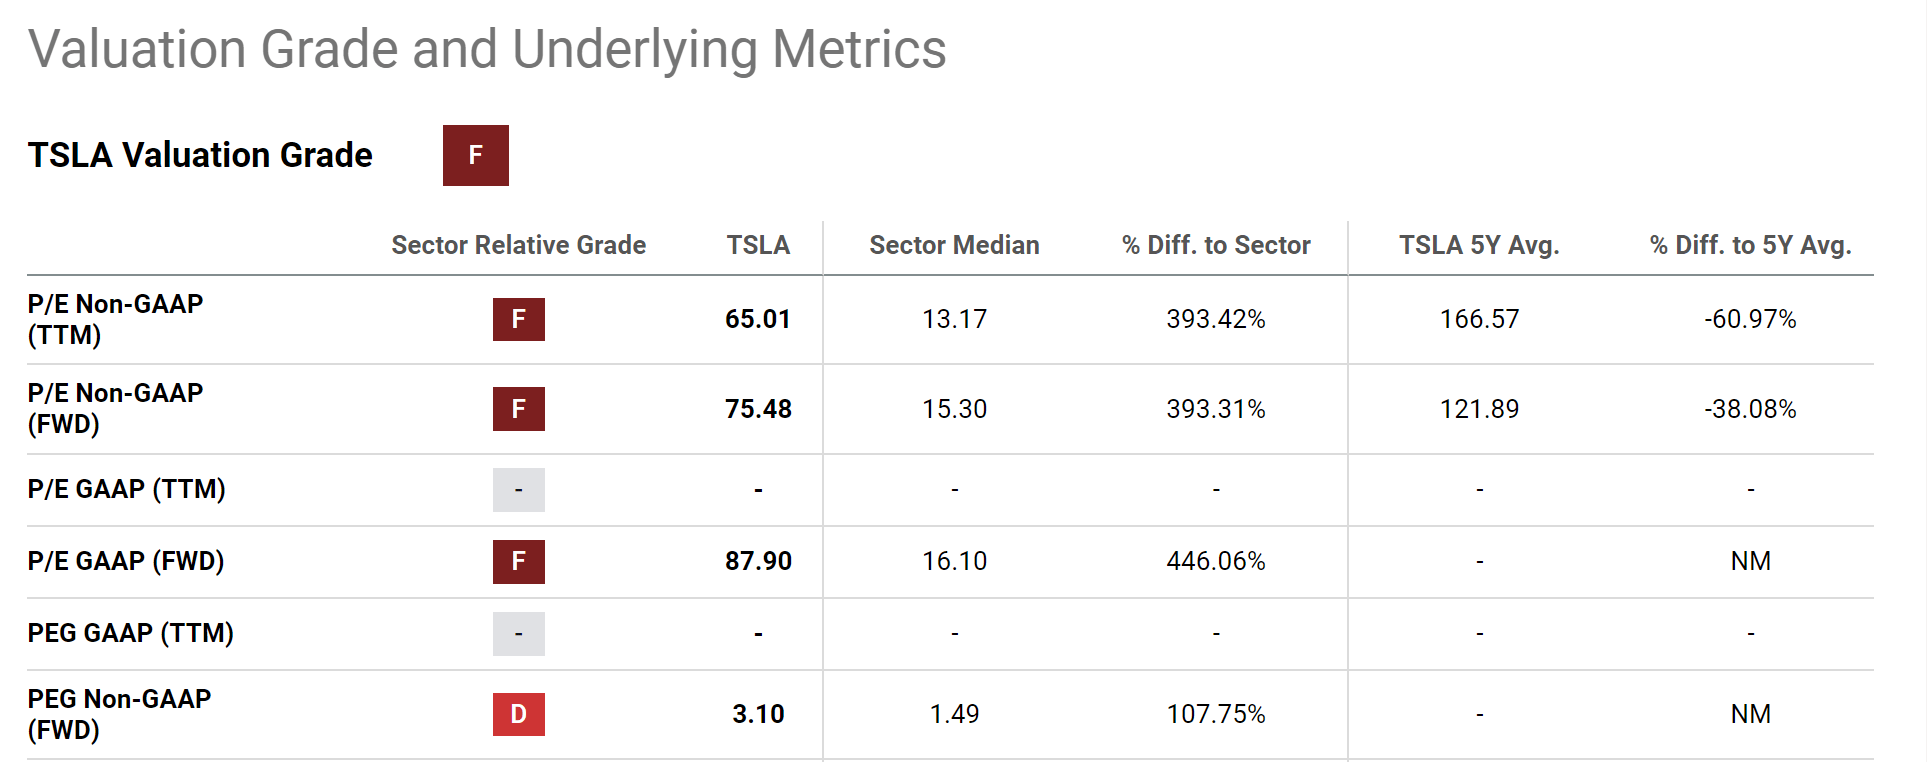
Admittedly, the above number could have overestimated its PEG ratio a bit in several ways reasons. First, TSLA currently has a sizable cash position on its balance sheet – a total of $23.1 billion (see the chart below from its ER). The company generated a total free cash flow of ~$1.0B in Q2 and reported a $0.7B increase in its cash and investments QoQ. On a per-share basis, this is about ~$5 per share or about 2% of its share price. Thus, this cash position will make its PEG ratio a bit lower (by about 2%) than that quoted above.
Source: Tesla 2023 Q2 Earnings Report
The second reason is more significant and also of more fundamental importance. As a growth stock, TSLA’s true economic earnings (i.e., the so-called owners’ earnings, OE) exceed its GAAP earnings substantially. Therefore, the use of GAAP EPS overstated its P/E and also PEG ratios. The key to analyzing OE is to distinguish between growth capital expenditures (“CAPEX”) and maintenance CAPEX. Growth CAPEX shouldn’t be treated as an expense because it is an investment and is optional. This insight is probably most concisely summarized by Warren Buffett in his 2019 letter to shareholders. In that letter, Buffett wrote:
We don’t view our capital expenditures as costs, but rather as investments in our future. We think of these investments as optional, and we only make them if we believe they will generate a return that exceeds our cost of capital.
The chart below shows my analysis of TSLA OE following the Greenwald method (detailed in my earlier article). And the observation here is that TSLA OE exceeds its EPS and free cash flow as just mentioned. In the recent 3 years since 2021, the OE exceeds the EPS by about 21% on average. As such, its PEG ratio would be lowered by a corresponding amount on an OE basis.
All told, its PEG ratio would be about ~2.51x when the above factors are adjusted for, still far higher than the 1x ideal Lynch threshold.
Source: Author Based on Seeking Alpha data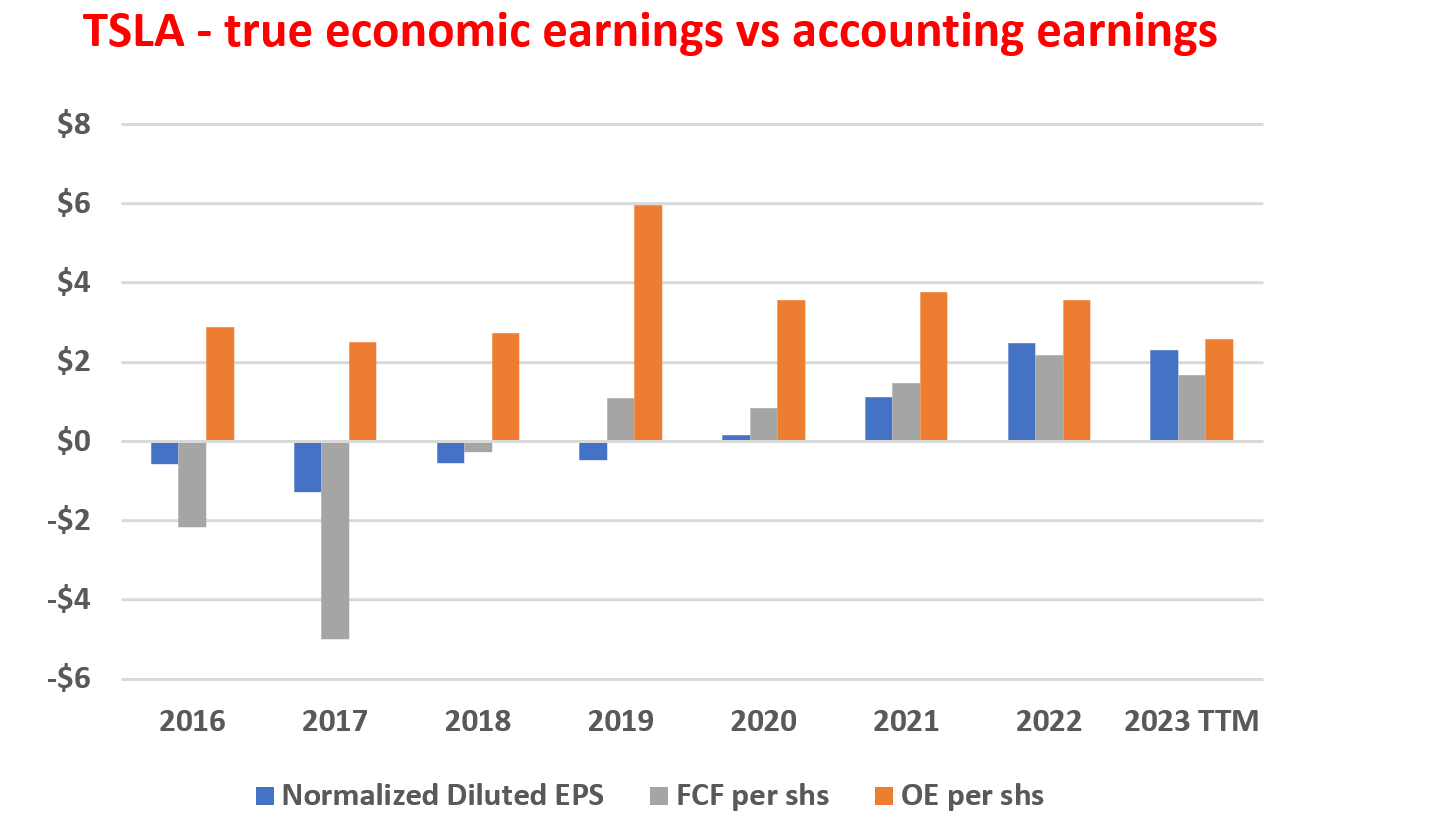
Inventories
Most investors do not pay attention to inventories. And Lynch has the insight that inventory provides a very reliable indicator of the health of a business. It’s simple and less ambitious (compared to other financial data like EPS). But it reveals a wealth of information on the efficient use of resources, customer satisfaction, cash flow management, and also balance sheet management.
With this background, the trajectory of TSLA’s inventories in recent quarters is concerning. As seen in the chart below (again taken from its Q2 ER), the good news as aforementioned is that both its production and deliveries are growing at a fast pace. However, the bad news is that its inventory has been growing at an even faster pace. To wit, Q2 global inventory grew to 16 days, a 300% increase YoY. Its days of inventory outstanding have been increased continuously since Q2 2022 (only 4 days at that time) to the current level.
Source: Tesla 2023 Q2 Earnings Report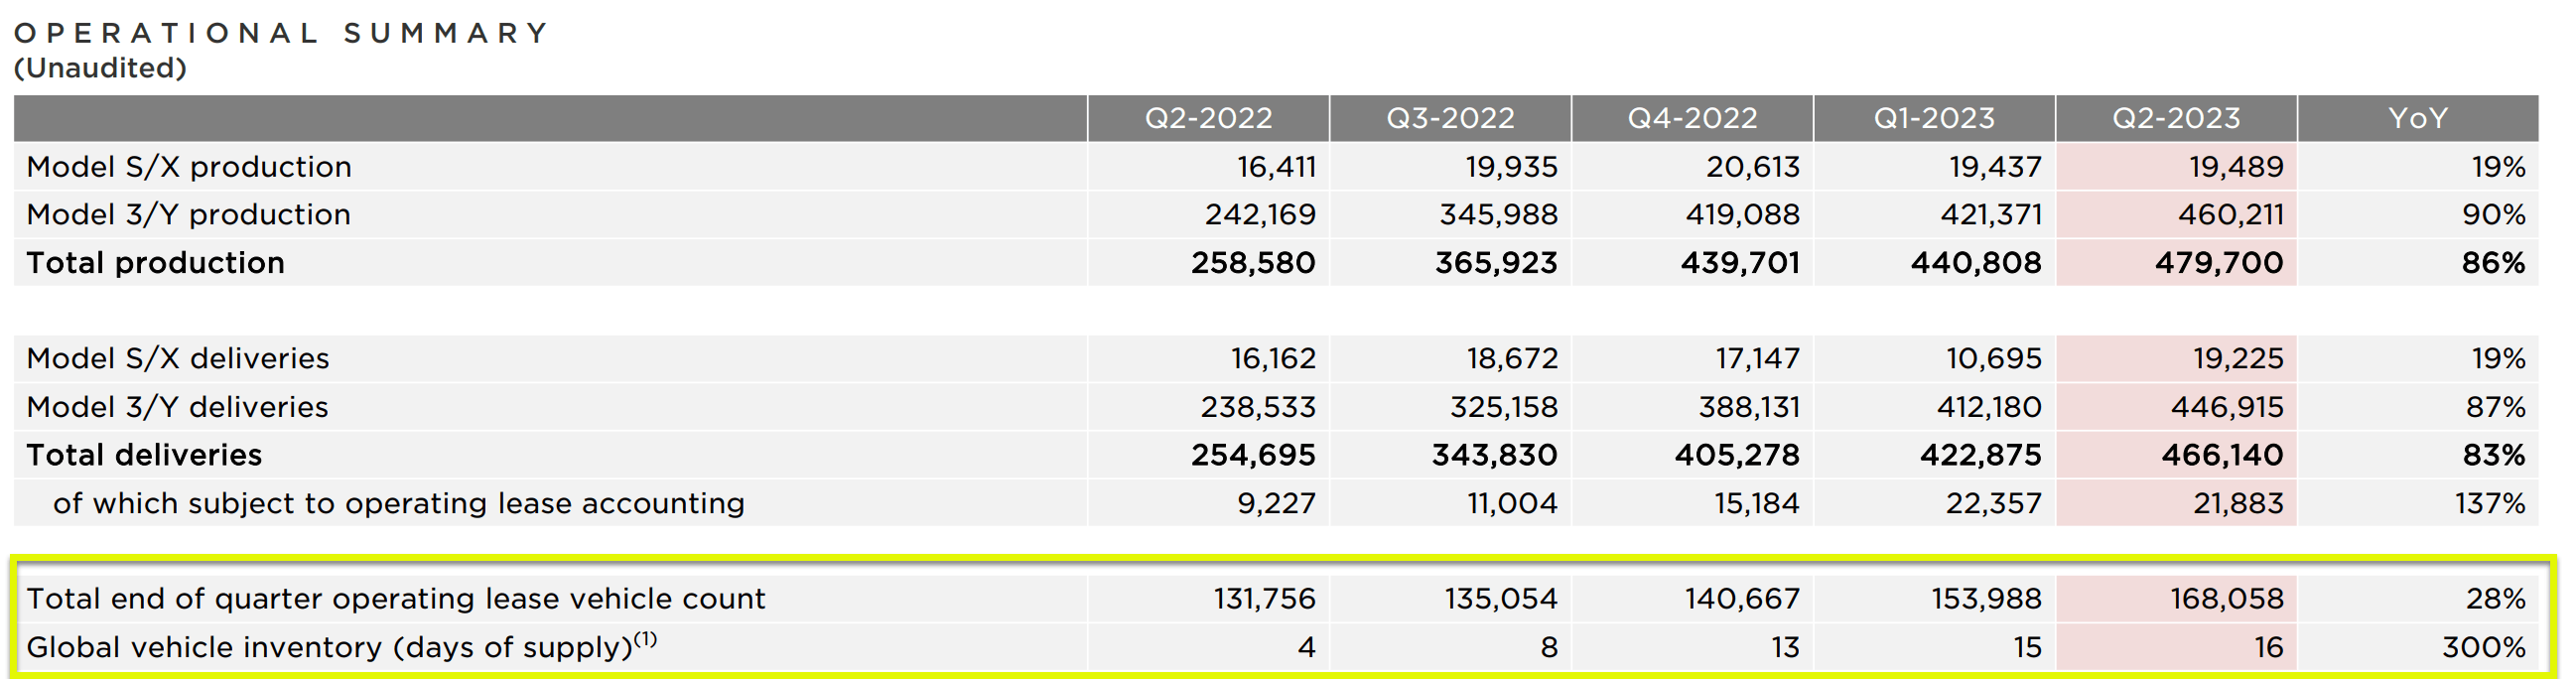
To put the Q3 data in a broader context, the chart next shows its inventory for the past 3 years. In terms of absolute dollar amount, its inventory has been rapidly growing – as it should – for a fast grower. It has grown from about $4B 3 years ago to the current $14B+. But again, the concerning sign for me is that its inventory has been growing faster than its sales. As seen, in terms of days of inventory outstanding (“DOIO”), the number stands at 64.2 with its Q2 results, the highest level in the past 3 years and far above the average of 50.8 days.
Source: Seeking Alpha data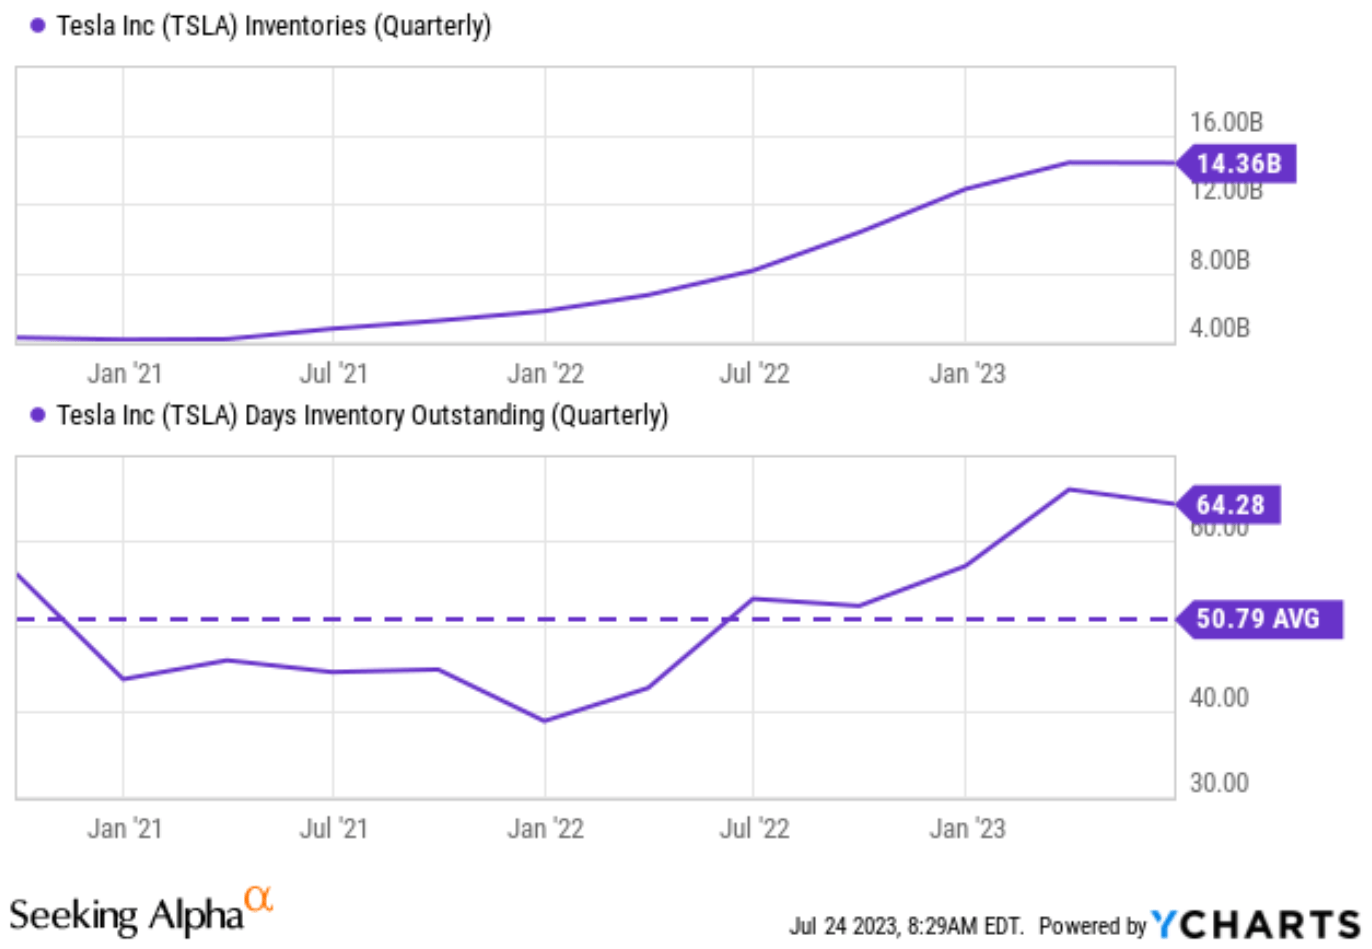
Other risks and final words
There are a few other risks worth noting besides those mentioned above, both upside and downside risks. Since my writing so far is more tilted towards the negatives, here I will point out a few limitations of my above analysis.
First, note there are always uncertainties in financial data, and the use of the Greenwald method could amplify the uncertainties embedded in the financial data because it essentially involves a differentiation operation (or a finite difference operation to be more precise mathematically). When you divide a number by a small number, the uncertainties in these numbers get amplified. As such, when interpreting the OE results, bear in mind that there is some margin of error there (especially for the years before 2019 due to the smaller magnitude of its earnings).
Secondly, the increased inventory (that is, in terms of DOIO) in recent years could be partially due to external factors such as the ongoing Russian/Ukraine war and the global logistic disruptions. If so, these factors are temporary.
To conclude, the goal of this article is to attempt to read TSLA’s Q2 ER from Peter Lynch’s eyes. More specifically, to examine if TSLA is still a good pick for fast growers. And I see a very mixed picture. There is no doubt that Tesla, Inc. is still a scale leader in a burgeoning space. But the PEG ratio is far higher than what Peter Lynch promotes no matter how I interpret the data. At the same time, its inventory shows concerning signs too, either due to intrinsic or extrinsic factors. Based on these considerations, I imagine Peter Lynch probably would have decided to stay on the sideline under current conditions.
Analyst’s Disclosure: I/we have no stock, option or similar derivative position in any of the companies mentioned, and no plans to initiate any such positions within the next 72 hours. I wrote this article myself, and it expresses my own opinions. I am not receiving compensation for it (other than from Seeking Alpha). I have no business relationship with any company whose stock is mentioned in this article.
Seeking Alpha’s Disclosure: Past performance is no guarantee of future results. No recommendation or advice is being given as to whether any investment is suitable for a particular investor. Any views or opinions expressed above may not reflect those of Seeking Alpha as a whole. Seeking Alpha is not a licensed securities dealer, broker or US investment adviser or investment bank. Our analysts are third party authors that include both professional investors and individual investors who may not be licensed or certified by any institute or regulatory body.
As you can tell, our core style is to provide actionable and unambiguous ideas from our independent research. If your share this investment style, check out Envision Early Retirement. It provides at least 1x in-depth articles per week on such ideas.
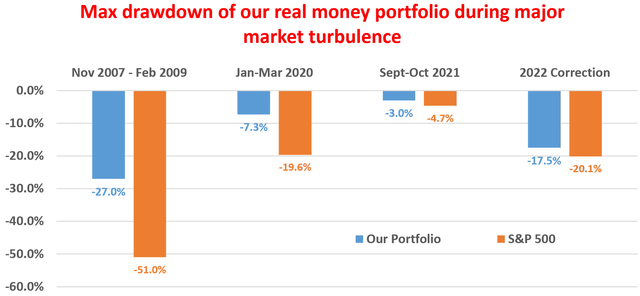
We have helped our members not only to beat S&P 500 but also avoid heavy drawdowns despite the extreme volatilities in BOTH the equity AND bond market.
Join for a 100% Risk-Free trial and see if our proven method can help you too.