Summary:
- Tesla, Inc.’s stock initially plunged post-robotaxi event, but rebounded strongly due to impressive Q3 earnings and improved margins, gaining 26.2% over two sessions.
- Q3 highlights: Adjusted EPS of $0.72 beat estimates by 24.14%, net income rose 17.3%, and gross profit surged 20% annually.
- Despite high forward valuation metrics, Tesla’s recent price movements suggest market confidence, breaking long-term downtrend lines and establishing higher lows since January 2023.
- Near-term resistance at $271 may pose challenges, but Q3 strength justifies momentum, prompting a “buy” rating and continued long position.
3alexd
When I last covered Tesla, Inc. (NASDAQ:TSLA) in my article “Tesla: Near-Term Risks Ahead,” I discussed the strong possibilities that the stock might be vulnerable to downside selling pressures if the market as a whole failed to react enthusiastically to the upcoming (and highly touted) robotaxi event. Unfortunately, these negative expectations turned out to be correct, as technology analysts focused on a “lack of data and details to support the robotaxi vision” and the stock quickly plunged by more than -10% at the open of the following trading session:
TSLA: Post-Event Market Reaction (Income Generator via Trading View)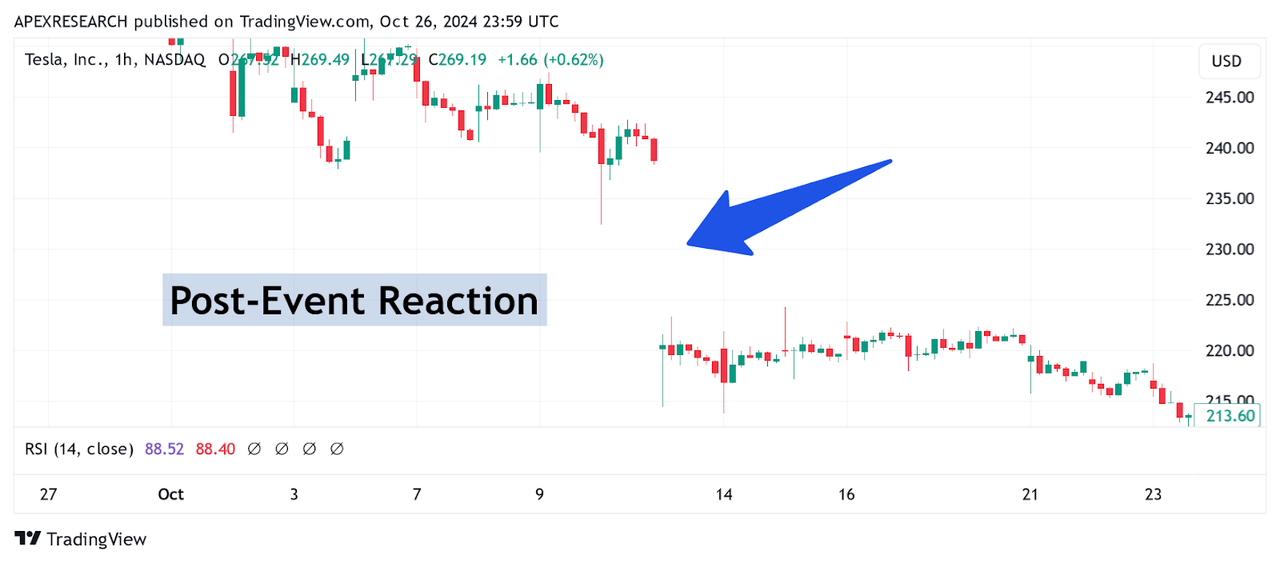
Since then, an even more forceful reversal has occurred — this time, in the bullish direction. Strong earnings results found in Tesla’s Q3 2024 figures indicate impressive earnings performances and highly improved margins. Additionally, CEO Elon Musk explained that the company might be able to achieve vehicle sales growth of 20-30% in 2025. As a result, the market turned on a dime, and the stock was able to recover all of those prior losses (and more). Over the next two trading sessions, TSLA shares rocketed higher and generated gains of as much as 26.2%:
TSLA: Post-Earnings Market Reaction (Income Generator via Trading View)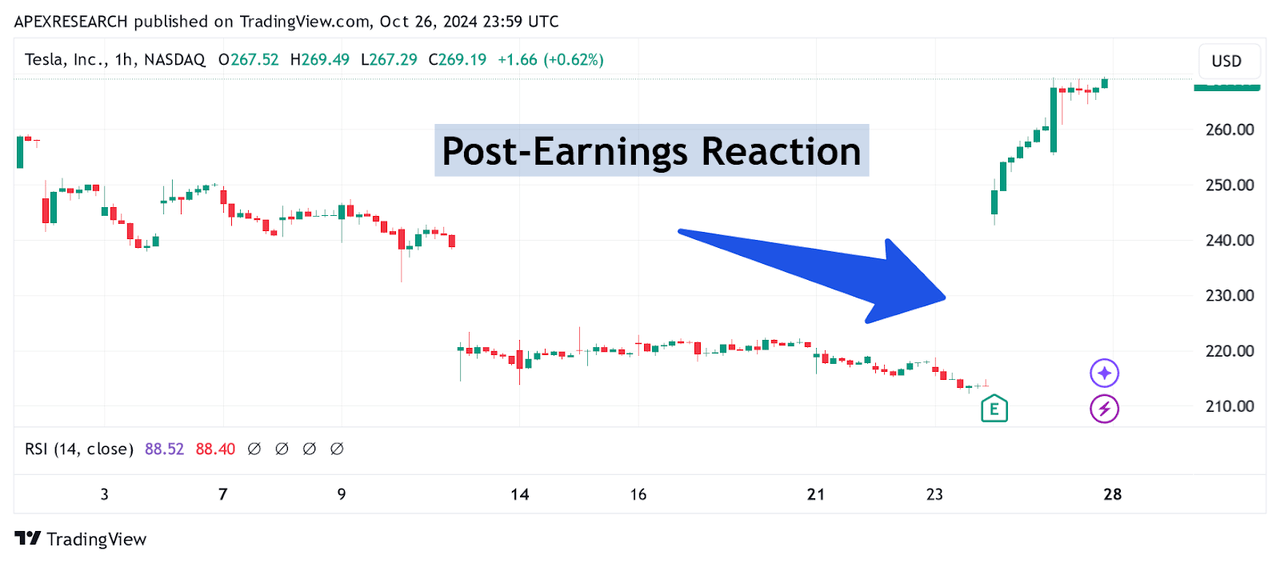
Looking into the third quarter figures, several important points stand out as critical in terms of the company’s forward outlook. Of course, the earnings beat itself was quite substantial. For the period, Tesla recorded adjusted per-share earnings of $0.72 and this surpassed consensus estimates by 24.14%. Net income figures came in at $0.62 per share ($2.17 billion) and this represents a substantial annualized gain of nearly 17.3%. On the negative side, quarterly revenues of $25.18 billion fell a bit short of consensus estimates ($25.37 billion), but it should be noted that these somewhat disappointing results still indicate annualized growth rates of 8% and gains in profitability continue to outshine these figures.
Tesla: Q3 2024 Earnings Figures (Tesla: Q3 2024 Earnings Presentation)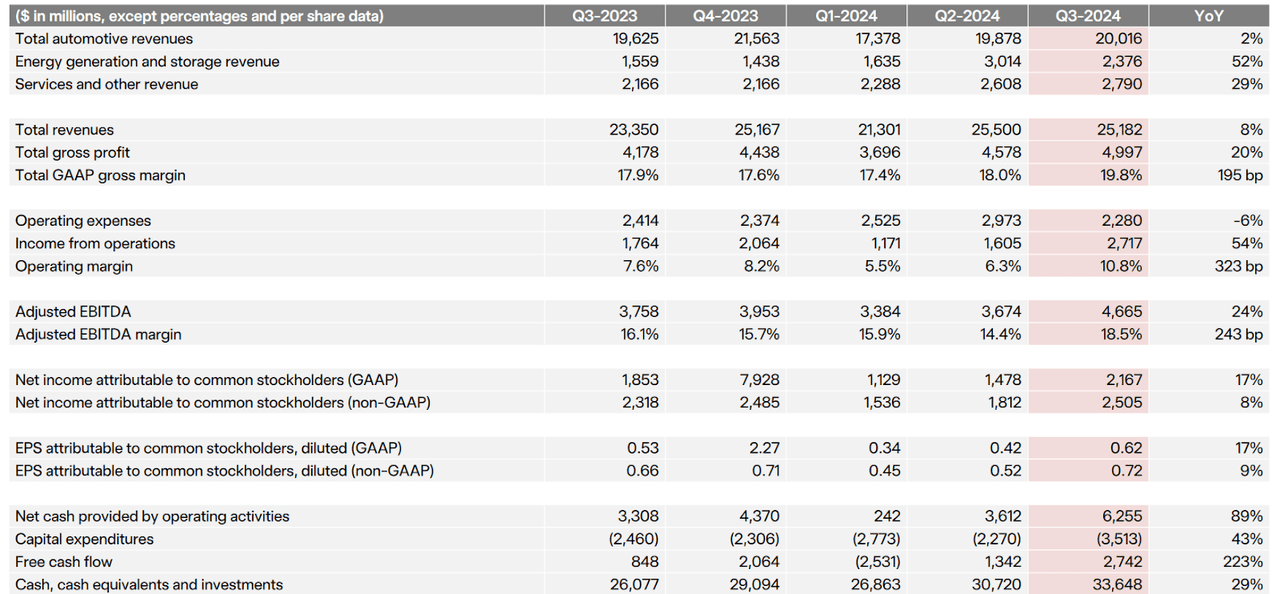
Other bright points can be found in the fact that margins increased for the first time this year, and energy storage/generation produced incredible growth in segment revenue that surpassed 50% (at $2.38 billion). Of course, revenues from automotive sales were much more lackluster (annualized gains of just 2%) at roughly $20 billion, and this shows that growth in this segment has essentially been little changed since the end of 2022. All of these gains helped the company’s gross profit figure rise to almost $5 billion for the quarter, and this indicates impressive growth rates of 20% on an annualized basis.
Tesla: Q3 2024 Earnings Figures (Tesla: Q3 2024 Earnings Presentation)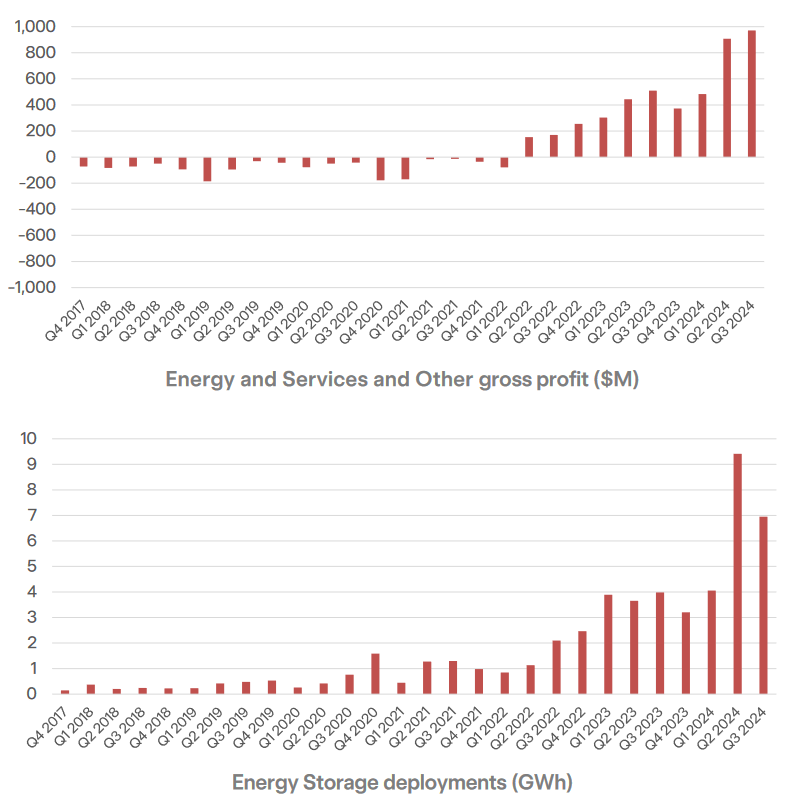
Of course, it must be noted that Tesla’s profit margins benefited from regulatory credits from the automotive segment worth $739 million. In some instances, I have seen investors with short TSLA positions dismiss this revenue as being less significant. However, I find it difficult to concede this point as a substantive bearish argument. It indicates that Tesla is not having difficulties in achieving annual regulatory credit requirements, while other competitors within the automotive industry are falling behind in these areas.
Tesla: Comparative Forward Price to Earnings Valuations (YCharts)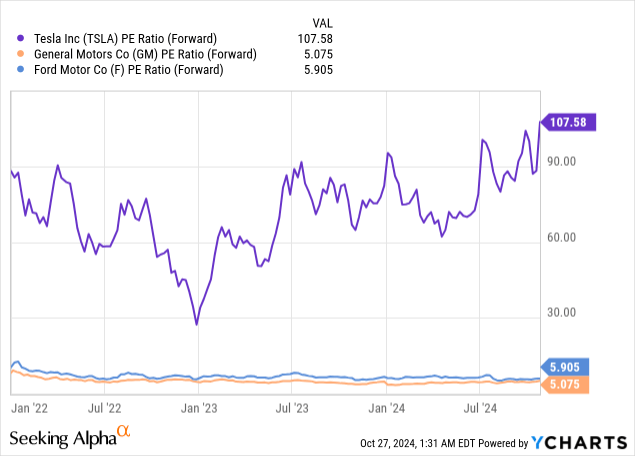
However, one bearish argument that does carry a bit more weight against the positive outlook for Tesla would be the stock’s forward valuation. Specifically, if we consider the fact that Tesla’s current forward price-earnings ratio stands at 107.58x, it should not be surprising that there are other competitors within the automotive industry group that are trading at much cheaper levels. Two obvious examples here would include Ford Motor Company (F) at 5.905x, and General Motors Company (GM) at just 5.075x.
Tesla: Comparative Forward Price to Sales Valuations (YCharts)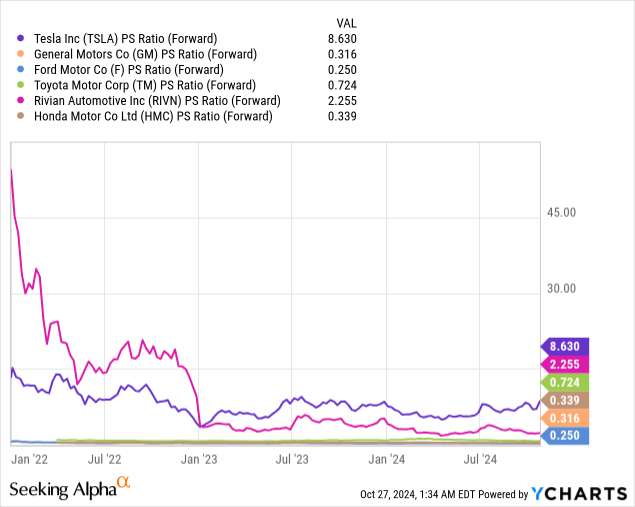
Unfortunately, these types of results are seen even if we expand the industry peer group to include additional stock choices. Looking at the relative forward price-sales ratios found within this larger industry grouping, Tesla is still a clear outlier at 8.63x. Within this grouping, Rivian Automotive (RIVN) shows the next highest forward price-sales valuation at 2.255x. From there, these comparative ratios drop off quite dramatically, with Toyota Motor Corp. (TM) at 0.724x, Honda Motor Company (HMC) at 0.339x, General Motors at 0.316x, and Ford at just 0.25x.
Tesla: Comparative Forward Price to Book Valuations (YCharts)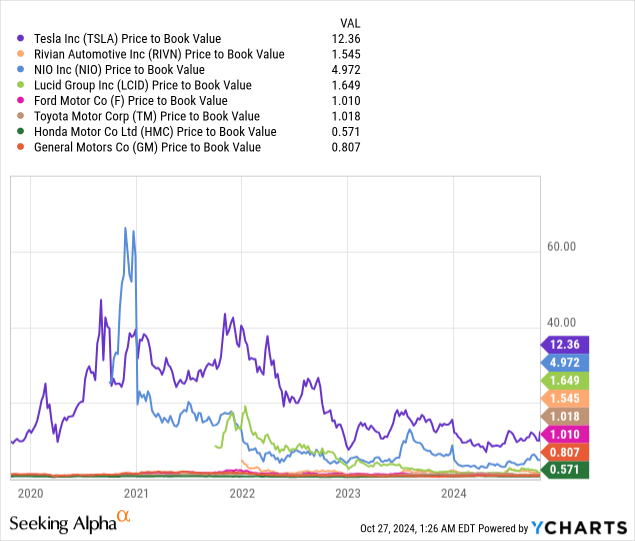
Finally, we will expand this grouping once more and look at the comparative price-book ratios for major competitors within the industry. Here, Tesla’s valuation metric is sky-high, at 12.36x. NIO, Inc. (NIO) would be next within this grouping, but the stock’s ratio is still much lower at 4.972x. From there, the group’s price-book ratios are much lower, as Lucid (LCID) currently trades at 1.649x and Rivian is seen at 1.545x. From there, most of the other stocks in this grouping are trading near (or below) book value, as Toyota is seen at 1.018x, Ford trades at 1.01x, GM trades at 0.807x, and Honda trades at 0.571x. Thus, given the fact that we have compared Tesla’s valuation metrics against several automotive companies (using many valuation ratios), it seems obvious that this is a trend that has the potential to continue for quite a while.
TSLA Daily Chart: Major Long-Term Trendline Breaks (Income Generator via Trading View)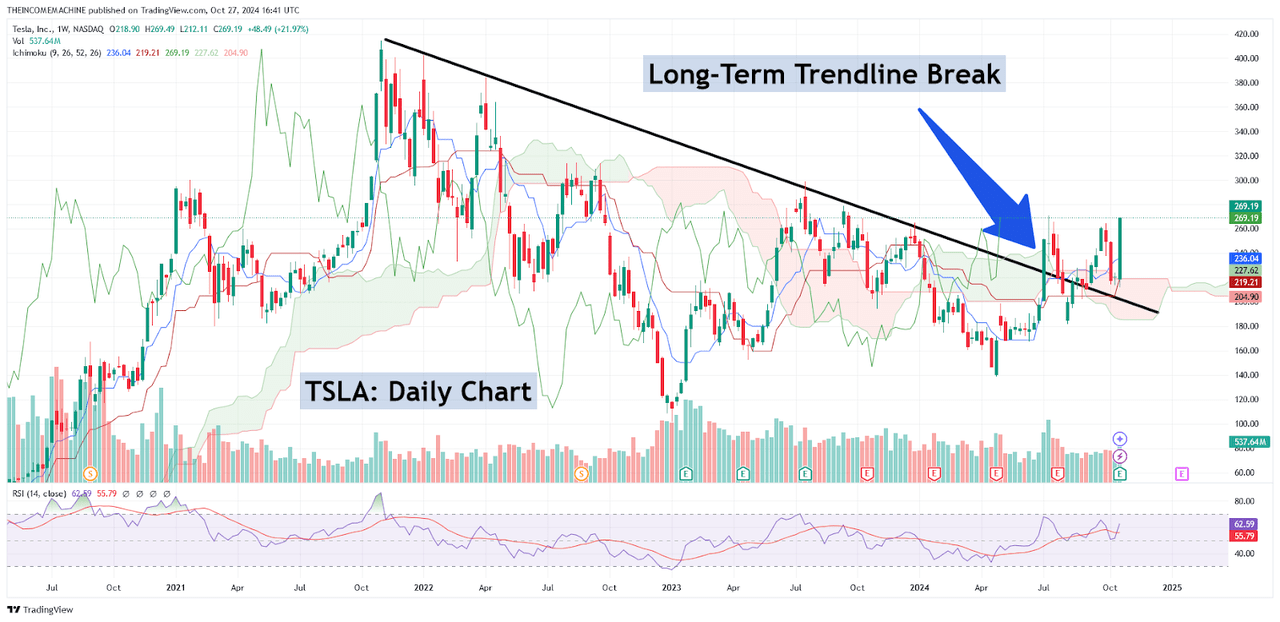
At this stage, the main question would be whether Tesla is enough of an outlier to justify these elevated valuations. However, when we look at the stock’s price history, it appears as though the market believes that it actually does. Recent share price movements have sent the stock through major long-term downtrend lines, and what this tells us is that TSLA’s series of lower highs has finally come to an end. At the same time, the stock has managed to post a series of higher lows that began in early January 2023 (with share price lows of $101.81). Currently, I would need to see the stock fall below prior support levels near $182 (which represents the price lows from the August 5th, 2024 trading session) to reverse this viewpoint and switch to a more consolidate-sideways trading outlook.
TSLA Daily Chart: Potential Resistance Zones Nearby (Income Generator via Trading View)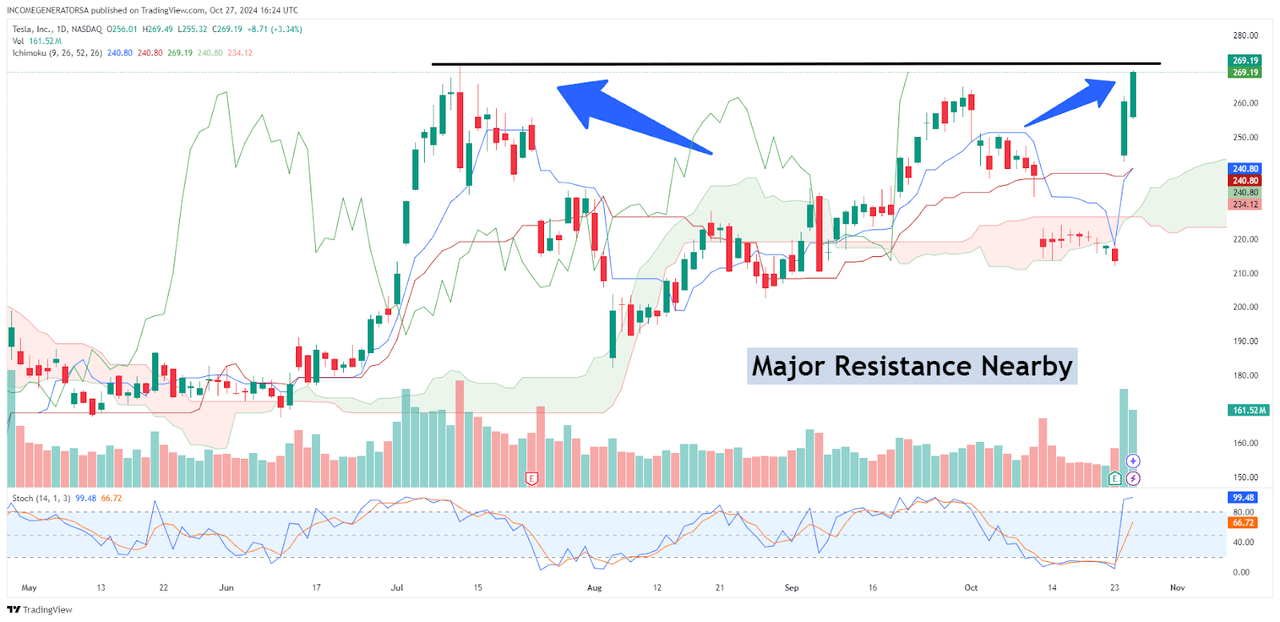
Additionally, it is important for bullish TSLA investors to take note of the fact that near-term resistance is a factor that might also produce headwinds. Specifically, the stock failed to overcome resistance levels found near $271 (July 8th, 2024 highs) when share prices were rallying higher following the Q3 earnings report. When we add this to the fact that stochastic indicator readings on the daily time frames are trading in heavily overbought territory, it really should not be surprising if we see share prices start to stall in this area. However, we did manage to break through the stock’s September 30th, 2024 resistance levels (located at $264.86) and this does reduce the possibility that we will start to see significant selling pressures near-term.
Overall, I think that it is essential for bullish investors to keep these factors in mind. We are dealing with a stock that is currently showing forward valuation metrics that are significantly above the market averages for the industry as a whole. Ultimately, I feel as though there was enough strength in the Q3 earnings report to justify recent momentum in share prices. I believe that the most likely scenario is that the stock moves through these near-term resistance levels before the end of this year. As a result, I will continue to hold my TSLA long position and raise my rating outlook to a “buy” rating following these recent developments.
Analyst’s Disclosure: I/we have a beneficial long position in the shares of TSLA either through stock ownership, options, or other derivatives. I wrote this article myself, and it expresses my own opinions. I am not receiving compensation for it (other than from Seeking Alpha). I have no business relationship with any company whose stock is mentioned in this article.
Seeking Alpha’s Disclosure: Past performance is no guarantee of future results. No recommendation or advice is being given as to whether any investment is suitable for a particular investor. Any views or opinions expressed above may not reflect those of Seeking Alpha as a whole. Seeking Alpha is not a licensed securities dealer, broker or US investment adviser or investment bank. Our analysts are third party authors that include both professional investors and individual investors who may not be licensed or certified by any institute or regulatory body.
