Summary:
- TSLA’s 43% drop in just 2 last months looks like a textbook stock market overreaction against a backdrop of plenty of negative news.
- The valuation of the company, which was previously considered too high, no longer seems so high, even if we focus only on free cash flows and their realistic projections.
- I try to incorporate some really conservative assumptions into a DCF model and come up with a fair value of about $98.5 per share.
- So once the price falls below this level, GARP investors might consider gradually building a position in the stock.
- I leave my rating Neutral in the hope that TSLA will slide into undervaluation relatively soon.

grandriver/E+ via Getty Images
Intro & Thesis
This is my 5th post on Tesla, Inc. (NASDAQ:TSLA) and the 4th neutral one. In my opinion, the stock has experienced a textbook overreaction, as the valuation of the company, previously considered too high, no longer seems so, even if we focus only on free cash flows and their realistic projections. I try to incorporate some conservative assumptions into a DCF model and come up with a fair value of about $98.5 per share – it seems to me that once the price falls below this level, GARP investors might consider gradually building a position in the stock.
Tesla’s Price Action: Causes & Consequences
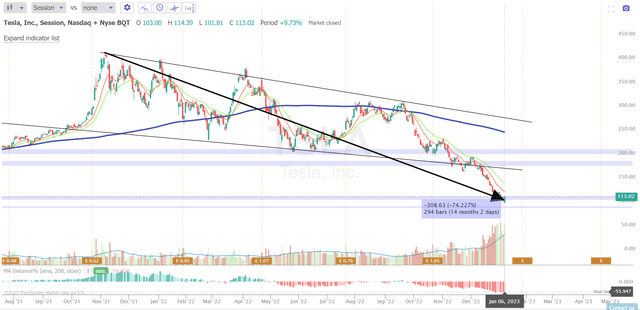
Like the rest of the market at the time, Tesla stock began to experience growth problems in early November 2021 when, after rising nearly 60% just 1 month before, it began a sharp decline that was followed by bouts of recovery but eventually marked the beginning of a long-term downtrend that continues to this day.
The descending channel on the way down formed exciting entry points for TSLA to rally, but selling pressure was so intense that the stock could not resist and continued to update its local lows. As a result, TSLA has fallen >74% from its November 2021 peak and is currently trading about 56% below its 200-day simple moving average:
TrendSpider, TSLA, author’s notes
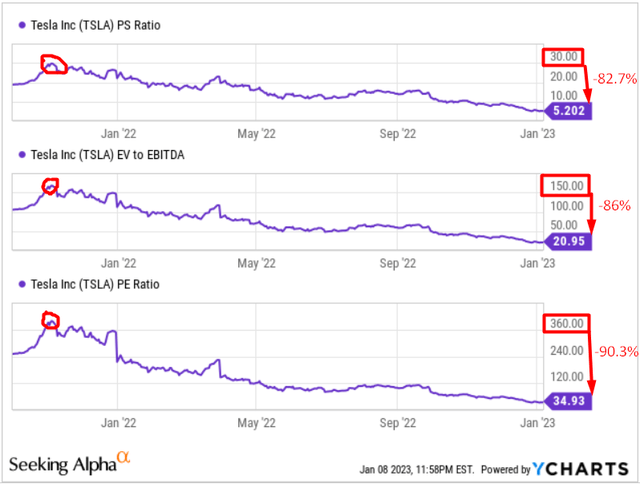
One of the biggest problems for the company at the start of its downward trajectory was valuation – recall that Tesla was trading at 160 times and 360 times TTM-based EV/EBITDA and price-to-earnings ratios, respectively, in November 2021:
YCharts, TSLA, author’s notes
The multiple contraction – at least based on the above 3 TTM-based metrics – was about 86.3%, which is too sharp a decline for a simple adjustment based on an interest rate hike. And if we look at the forward ratios, then the multiple contraction in some places reaches ~94%:
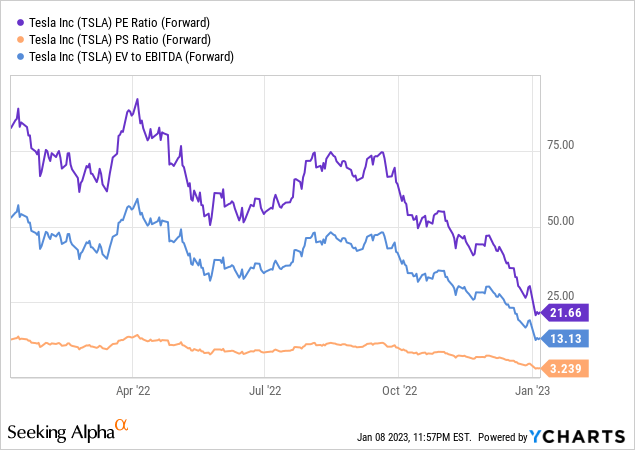
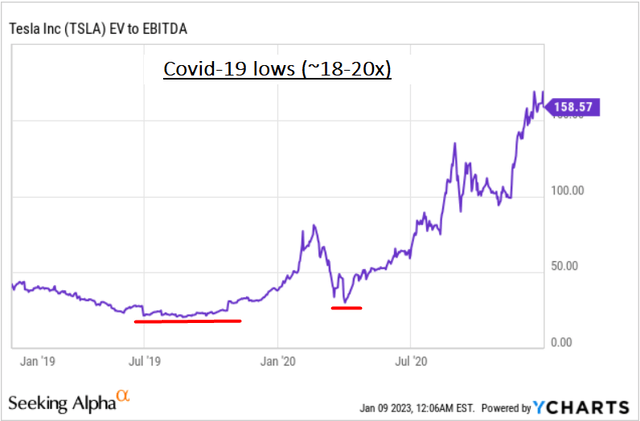
To give you an idea of the extent of today’s multiple contraction – during the COVID-19 era, EV/EBITDA ratio bottomed out at about 18-20x, while the 1-year forward ratio is now ~13x.
YCharts, TSLA, author’s notes
There must be a good reason for such a sharp decline – TSLA has several such reasons at once, and all of them are recent. However, the decline has also accelerated relatively recently – the stock lost >36% over the past month.
The first and perhaps most important reason for the fall is Elon Musk’s refusal to step down as CEO of Twitter until he finds a worthy successor for the role. Tesla investors were [and presumably still are] concerned that the search will drag on and Musk will lose control of his main asset.

Seeking Alpha News, author’s notes
The second news item is huge selling volumes from Musk, who mercilessly sold his shares in large portions in early November and December:
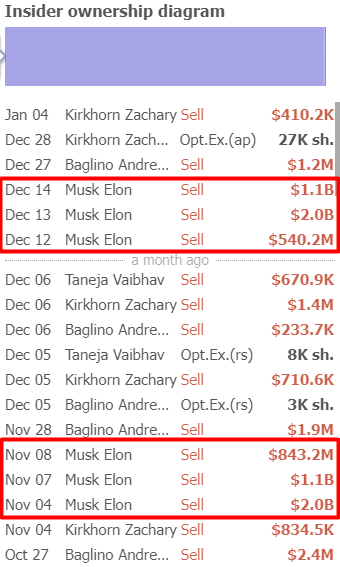
TrendSpider, TSLA’s Insiders, author’s notes
The third piece of news is the introduction of a new hiring freeze and further layoffs through 2023 (presumably Q1), as Electrek writes, citing “a reliable source familiar with the matter.”
The fourth piece of news is the halt of production in Shanghai, which in 2021 accounted for 51.7% of Tesla’s global production capacity. While the company did not specify a reason for the production halt, Reuters previously reported that the suspension of Model Y assembly at the Shanghai plant at the end of the month would be part of a 30% reduction in planned production for the model in December. Additionally, sources have noted that employees at Tesla’s Gigafactory in Shanghai and supplier plants have been falling ill due to a recent outbreak of COVID cases in the area.

Seeking Alpha News, author’s notes
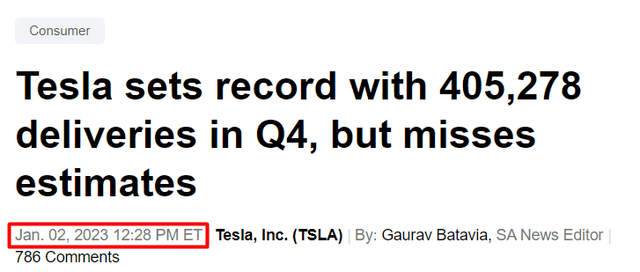
The fifth piece of news is the record deliveries in Q4 2022 that the company announced a few days ago, which unfortunately for TSLA investors did not meet consensus estimates.
Seeking Alpha News, author’s notes
The sixth piece of news was an addition to the 4th one – the company was forced to cut prices of its Model Y and Model 3 in China for the second time in less than three months.

Seeking Alpha News, author’s notes
So all this news has created a kind of perfect storm that has led to an unprecedented multiple contraction discussed above.
Analysts at some investment banks have added fuel to the fire by massively lowering their price targets after the share price plunge – you know, previous recommendations of $200-250 per share would have assumed 77-87% growth in the stock over the next 12 months, which seems too generous and not permissible for the sell side.
One of the most significant downgrades, in my opinion, was made by analysts Ryan Brinkman, Rajat Gupta, CFA, Manasvi Garg, et al. of J.P. Morgan. Their valuation calculations and general reasoning seemed the most realistic to me [compared say to BofA and Goldman Sachs] back in October 2022. This time I think the bank’s updated report deserves our attention, just like last time.
JPMorgan’s New $125 Target Price – Assumptions And Reality Check
It is worth noting that, unlike the Street consensus, JPMorgan analysts expected Tesla to deliver significantly less in Q4 2022, so the company actually slightly outperformed the bank’s internal forecasts by +4%. Citing multiple price cuts in China during the quarter and the $7,500 discount in the U.S. at the end of Q4, JPMorgan lowered its price target from $150 per share [October 2022] to $125 per share as of Jan. 3, 2023:
4Q deliveries exceeded the 388,500 we had modeled by +4%. However, this modest beat to our deliveries estimate and modest miss to consensus appears to have come at the cost of atypically high discounting (for example, a $7,500 discount in the US late in 4Q more reminiscent of traditional automakers trading at substantially lower earnings multiples, and multiple price cuts in China throughout the quarter). We are lowering our 4Q EPS estimate from $1.19 prior — flowing only the +4% volume beat through our model would have implied EPS of $1.28, although, with the ratcheting down of pricing and margin expectations, we now forecast $1.16.
Source: JPMorgan on TSLA, January 3, 2023
It’s interesting to look at the assumptions the bank used in valuing Tesla. They assume that annual sales growth (while remaining impressive overall) is likely to decline every year from now on (they forecast +26% growth in FY2023, +24% in FY2024, and +20% in FY2025), even in the face of growing competition. Tesla’s last model refresh (the updated S & X) dates to spring 2021, and many competing models have entered the market since then. Investors’ forecasts for +50% annual growth have been helped by the fact that demand has so far outstripped supply. However, with significant capacity coming online in 2023 as a whole compared to 2022 (annual installed run-rate capacity according to 3Q22 shareholder letter of > 1.9M as Austin and Berlin ramp compared to deliveries of 1.3M. in 2022), supply in FY2023 is unlikely to be the limiting factor on Tesla’s deliveries that it has been in prior years, so a significant miss on deliveries relative to expectations could be particularly damaging to investors’ long-term expectations. As a result, analysts have significantly lowered their EPS estimates: FY2023 to $4.60 from $4.84, FY2024 to $5.15 from $5.35, and FY2025 to $5.55 from $5.65.
The new price target of $125 per share is predicated upon a 50/50 blend of DCF and 2025E-based multiples analysis (itself a blend of P/E, EV/EBITDA, and price-to-sales). To help you better understand the entire reasoning behind JPM’s model, I have summarized the various parts of the model in one image:
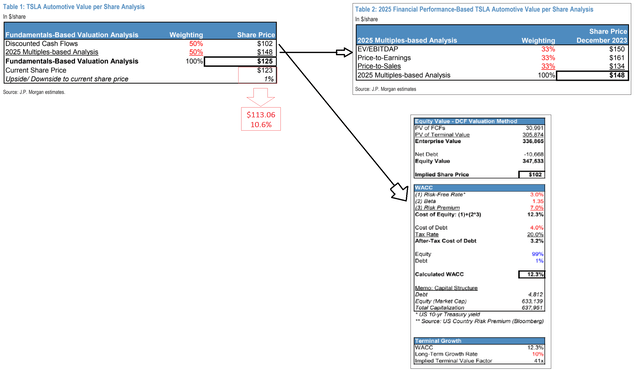
JPMorgan’s valuation model for Tesla, author’s compilation with notes
The multiple-based analysis consists largely of comparing Tesla by 5 categories:
- Disruptive Technology: Apple (AAPL), Google (GOOGL);
- Clean Technology: First Solar (FSLR), SunPower (SPWR);
- Auto Tech / Innovation: BorgWarner (BWA), Gentex (GNTX);
- Luxury Automakers: BMW (OTCPK:BMWYY), Mercedes (OTCPK:MBGAF);
- High-Growth Automakers: BYD (OTCPK:BYDDF), Great Wall (OTCPK:GWLLF), and SAIC Motor.
As you can see, JPM did not include classic American manufacturers such as Ford (F) or General Motors (GM) in this list, which is unacceptable in my opinion – after all, the end market for them is almost the same. It seems to me that if the 6th category were included in the above list, the implied value for the entire segment would be somewhat less than the $148 per share we see now. So the DCF-based projections are a much more reliable metric, in my opinion.
I propose to independently build a DCF model to value TSLA stock – how realistic is the current price in terms of its “intrinsic value”?
DCF Based On My Reality
I write “My Reality” because some of the assumptions I will take as a basis will most likely not coincide with yours – this is perfectly normal, I suggest discussing our contradictions in the comments section.
JPM has projected a gradual decline in revenue growth from +26% to +20% in the last projected year (FY25) – I want to be even more conservative here and assume that revenue will grow at a rate of 20% from FY23 to FY25, and by only 15% in FY26. Also, I expect the EBITDA margin to drop to 8% in FY23 (TTM EBITDA margin now = 21.65%) and EBIT margin to be negative -50 bps due to increased expenses (TTM EBIT margin now = 16.83%). So, I try to take into account the whole cascade of negative news I described at the very beginning of this article in the model. I also want to take into account the rather high risk of a recession somewhere in the middle of 2023, which I have mentioned repeatedly in my articles.
D&A as a percentage of total revenue is expected to remain constant at 7.5% throughout the forecast period, although this percentage has declined rapidly in recent years – I expect D&A non-cash costs to return to 2018-2019 levels as the asset base increases.
The working capital ratios – receivables to sales, inventories to sales, payables to sales – look fairly consistent and can be easily extrapolated for several years into the future without major changes [focus on averages]. The ratio of CAPEX to sales is one of the most important inputs, as this assumption strongly influences FCF generation. In the past, this ratio was quite variable. However, as Tesla scaled its operations, the ratio of this metric systematically decreased:
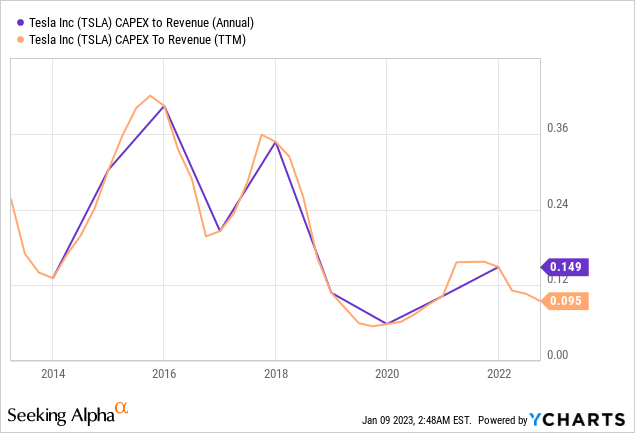
In the event of a recession in 2023, I expect CAPEX-to-revenue to fall even further – to 7%. In 2024, it will grow again (8%) and gradually reach 9% in FY26 as production continues to expand.
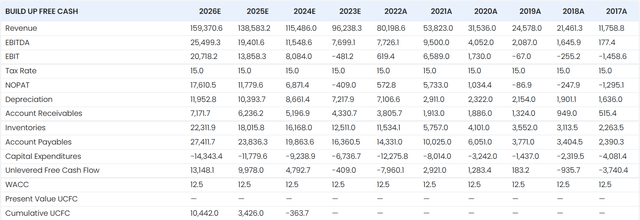
stratosphere.io, author’s inputs
The WACC of TSLA calculated by JPM at 12.3% is significantly more plausible than the WACC of Morgan Stanley at 9%. I calculate my WACC based on the CAPM model:
- beta = 1.9;
- cost of debt = 8%;
- tax rate = 15%;
- risk-free rate = 3.6%;
- cost of equity = 4.7%
So my WACC is only 0.3% higher than JPM’s – 12.6%. In my opinion, this is a very reasonable discount rate for the risk investors take in buying Tesla shares.
The only point where my model differs fundamentally from the JPM model is the long-term growth rate, in place of which I will use the EV/EBITDA exit multiple. Why?
Because if I take the same 10% long-term growth rate and lower it slightly, say to 9.5%, then my bottom line – TSLA’s intrinsic share price – will drop almost 19%. In my opinion, this kind of sensitivity is unacceptable – it’s much more reasonable to imagine what exit multiple Tesla might be trading at in a few years. In terms of EV/EBITDA, it’s 13x today. Let us assume that despite the obvious market overreaction, TSLA’s EV/EBITDA ratio does not rise [but does not fall much either] – 12x seems like a reasonable assumption to me.
So what is the result of all the above?
| discount periods | 1 | 2 | 3 | 4 |
| FCFF |
-$409 |
$4,793 |
$9,978 |
$13,148 |
| EBITDA |
$7,699 |
$11,549 |
$19,402 |
$25,499 |
| WACC | 12.5% | |||
| PV of FCFF | -$364 | $3,787 | $7,008 | $8,208 |
| Sum of PV (FCFF) | $18 639.43 | |||
| EV/EBITDA exit multiple | 12x | |||
| Terminal Value, based on EV/EBITDA multiple = | $305,992 | |||
| Total Enterprise value = | $324,631 | |||
| share of FCFF [% of total EV] = | 5.74% | |||
| share of Terminal value [% of total EV] = | 94.26% | |||
| Net debt = | -$15,233 | |||
| Equity Value = | $339,864 | |||
| per share = | $98.53 | |||
Source: Author’s calculations
My model turned out to be very independent of how the WACC changes – that’s not quite correct, but it’s better than having it change 180 degrees after every little fluctuation in inputs.

Sensitivity table for author’s DCF
The Verdict For Tesla Stock
No one knows exactly when the downward slide of Tesla stock will end. However, one thing seems clear to me – TSLA’s 43% drop in just 2 last months looks like a textbook stock market overreaction against a backdrop of plenty of negative news and a lack of positive news for the company.
At the end of December, I assumed that TSLA would experience a strong rebound (then from a level of ~$120 per share) after Elon Musk announced that he would not sell his shares for another 1-2 years. And this one positive news would most likely be enough if no new negative news came. However, now the stock is quickly approaching its fair value, which can be achieved even based on very conservative assumptions.
I calculated that Tesla’s fair value is about 13% below current levels. So investors looking for growth at a good price should start taking TSLA positions as soon as the next sell-off develops.
Since my fair price is lower than the current one and the market is moving very fast, I leave my rating Neutral in the hope that TSLA will slide into undervaluation relatively soon.
Thank you for reading!
Disclosure: I/we have no stock, option or similar derivative position in any of the companies mentioned, and no plans to initiate any such positions within the next 72 hours. I wrote this article myself, and it expresses my own opinions. I am not receiving compensation for it (other than from Seeking Alpha). I have no business relationship with any company whose stock is mentioned in this article.
Struggle to navigate the stock market environment?
Beyond the Wall Investing is about active portfolio positioning and finding investment ideas that are hidden from a broad market of investors. We don’t bury our heads in the sand when the market is down – we try to anticipate this in advance and protect ourselves from unnecessary risks accordingly.
Keep your finger on the pulse and have access to the latest and highest-quality analysis of what Wall Street is buying/selling with just one subscription to Beyond the Wall Investing! Now there is a free trial and a special discount of 10% – hurry up!
