Summary:
- Tesla, Inc. stock’s huge move this week signals intent to finally take out my target of $334 and move possibly towards the $400 region.
- Strong Tesla Q2 delivery numbers and positive sentiment in the EV market have sent this stock considerably higher this week, with more data to come in the last week of July as excitement starts to build for the robotaxi event in August.
- I am issuing an additional buy signal with a new target of $400 for Tesla.
Firstsignal/E+ via Getty Images
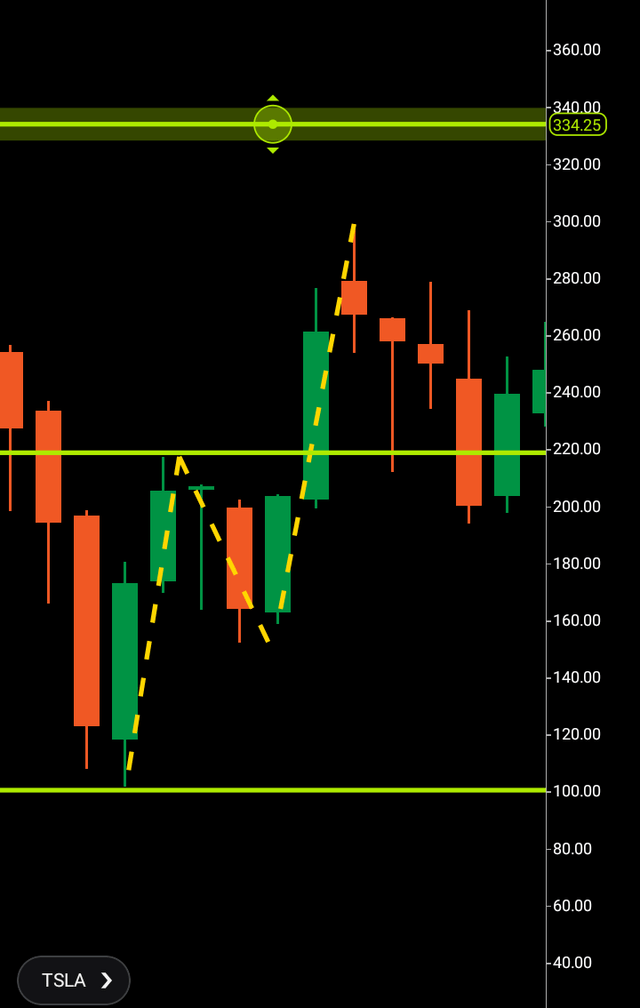
“To be or not to be” is the famous line, and is very applicable to my $217-$334 call for Tesla in 2023. Firstly, it was “to be” as Tesla, Inc. (NASDAQ:TSLA) charged from the breakout area towards $300, and then it was “not to be” as the share price of the electric vehicle (“EV”) giant slowly retraced backwards to $140 but staying within the confines of the initial three wave patterns of $101-$217. Anyway, more on that later.
On Monday, Tesla was the only equity in my buy call portfolio that can be found exclusively with Seeking Alpha that was negative. Those that follow my weekly video update (On the docket) on LinkedIn, will know that in this week’s edition, I called that Tesla’s break above the $200 region would see this stock looking for $260 next, what I didn’t realize was the ferocity in which it would go looking for that region.
One of the things I noted was that the structure of the three wave pattern on the monthly chart “could” be interpreted as extremely bullish, subsequently as the week has rolled on this has been the case.
In this article, we will cover the catalyst that has seen this sudden wave of buying while looking at the charts for a deep dive into what is quite a complex structure, as Tesla returns to positive by bypassing $217 again on my 2023 buy call. We will try to identify where this equity may be headed next.
Tesla stormed the market this week with a Q2 surprise of 411k EV’s produced and 444k delivered. This figure is a dip in year-on-year deliveries. However, concerns in this sector of late have been alleviated with the world’s largest EV manufacturer producing solid numbers. With the robotaxi event scheduled for August the 8th coming, Wall Street sees somewhat of a rejuvenation of Tesla, and it’s showing in their share price.
Next up are the Q2 financial results on July 23rd and the market will be watching with a keen eye, anticipating further solid numbers.
Rival manufacturers NIO Inc. (NIO) and Geely (OTCPK:GELYF) also reported strong deliveries for last month, which is cementing the sentiment that this market is still on an upward trajectory.
Morgan Stanley’s Adam Jonas has an overweight rating for Tesla with a $310 price target, while Dan Ives of Wedbush Securities has raised his target to $300, with $400 a possibility for 2025.
Now, let’s examine the charts to gauge technically where this equity may be looking to go. Briefly, before we move onto the 2023 call, those who have followed me since I started publishing my analysis with Seeking Alpha in 2022, will know that one of my first articles was for Tesla to break from $708 to $176, with an additional target of $121. Subsequently, Tesla bottomed at $101 and found a wave of buying to $217 where it found rejection and thus created a path to $334 by breaking above that rejection, a wave this equity is still in.
This pattern can be seen on the monthly chart below, reaching $300 before retracing essentially sideways for a number of months before breaking down to $140.
Tesla monthly chart (C trader)
Let’s now move over to the current side of the pattern and given the complexity of the original wave, Tesla remains in to $334, now there are additional targets possibly in the $400 area, so this is where things get a little technical.
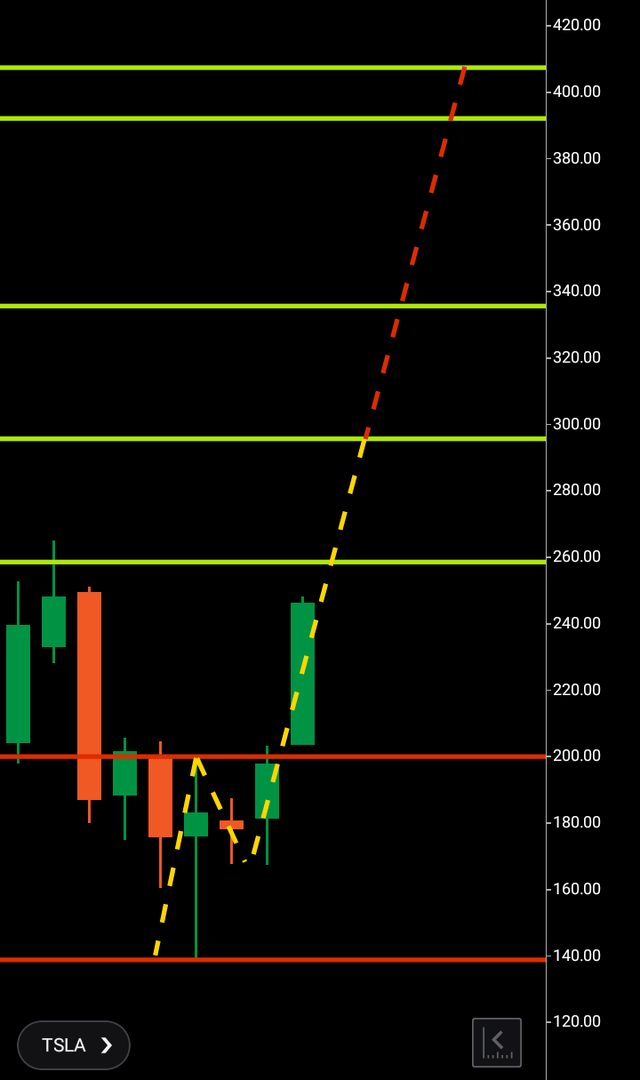
The new three wave pattern in short qualifies as wave one $140-$200, wave two $200-$165 with the third wave breakout looking for completion at $260 in this immediate move.
Tesla monthly chart (C trader)
If Tesla is to keep climbing it will have to find rejection again at some stage on the monthly chart, this is how financial markets climb over time, they find bullish buying vs. bearish selling that if the said market can break above both, then moves onto repeat that process in its new price zone.
The rejection in this case could come at $260, but it is interesting to note that there is confluence at what is the original Fibonacci 161 level from the 2023 breakout of $294 with the current additional Fibonacci level from upward from $260 in this move being at $287. So there will lie the next stop after $260 if that is to be achieved.
Then we can see the $334 region next which is completion from the original 2023 move with additional confluence circa the $400 region which then in turn is the Fibonacci 261 also from the 2023 move and the Fibonacci 423 from this current breakout.
Bearish Scenario
Tesla still has a lot of work to do to get to the $400 region, but with the pace, it is currently racing upwards as there are obviously no bearish patterns. In theory, it isn’t far away from that region, given how quickly this equity can move. Figures on the 23rd of this month that the market doesn’t like can put a halt to this buy up. As the year progresses, additional data that is a miss can also pause this move.
To finalize:
I am issuing an additional buy signal with a new target of $400 for Tesla. Combined with Elon Musk being allocated his $56 billion pay deal which has appeared to be a positive move, strong figures in this sector in general, and the upcoming robotaxi progress as an addition to the company, I believe Tesla can reach $400 within the next twelve months.
Editor’s Note: This article discusses one or more securities that do not trade on a major U.S. exchange. Please be aware of the risks associated with these stocks.
Analyst’s Disclosure: I/we have no stock, option or similar derivative position in any of the companies mentioned, and no plans to initiate any such positions within the next 72 hours. I wrote this article myself, and it expresses my own opinions. I am not receiving compensation for it (other than from Seeking Alpha). I have no business relationship with any company whose stock is mentioned in this article.
Seeking Alpha’s Disclosure: Past performance is no guarantee of future results. No recommendation or advice is being given as to whether any investment is suitable for a particular investor. Any views or opinions expressed above may not reflect those of Seeking Alpha as a whole. Seeking Alpha is not a licensed securities dealer, broker or US investment adviser or investment bank. Our analysts are third party authors that include both professional investors and individual investors who may not be licensed or certified by any institute or regulatory body.
