Summary:
- Given limited room for effective profit margins, UAW’s walkout action and demands will likely lead to Big Three carmakers jacking up prices.
- A steadily more viable option would be to move large portions of manufacturing volumes overseas, with Mexico likely to be a substantial beneficiary.
- With car registrations at a 63-year low and a long-trenchant affordability affecting consumers and American families, it’s a veritable guarantee that additional management-worker conflicts will recur.
Bill Pugliano/Getty Images News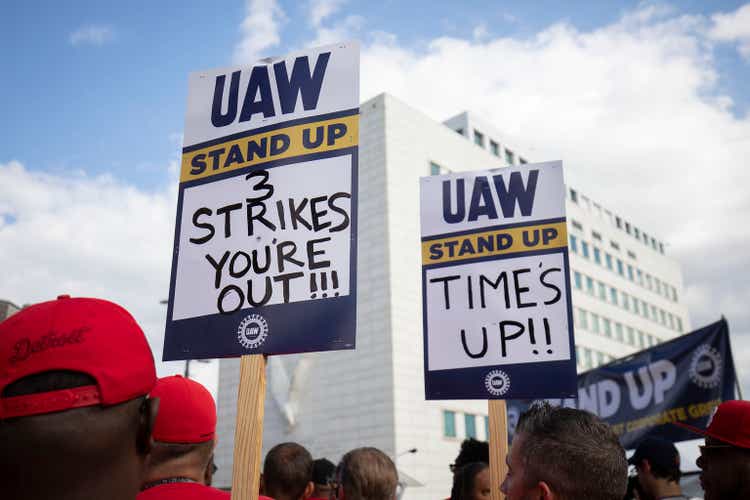
As of at the time of writing, the United Auto Workers (UAW) union prepares to intensify its strikes against the “Big Three” – Ford (F), General Motors (GM) and Stellantis (STLA) – by going beyond a single assembly plants for each carmaker to plants that produce more profitable vehicles such as Ford’s F-150, GM’s Chevy Silverado and Stellantis’ (Dodge) Ram on Friday. Snide barbs about “greedy CEOs” like Tesla (NASDAQ:TSLA) CEO Elon Musk, who’d “rather build rocket ships than pay workers,” have also been thrown.
Overall trends indicate that, outside of the “Big Three”, the bulk of Electric Vehicle (“EV”) manufacturing – including at Tesla – is carried out by non-unionized workers. Therefore, the argument could be made that this is to EV carmakers’ advantage, specifically Tesla.
As it stands, reality is slightly more complicated than that. It could be assumed, given current trends, that EV carmakers face substantial prospect of unionization while further worker unrest can be expected in the very near future. This carries significant consequences for the American worker and middle class, both of whom have long been under siege for reasons not entirely due to actions of company management.
Considering Labor Costs
It’s next to impossible to calculate the value of labor costs on a per-car basis. However, a simple “back of the envelope” method can be employed on balance sheet line items for a rough idea on profits on a “per-car” basis:
-
Take an automobile company’s annual revenue for a financial year and divide by the number of vehicles sold in that year. This can be considered as the revenue earned per car.
-
Next, take the reported gross and profit margins and apply on the per-car revenue to arrive at a gross and net profit on a per-car basis.
- Subtract the profit from revenue to derive a per-car cost.
Using this, a per-car profit and cost can be calculated for a number of companies. Generally, Toyota hovers around $2,500 in profits per car for a manufacturing cost at about $12,500 in most years while Ford earns somewhere around $2,200 (gross) for a cost of around $20,000 per car.
However, this form of calculation isn’t taken seriously by institutional analysts for a simple reason: costs aren’t fixed in that it’s a simple matter of applying labor on components along an assembly line to produce cars that spontaneously appear before buyers. It takes large teams of R&D personnel years of effort to produce the right component mix, years of iterative (and costly) testing of said components to ensure they’re durable and entire teams of experienced accountants and team leaders to keep track of costs of these various efforts to keep plant floors running at a sustainable rate on a bare minimum.
The bigger and more global the company, the further the complications. Depending on the company’s reach, there are also a variety of pre-negotiated financial commitments with suppliers and partners regardless of circumstances, margins meant to be paid to dealers that vary by model, platform and segment to ensure sales are brisk that in turn keep the plant floor running, upgrades to plant machinery and production lines necessary to make/keep the plant floor efficient, taxes to be paid, dividends to be paid to shareholders (if applicable), and so forth. It is no wonder that car manufacturers are often heavily reliant on government subsidies and corporate bond (or “paper”) issuances to stay afloat. In the case of the latter, size helps: generally, the bigger (and older) the company, the more in demand the bonds tend to be.
The absurdity of the “back of the envelope” method becomes more evident when applied to luxury car manufacturers. For instance, Porsche indicates a general trend in gross profit in the region of $17,000 while the manufacturing cost vary from $33,000 to $133,000, depending on how said costs are intertwined with that of parent Volkswagen. Meanwhile, Ferrari has a trending profit of only $6,000 relative to costs of $195,000.
Perhaps the most absurd example would be the Veyron produced by Bugatti (also owned by Volkswagen). In a 2013 research note produced by Bernstein Research, analysts arrived at the conclusion (using this same method) that the company incurs a whopping $6.24 million loss for every $1.5 million Veyron it sells, given the whopping R&D costs of about $1.62 billion relative to low sale volumes. Bugatti responded that the estimates are implausible since they don’t supply financial data. However, to be fair to Bernstein’s analysts, they did mention in the note that these metrics are “obviously very, very approximate” and not to be taken too seriously.
Extending this “back of the envelope” method outward, it could be assumed that 50-60% of a car’s price is attributable to raw materials and spare parts while 16% could be attributed to R&D. Therefore, about 20-25% of the cost (on average) could be considered labor cost if one were to also exclude the likes of advertising costs, storage, transportation and sales tax as being a concern.
Considering the Car Market
In an article written about Rivian’s launch in November of 2021, two factors were highlighted: firstly, new car sales have been in decline for some time now, with the used car market rising in price (as a result). This decline becomes even more stark in the present day: as of June of this year, monthly passenger car registrations in the U.S. are the lowest in over 63 years. The high water mark was September 1986 when more than 1.25 million cars were registered.
Sources: Federal Reserve System, Organisation for Economic Co-operation and Development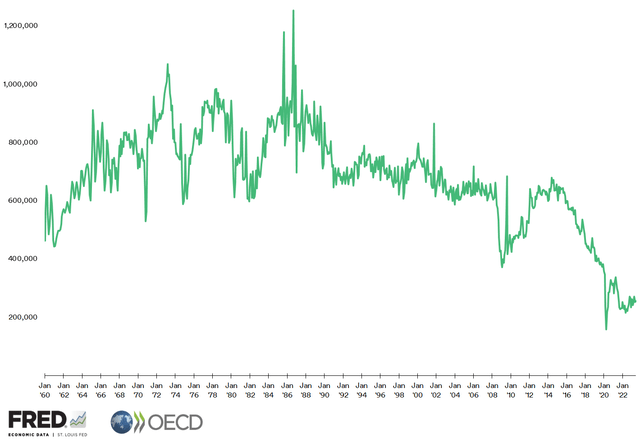
Note: There is a difference between sales and registration. The latter essentially recognizes that a car exists and is fit to operate. Sales volumes typically run higher than registered volumes.
The second factor arose from the modelled sales growth rates of Battery Electric Vehicles (BEVs) versus conventional cars through 2030, which depicted an increasing rise in the former and a decline in the latter in percentage terms. In absolute terms in the present, however, conventional cars reign supreme. Across 2021 and 2022, the biggest share of U.S. car sales were held by the “Big Three” plus Toyota.
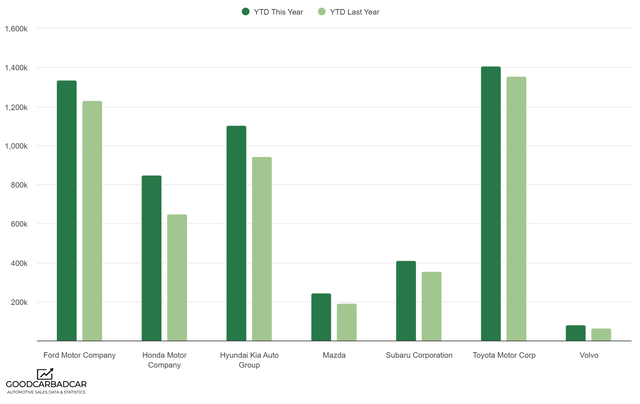
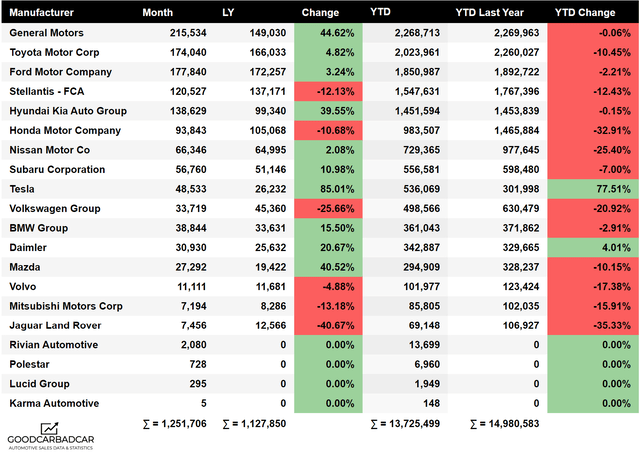
Preliminary trends for 2023, with August’s data (representing two-thirds of the year) indicate volumes for the current year are trending downwards relative to the past year.
Note: Data is still trickling in. The full extent of car sales figures would only be available near the end of December.
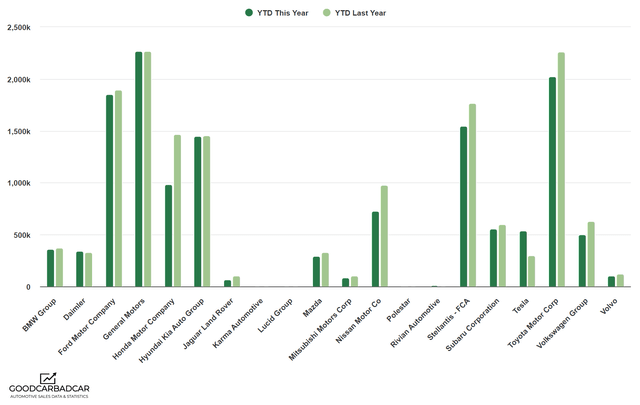
The enormousness of the car market, despite conventional car sales being in decline, can be seen in stark terms in the breakdown of sales by manufacturer in December 2022’s data.
Tesla’s sales across all of 2022 were lower than the collective sales by General Motors, Toyota, Ford and Stellantis in December alone. However, Tesla also showed the highest increase in Year-on-Year (YoY) terms across all the manufacturers.
As the article about Tesla in May indicated, this could be construed as a consequence of an “over-catered” customer base in the higher ends of the income spectrum essentially driving BEV sales. Across the lower ends of the income spectrum is a rising affordability issue that has been apparent for a long time now.
Considering Cost as the Root of Conflict
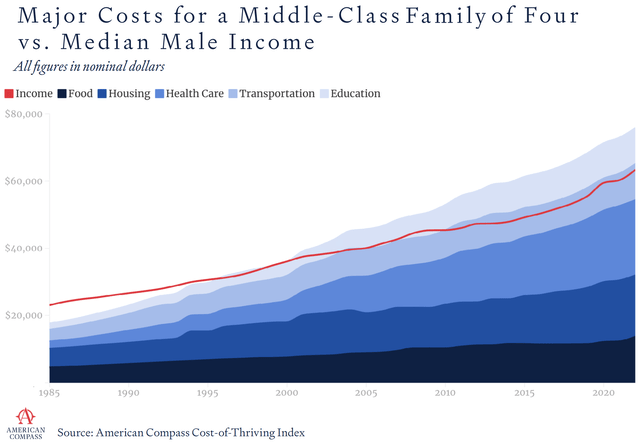
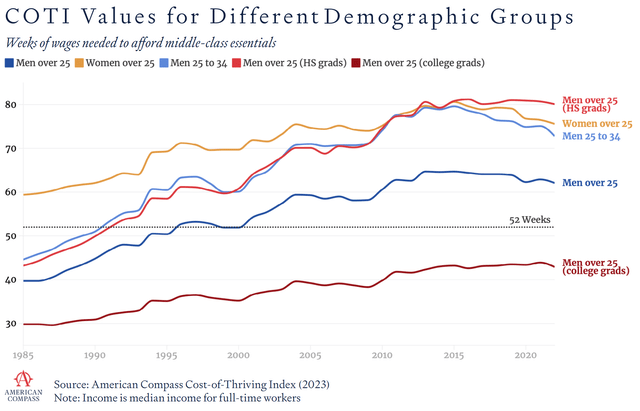
In a report published earlier this year, think-tank American Compass estimates that its Cost of Thriving Index (essentially, an index that quantifies the affordability of “middle-class” amenities such as housing and healthcare) for an average family of four has been increasing in long-term trends since 1985.
In stark terms, the report summarizes thus:
While the typical man working full-time in 1985 could support a family on 40 weeks of income and then still have income from roughly 20% of the year left to cover other expenses and save, a comparable man working full-time in 2022 would work the whole year and still come up ten weeks short.
The most affected are those in prime working age, namely in the 25-34 age range, who need well over an average of 70 weeks of work to be able to afford a year’s (54 weeks) of middle class amenities:
Nowhere is this more apparent than in “Motor City” Detroit. As early as 1961, it was reported that both car companies and city residents were moving out after highs witnessed in 1955. This worsened in the aftermath of the Global Financial Crisis on the back of decades of financial missteps, racial tensions and leadership lapses. As recently as 2022, the City of Detroit itself estimated that household incomes will decline past 2011 levels by 2026 along with a continued departure of residents to other regions.
The uprooting of families is a net loss in personal wealth and by no means is this a localized phenomenon: various estimates indicate national healthcare costs continuing to balloon well past this current decade, interest payments on government bond issuances becoming a substantive drain on government revenues from taxation et al, increasing burdens on government contribution to benefits as a result of this, and the ominous implications on the creation of conditions for “thriving” among America’s youth entering the workforce. In essence, the American middle class is under enormous pressure (as indicated in trends discussed in numerous past articles). Also by no means can blame be laid squarely on any one side of the current political divide: as the data indicates, little of consequence has been done to address these issues in the past four decades wherein both sides of the political divide held sway over the highest seats of power for extended periods of time.
It’s increasingly harder to enter the middle class or stay in the middle class. This has grim consequences on long-term consumption trends of American goods by Americans. Rising costs could be considered to be the root cause behind both a decline in overall new car sales as well as rising clamor among the workers’ unions for higher wages and benefits.
Breaking Down UAW’s Position
Of the three affected companies affected by UAW’s strike, Ford arguably had been the most favorable towards unions by going above and beyond the terms laid out in the aftermath of the last clash in 2019. The company that builds almost 80% of all its vehicles sold worldwide in the U.S. has spent an average of $112,000 annually on wages and benefits for each hourly worker prior to the strike, retained 5,600 more workers than it had committed to in 2019, invested $1.4 billion more than it originally planned and converted almost 14,100 temporary workers to permanent status since 2019.
On the other hand, a tiered system has since been in place that effectively pays younger/newer workers less than older workers, along with a cap of workers’ wages at around $32 an hour. Ford estimates that the average hourly labor costs, including benefits, among the “Big Three” amounts to around $65 per worker, compared to about $55 for foreign non-union automakers in the U.S. like Toyota and Nissan.
While Japanese carmakers are expressly non-unionized, they aren’t exactly anti-union all over the world. For instance, earlier this year, Toyota agreed to all union demands in the very first round of talks with union representatives in a move benefiting 357,000 Japanese workers. Included in this agreement was the biggest base salary increase in 20 years and a rise in bonus payments. Within hours, Honda agreed to union demands for a 5% pay increase, the biggest jump since 1990.
The sheer scale of American unions’ demands makes foreign carmakers more leery, given that their management has had a long history of working more closely with their workers. The UAW is currently asking the “Big Three” for a mid-30% wage increase over the lifespan of the new contract, down from the initial demand for a 40% pay hike, but still far from what auto manufacturers have offered, at 20% at most. Meanwhile, Ford states that UAW’s demands would double its labor costs, which are already significantly higher than that of carmakers that utilize non-union-represented workers.
UAW president Shawn Fain claimed on Sunday that carmakers “could double our wages and not raise the price of the vehicles and still make billions in profits.” This isn’t strictly true: while the aforementioned “back of the envelope” calculations are in no way indicative of indicating profitability, it does indicate that average car pricing matrices are fairly pared to the bone. While major car companies do look profitable on paper, they also need capital to continue staying operational and competitive.
Advantage: Tesla and EV Makers?
Now, it has been estimated that Tesla’s labor costs are at around $45-$50 per worker per hour. Both Ford and Volkswagen have estimated that 30% less labor is required to build an BEV, given they don’t require complex parts needed to build engines and transmissions. Given that, it could be argued that labor costs are on par with that of the “Big Three” (another “back of the envelope” calculation: $50 x 130% = $65).
Given uptrends in EV consumption, the “Big Three” have committed to investing over $100 billion in EV manufacturing over the next few years via joint ownership of plants with companies such as South Korea-based LG Energy Solution and Samsung predominantly located in a growing “Battery Belt,” centered around Georgia, Kentucky, and Tennessee. Most of these developments are in states with “right to work” laws that curtail collective bargaining.
UAW seeks to extend union-driven benefits to workers in EV plants, which would likely require a rather arduous workaround. The “Big Three” – who had hitherto been most conducive to union negotiations – are slated to the biggest beneficiaries of proposed measures that would give extra incentives to BEVs produced by unionized carmakers. However, given foreign carmakers and industry players’ caution over being involved in a union, it can be expected that this wouldn’t go the unions’ way.
Former Ford CEO Mark Fields already warns that UAW’s demands not related to wages – such as the reinstatement of pensions and healthcare for retirees among others – could simply make it more rational for U.S. carmakers to move production to foreign shores such as Mexico. Ford’s unionized plant in Chihuahua, Mexico recently (and peacefully) concluded a negotiation for a 8.2% increase in April. BMW had already announced in February the investment of $870 million into an EV plant in Mexico’s central state of San Luis Potosi. Tesla is expected to invest $5 billion in a new plant near Monterrey in Mexico’s northern state of Nuevo León, which will have an annual production capacity of 1 million EVs. A host of related industry-related Chinese firms are following suit:
Source: The China Project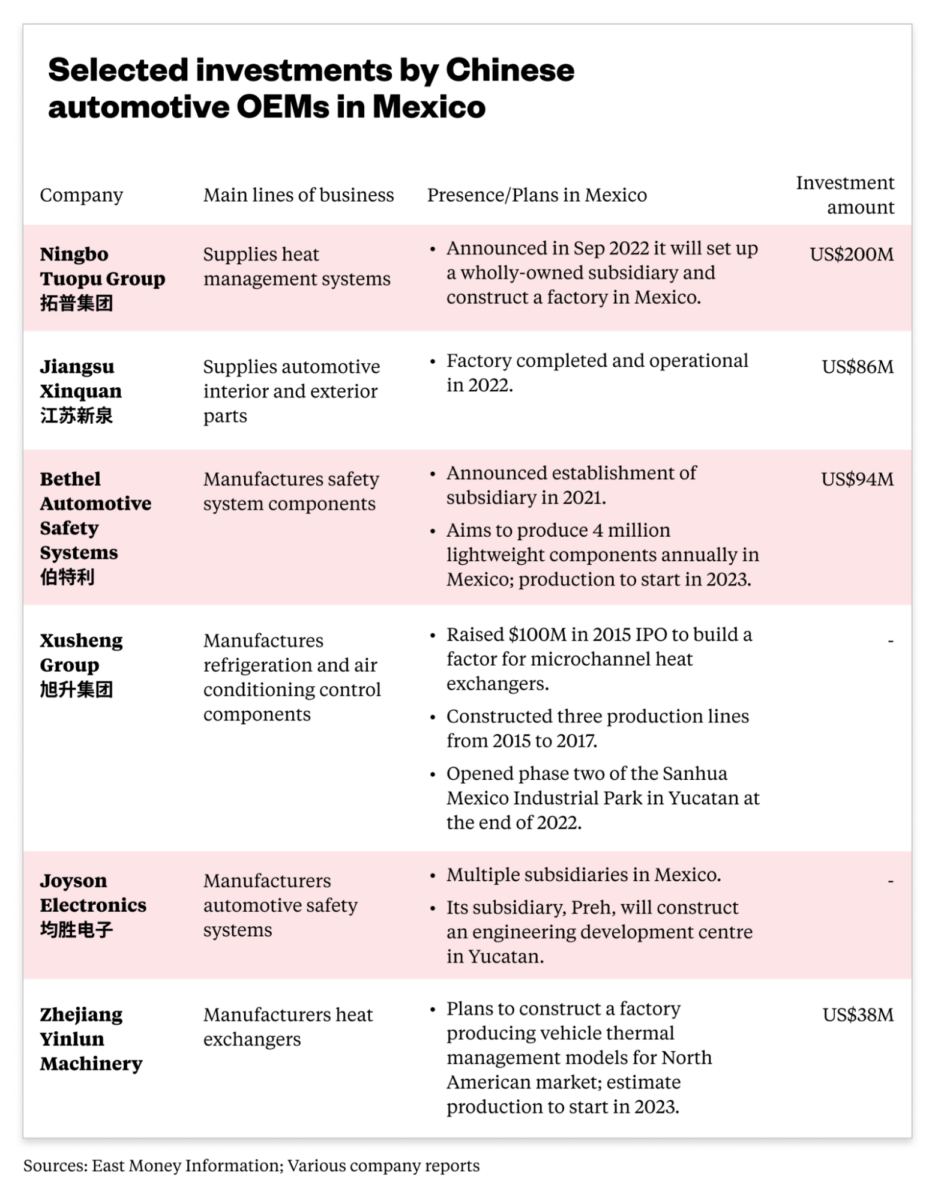
Regardless of the UAW’s demands, the long-term impact on American worker headcount and the further deterioration of middle class growth prospects as a result of aggressive wage and benefits negotiation cannot be ruled out. In fact, it is all too easy to expect that it will happen.
In Conclusion
In 2018, UAW had attempted to (and failed to) raise a union in Tesla’s California plant. At the time, Mr. Musk quipped on social media that workers would rather earn stock grants than pay union dues, which the union argues is illegal interference in union raising. As such, the company has already been ordered by the National Labor Relations Board to rehire an employee fired for organizing activity, which the 5th U.S. Circuit Court of Appeals is presently evaluating. Mr. Musk also claimed that Tesla pays its workers more than UAW-affiliated workers get, which also isn’t quite true, albeit for reasons arguably related to job complexity.
Much of the current bickering between worker and management is severely limited to what the former can squeeze from the latter and how little can the latter get away with conceding to the former. What neither party does (or is willing to do) is address why the conflict exists: rapidly (perhaps even exponentially) rising costs of living, over which neither have substantive control. Decades of laxities in government planning have led to this scenario with, as per current trends, at least a decade more of long-term rising costs expected. Given that, it’s inevitable that this conflict would recur in very short order.
As BEVs become more prevalent and rack up more sales, it can be expected that unions will finally breach Tesla’s wall that has allegedly made unions so unattractive. For instance, it’s quite possible that labor market tightness stays the hand of many a Tesla worker affected by cost increases but bereft of other employment options in the industry. However, as more EV factories open, this will no longer be the case. The only recourse for Tesla would be then to start paying out more in wages, regardless of stock grants, or face the prospect of company personnel unionizing.
Of course, while costs increase and conflicts arise, more and more vehicle production (both conventional and EV) will shift to foreign countries. If that were to happen, the conflict will become the epitome of a “death spiral”: fewer jobs, more conflicts, even fewer jobs, even more conflicts. It’s all too evident that macroeconomic conditions will the root cause of such a spiral. But little by way of the byzantine corridors of power in Washington seem to address it.
Analyst’s Disclosure: I/we have no stock, option or similar derivative position in any of the companies mentioned, and no plans to initiate any such positions within the next 72 hours. I wrote this article myself, and it expresses my own opinions. I am not receiving compensation for it (other than from Seeking Alpha). I have no business relationship with any company whose stock is mentioned in this article.
I lead research at an ETP issuer that offers daily-rebalanced products in leveraged/unleveraged/inverse/inverse leveraged factors with various stocks, including some mentioned in this article, underlying them. As an issuer, we don't care how the market moves; our AUM is mostly driven by investor interest in our products
Seeking Alpha’s Disclosure: Past performance is no guarantee of future results. No recommendation or advice is being given as to whether any investment is suitable for a particular investor. Any views or opinions expressed above may not reflect those of Seeking Alpha as a whole. Seeking Alpha is not a licensed securities dealer, broker or US investment adviser or investment bank. Our analysts are third party authors that include both professional investors and individual investors who may not be licensed or certified by any institute or regulatory body.

