Summary:
- Tesla, Inc. has demonstrated its ability to remain an EV market leader, attributed to the lower COGS/ASPs and expanding profit margins in Q3 ’24.
- Tesla management has also reiterated their mass-market model deliveries from H1 ’25 onwards, with it likely to trigger higher volume sales as borrowing costs moderate.
- Even so, TSLA offers an uncertain return profile at a triple-digit FWD P/E, despite the promising long-term prospects in the EV/robotaxi/humanoid robot end markets.
- If anything, we do not expect meaningful top/bottom-line contribution from the robotaxi segment through FY2026, with a moderate increase in expenses likely as it ramps up the autonomous testing.
- For now, TSLA’s consistent erosion in the US/EU market share and the uncertain break-out of the 2024 resistance levels warrant a more cautious approach.
ChristianChan
Tesla Remains A Mag7 Laggard – Uncertain Return Profile At Triple Digits FWD P/E
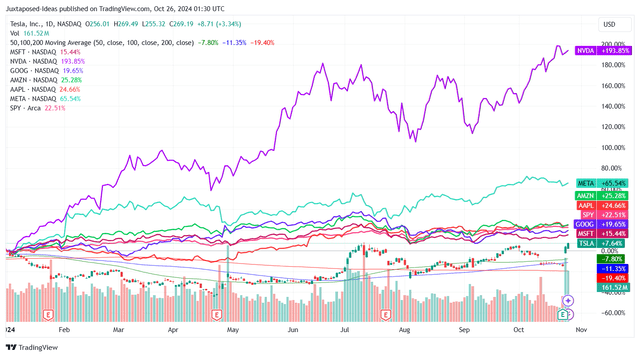
We previously covered Tesla, Inc. (NASDAQ:TSLA, NEOE:TSLA:CA) in July 2024, discussing its underwhelming YTD performance despite the recent rally from the April 2024 bottom. We concluded that the stock “did not look like a Magnificent 7 stock.”
While there remained massive opportunities in their FSD/Robotaxi/Humanoid Robot ambitions, we were uncertain when the company might effectively monetize these capabilities – attributed to their penchant for “elongated timelines,” resulting in our reiterated Hold rating then.
TSLA YTD Stock Price
Since then, TSLA has continued to trade sideways, attributed to the market’s “lackluster response” to the “We, Robot” unveiling on October 10, 2024 – one that appears to be hardly innovative, no matter the former’s much sleeker design.
If anything, readers must remember that its “full unsupervised autonomous driving” is expected to commence in 2025, with the Cybercab slated to enter mass production only by 2026.
These imply a prolonged monetization process for TSLA’s robotaxi ambitions. This is especially since Alphabet’s (GOOG) (GOOGL) Waymo is already officially operational in numerous cities, as General Motor’s Cruise (GM) restarted their operations in San Francisco since April 2024. The former is likely to report a moderate increase in operating expenses as it ramps up the autonomous testing.
Despite so, these uncertain robotaxi developments have been well-balanced by the more than excellent Q3 ’24 earnings results, with the automaker reporting bottom-line beat with adj EPS of $0.72 (+38.4% QoQ/+9% YoY) despite the top-line miss at $25.18B (-1.25% QoQ/+7.8% YoY).
Much of TSLA’s tailwinds are attributed to the expanded automotive sales gross margins of 16.4% (+2.6 points QoQ/+0.7 YoY), despite the lower estimated Average Selling Prices of $41.99K per unit (-1.8% QoQ/-5.5% YoY).
This is based on the Q3 ’24 automotive sales of $18.83B (+1.6% QoQ/+1.3% YoY) and the deliveries of 448.45K units (+3.3% QoQ/+7.3% YoY), after deducting the operating lease accounting sum at 14.44K (+41.2% QoQ/-17.1% YoY).
It is apparent from these developments that TSLA has been able to effectively lower their COGS to approximately $35K per unit (-4.6% QoQ/-6.4% YoY) while drastically optimizing their operating expenses to $2.28B (-23.2% QoQ/-5.3% YoY), thanks to the drastic Q2 ’24 restructuring.
These efforts have naturally resulted in the automaker’s increasingly rich overall operating margins of 10.8% (+4.5 points QoQ/+3.2 YoY) and bottom-line beat, as discussed above.
These developments further underscore TSLA’s excellent prospects as one of the leading EV automakers, especially since the management believes that they remain “on-track to deliver more affordable models starting in the first half of 2025,” somewhere in the $25K price range.
While it remains to be seen how the profit margins on the mass-market models may be like, we believe that the management has delivered a convincing sequential improvement in its core automotive gross profit margins. It is one that has exemplified its ability to eventually drive growth through the mass market models’ higher sales volume.
If anything, TSLA’s prospects are significantly aided by the Fed’s recent outsized pivot in the September 2024 FOMC meeting. That has triggered the moderation in borrowing costs for new vehicles from 7.3% in June 2024 to 7.1% by September 2024, albeit still elevated compared to the normalized levels of 5.4% in December 2019.
Even so, with the rate normalization already in progress, we believe that the cost of borrowing is likely to continue moderating – with it potentially triggering improved sales on a sequential basis.
TSLA’s Non-Automotive Prospects
At the same time, TSLA has been generating consistent improvements in two other key segments, Energy Generation and Services, with the latter’s still rich gross margins of 91% underscoring why the management has been highly enthused about their FSD capability, especially since “the take rate for FSD has improved substantially especially after the 10/10 event.”
Assuming that the adoption of autonomous driving capability accelerates domestically and globally, we may see TSLA report an accelerated Services growth moving forward – with the rich gross margins directly being bottom-line accretive.
The Consensus Forward Estimates
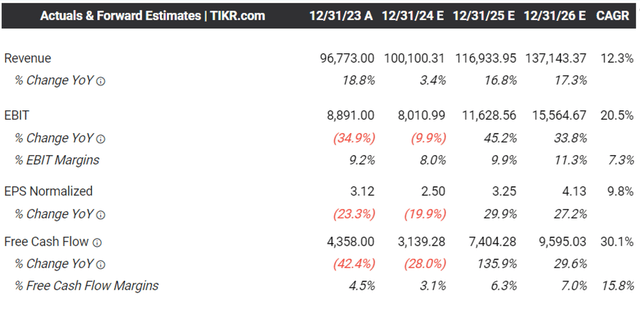
As a result of these developments, we can understand why the consensus forward estimates for TSLA remain promising, with FY2024 being a trough year and its top/bottom lines growing through FY2025/FY2026.
TSLA Valuations
Despite so, we are uncertain if these developments warrant TSLA’s rich FWD P/E non-GAAP valuations of 104.90x, compared to its 1Y P/E mean valuation of 65.29x, 10Y mean of 84.09x, and the sector median of 17.06x.
If we compare TSLA FWD PEG non-GAAP ratio of 7.16x against its legacy/start up automotive peers, including GM at 0.51x, Ford (F) at 1.30x, BYD Company (OTCPK:BYDDF) at 0.93x, and Li Auto (LI) at 1.99x, it goes without saying that the former is overly expensive here.
Even if we are to take TSLA’s Magnificent 7 position into consideration, the same overvaluation is observed. Consider the well diversified GOOG at 1.27x, Amazon (AMZN) at 1.78x, Apple (AAPL) at 3.65x, Meta (META) at 1.15x, Microsoft (MSFT) at 2.41x, and Nvidia (NVDA) at 1.29x – with it offering interested investors with a minimal margin of safety.
So, Is TSLA Stock A Buy, Sell, or Hold?
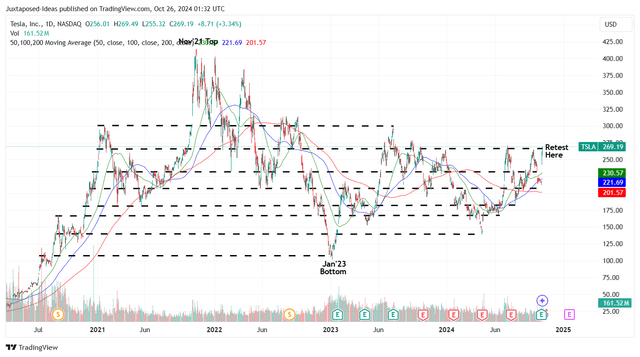
TSLA 4Y Stock Price
For now, TSLA has had an impressive +25.9% recovery after the robust Q3 ’24 earnings call, with the stock running away from its 50/100/200 day moving averages while retesting the 2024 resistance levels of $260s.
Based on the LTM adj EPS of $2.40 (-33.5% sequentially) and its 1Y P/E mean valuation of 65.29x, it is apparent that the stock has run away (yet again) from our updated fair value estimates of $156.70.
Based on the consensus downgraded FY2026 adj EPS estimates from $4.48 to $4.13, there remains a minimal margin of safety to our updated long-term price target of $269.60.
At the same time, we maintain our previous conclusion that TSLA is likely to be rather volatile moving forward. This is attributed to the massive fluctuation in its FWD P/E valuations from the current peaks of 104.90x to the December 2022 lows of 21.38x – with it apparent that the stock is not for the faint-hearted.
If anything, we expect the EV market competition to further intensify, as GM highlights growing EV investments and sales momentum in the recent earnings call.
The same has been highlighted by Kelley Blue Book by October 2024, with US EV sales growing to 346.3K units in Q3 ’24 (+5% QoQ/+11% YoY) and EV share expanding to 8.9% (+1.1 points YoY) – partly attributed to the higher incentives and discounts at ~12.2% (+2.2 points QoQ).
TSLA’s Eroding Market Share
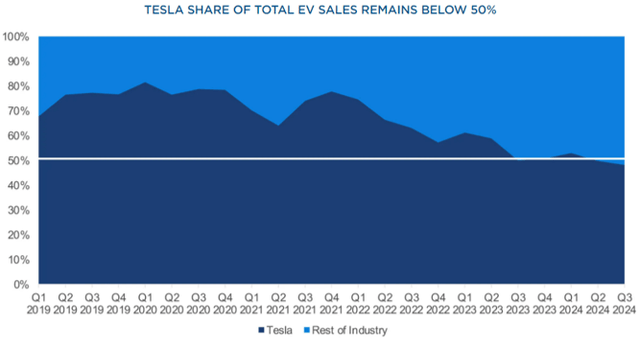
These developments have also contributed to TSLA’s sustained erosion in the US EV market share to below 50% since Q2 ’24 – with the downtrend likely to continue as more of its peers catch up rapidly.
Despite the hefty tariffs, more Chinese automakers have continued to export their offerings to the EU as well. This is attributed to their ability to remain competitive while achieving positive profit margins, naturally triggering more headwinds to TSLA’s moderating market share to 15.5% by July 2024 (-2.5 points YoY).
As a result of TSLA’s overly expensive valuations, erosion in market share, delayed robotaxi monetization, and the uncertain break-out of the 2024 resistance levels, we believe that it may be more prudent to reiterate our Hold rating here.
Do not chase this rally.
Analyst’s Disclosure: I/we have a beneficial long position in the shares of NVDA either through stock ownership, options, or other derivatives. I wrote this article myself, and it expresses my own opinions. I am not receiving compensation for it (other than from Seeking Alpha). I have no business relationship with any company whose stock is mentioned in this article.
The analysis is provided exclusively for informational purposes and should not be considered professional investment advice. Before investing, please conduct personal in-depth research and utmost due diligence, as there are many risks associated with the trade, including capital loss.
Seeking Alpha’s Disclosure: Past performance is no guarantee of future results. No recommendation or advice is being given as to whether any investment is suitable for a particular investor. Any views or opinions expressed above may not reflect those of Seeking Alpha as a whole. Seeking Alpha is not a licensed securities dealer, broker or US investment adviser or investment bank. Our analysts are third party authors that include both professional investors and individual investors who may not be licensed or certified by any institute or regulatory body.


