Summary:
- The market’s concentration on Tesla, Inc. gross profit margins overlooks the lack of progress in cutting unit production costs.
- Tesla’s ability to grow gross profit globally has been aided by first mover advantage in the USA and other markets outside China, giving it considerable pricing power.
- Tesla’s ability to cut prices and increase demand is now challenged by other BEV manufacturers in China who are also cutting their prices to capture market share.
- Pricing power has camouflaged the fact Tesla’s unit production costs have not been decreasing. With diminishing pricing power, Tesla must start to meaningfully cut unit production costs.
- Unless there is a start to ongoing cuts in unit production costs, enabling ongoing BEV price cuts, while maintaining margins, the Tesla profit growth story will be invalidated.
Jonathan W. Cohen/iStock Editorial via Getty Images
Investment Thesis
In my June 16 article, “Tesla’s Concerning Q1: Forensic Analysis Of Price Elasticity, Downgrade To Hold,” I concentrated my analysis on Tesla, Inc.’s (NASDAQ:TSLA) operations in China. Among the reasons for this were the big price cuts in China effective Jan. 6, 2023, and the effects these had on demand for Tesla vehicles. My analysis was aided, surprisingly, by availability of greater detail on vehicle deliveries in China than other parts of the world.
I say surprisingly because greater transparency is not what we intuitively expect from an autocratic state. China is the one market we can get sufficient information to make a really close assessment of sales revenues in a particular market, together with vehicle deliveries in that market, enabling tracking of average selling price per vehicle across time. But China is just one piece of the puzzle. In this article I include analyses of Rest of World (“RoW”) and total performance. I find a worrying trend in unit cost of production of Tesla vehicles. As important as gross profit margins are, unit cost of production of vehicles is the more important statistic to review Tesla’s progress and gauge its future.
Need to continuously lower unit cost of production of Tesla vehicles –
Tesla has experimented with price elasticity, increasing prices to dampen demand at times of shortfalls in production, and decreasing prices to boost demand at times of excess production. This has worked well for Tesla for the most part, except for concerns arising with China in Q1 2023, as discussed in my previous article, linked above. These pricing experimentations have resulted in significant variations in gross profit margins, but Tesla has remained overall highly profitable. But the degree to which Tesla can cut auto selling prices and still remain profitable will ultimately be limited by the degree to which it can cut vehicle production costs.
It is Tesla’s stated objective to continuously reduce unit cost of production by increasingly efficient design and manufacture to enable lowering of auto selling prices, to bring prices down to a level affordable by the masses, thus achieving high volume and economies of scale in the process. Excerpts from a reply by Elon Musk in the Q&A session of Tesla’s 2023 Investor Day:
… overwhelmingly there’s the desire for people to own a Tesla is extremely high – the limiting factor is their ability to pay for a Tesla not do they want a Tesla… it’s easy for people in this room to lose sight of if your income is far in excess of what a car costs – then you look at value for money but you do not consider affordability – but for the vast majority of people it is affordability driven…one of the things we weren’t sure about was the price elasticity of demand for Teslas so like as we lower the price how much does the demand increase…and we found that even small changes in the price have a big effect on demand – very big – so that was a good thing to learn…
Justifying the current Tesla share price –
For Tesla to justify its current share price will require large increases in earnings, which in turn requires large increases in auto sales volumes, accompanied by high margins. For Tesla, increasing volume of auto sales requires ongoing price reductions. Maintaining high margins in conjunction with ongoing price reductions requires ongoing reductions in auto unit production costs.
Tesla is not achieving the required cuts in unit costs of production –
My investigations and analyses, set out in detail below, indicate Tesla so far is not achieving the necessary reductions in auto unit production costs, to enable ongoing reductions in auto selling prices to drive large volume increases, while maintaining high margins. Unless progress is made in this direction in the quarters ahead, I believe it will become increasingly difficult to imagine the current share price level is justifiable. At the same time, what any of us might imagine in the future for Tesla, we will likely be surprised at what we failed to imagine, as the future unfolds. For that reason, and that reason alone, I will for the time being maintain a Hold rating for Tesla.
Detailed Investigation and Analysis
It is well understood volume increases can produce economies of scale due to greater utilization of resources with fixed costs, but it is certainly not guaranteed. There can be diseconomies of scale due to inefficiencies as utilization of resources is stretched. The best test of whether increased scale is producing economies is to look at increments/decrements between periods. Whether incremental margins are positive, and how strongly positive, is an indication of whether scaling up is producing desired results. But incremental margins can increase due to other factors, such as pricing power, so we need to look deeper before assuming scaling up is the reason.
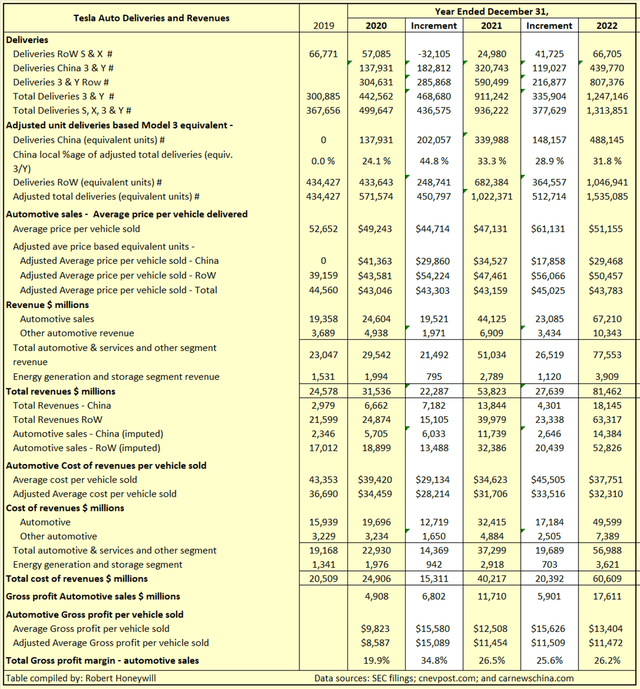
In Table 1 below, I have shown incremental growth for Tesla automotive sales, production costs, and gross profit margin, over the last couple of years through December 31, 2022.
Table 1
SEC filings, cnevpost.com and carnewschina.com
Before commenting on the results in Table 1, I need to explain some of the assumptions and constructs adopted.
- Deliveries are shown as reported and as adjusted units. The adjusted units figures are based on converting models S, X and Y to the equivalent of Model 3 number of units sold, based on prices for the various models. This is somewhat arbitrary but is useful for review purposes, as explained below.
- Using adjusted equivalent units is intended to reduce distortions to comparative statistics for revenue, cost, and margin per auto delivered, between periods with different mixes of number of models delivered. This is considered important as there have been large fluctuations in deliveries of X and S models between periods, as can be seen from Table 1. Also, the proportion of the dearer model Y in the 3 and Y mix has increased significantly over the period. By using equivalent units for calculating average revenue per vehicle the sales mix effect is roughly eliminated and price movements approximate changes to selling price levels.
- Tesla reports revenue by geographic location of where deliveries take place. For China it is possible to find reports analyzing deliveries between local and export, and up until 2nd quarter 2023, there were no imports from other Tesla locations for local sale (imports of X and S models commenced in April 2023). So we know the number of vehicles delivered locally in China and that they are all 3 or Y models. We also know the Tesla revenue for China, although that includes Energy generation and storage revenues and service and other revenue applicable to autos but which are not applicable to auto sales. I have made a somewhat arbitrary calculation to exclude these revenues to arrive at auto sales revenue for China (while arbitrary I believe this calculation can be considered reasonably within range of actual). Based on all of the foregoing I have been able to separate out figures for China domestic deliveries, sales revenue and sales price per unit.
- Tesla worldwide deliveries and sales revenue are available from Tesla SEC filings. By deducting China deliveries and sales revenue, it is possible to calculate corresponding separate statistics for Rest of World (“RoW”) as appear in Table 1 above.
With those explanations made I am now better able to provide meaningful comment on the outcomes of the analysis of Tesla data in Table 1, as follows.
- Average price per vehicle sold – Average price decreased from $49,243 in 2020 to $47,131 in 2021, before increasing to $51,155 in 2022. These changes in average price coincided with a large decrease in S and X deliveries between 2020 and 2021 and a large increase in deliveries of these higher priced models between 2021 and 2022. It is clear from the incremental average prices of $44,714 for 2021 and $61,131 for 2022, that these changes in deliveries had a distorting impact on total average selling prices due to differing sales mix, quite apart from any actual selling price changes. Accordingly, the remainder of my comments will be based on statistics utilizing adjusted equivalent unit deliveries to avoid this distortion.
- Adjusted average selling price China – As would be expected the average selling prices for China are far below those for RoW and have come down progressively from $41,363 in 2020 to $34,527 in 2021 and to $29,468 for 2022. This is generally consistent with announced price cuts and reflects a need to cut prices driven by intense competition impacting growth objectives. Of course, unit production costs for China would certainly be lower than for RoW, but separating out production costs by geography is not possible based on data provided by Tesla, so separate margin calculations are not possible.
- Adjusted average selling price RoW – While China average selling prices have decreased progressively through end of 2022, RoW average selling prices have increased from $43,581 in 2020 to $47,461 in 2021 and to $50,457 in 2022. These increases are not inconsistent with price changes during the period, driven by a need to increase or decrease demand to better match production. It is also observed that price competition for Tesla in RoW markets is nothing like in China and competitors in these markets also lack the delivery capacity that exists in China.
- Unit production costs (global total) – Adjusted average cost per vehicle sold of $31,706 for 2021 is below the $34,459 for 2020, likely due to economies of scale and manufacturing efficiencies being reflected in adjusted unit production costs, as would be expected. But the average cost per vehicle sold of $32,310 for 2022 is above 2021 level, despite delivery volumes increasing by ~50%.
- Adjusted average gross profit per vehicle sold (global total) – Gross profit per vehicle sold in 2021 of $11,454 was an increase of $2,867 over 2020. This increase was comprised of average selling price increase of $113 and average cost reduction of $2,753 per vehicle sold. The cost reduction likely can be attributed to increased scale, with total deliveries almost doubling from 571,574 for 2020 to 1,022,371 for 2021. Gross profit per vehicle sold in 2022 of $11,472 was an increase of $18 over 2021. This increase was comprised of average selling price increase of $624 offset by an average cost increase of $604 per vehicle sold. The unit cost increase has occurred despite increased scale, with deliveries increasing by ~50% from 1,022,371 for 2021 to 1,535,085 for 2022.
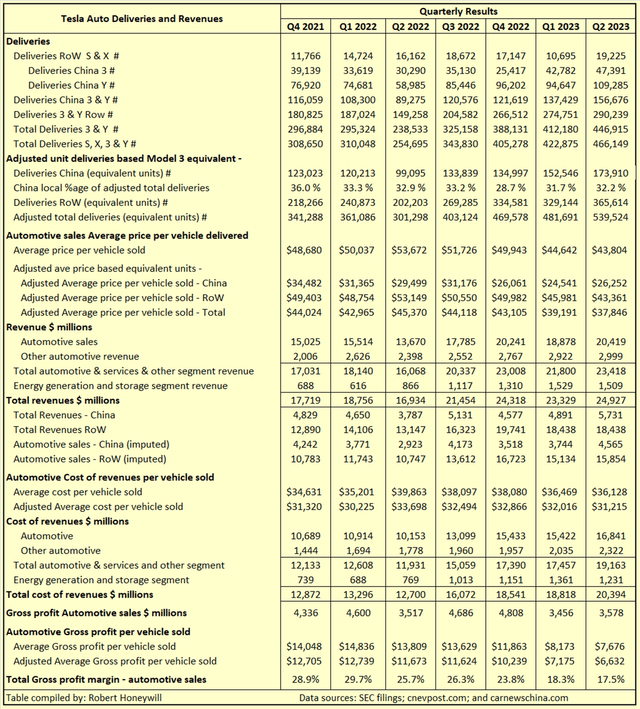
To gain a more up to date view, I carried out a similar exercise to above, but by quarters, as reflected in Table 2 below.
Table 2
SEC filings, cnevpost.com and carnewschina.com
Table 2 shows adjusted average cost per vehicle sold increased from $31,320 for Q4 2021, to $33,698 for Q2 2022. This increase can be attributed to the low production and sales in Q2 2022 when production was shut down in China due Covid restrictions. Since Q2 2022 the adjusted average cost per vehicle sold has progressively reduced to $31,215 by Q2 2023. However, the adjusted average cost per vehicle sold in Q1 2022 of $31,3215 is only slightly below the $31,320 for Q4 2021.
Summary and Conclusions
Tesla has enjoyed dominance in its markets due to its first mover advantage. That first mover advantage is being progressively eroded by increasing competition from parties capable of producing and supplying large volumes of quality BEVs at competitive prices. My analysis above indicates Tesla’s strong and growing gross profit margins have been driven by pricing power. Since the end of 2021, production scale-up and manufacturing efficiencies have not contributed in a meaningful way, according to the numbers. If they have contributed, which I think is possible, there are offsetting factors that have kept average unit production costs up. It could be that the results of cost reduction efforts are yet to emerge in future quarters. From Tesla Q1 2023 earnings call,
Progress on vehicle cost reduction continued in Q1 with meaningful improvements on logistics and the beginnings of some commodity cost reductions starting to be realized.
Per unit cost for Austin and Berlin improved as well, driven by record volumes. However, these factories still provide a margin headwind and will likely continue to do so until after we reach and stabilize at our intended volumes.
And from Tesla Q2 2023 earnings call,
as we continue to work on reducing our Austin and Berlin cost, which we did quite a bit of that from Q1 to Q2, these factories are still slightly above Model Y production costs elsewhere. And in the quarter, our mix of Austin and Berlin related builds increased. And so, that’s something to consider as you model out the impact on – from Q1 to Q2 in terms of COGS per unit.
we’ve naturally been a little bit hedged from the lithium position because of the long-term contracts we have in place. But we have seen reduction in pricing across the board for all commodities that specifically go into batteries such as nickel, cobalt and graphite. And the reductions in pricing translate into thousands of dollars when you look at it from a per-vehicle impact. We’re taking advantage of the historically low commodity pricing and certainly [Indiscernible] to kind of extend some of those fixed price contracts through the end of the decade. So it’s a playbook that we’ll continue to kind of go back to as we look to the future.
This is a serious matter for Tesla investors. The growth story is based on continuing reductions in unit production costs, enabling access to mass markets through comparable selling price cuts, while still maintaining high margins and rapidly growing volume to achieve extraordinary profit growth. My review finds, since end of 2021, unit costs have barely changed, while vehicle selling prices have been substantially reduced. The increasing gross profit margin and profit growth up until the end of 2021 appear to derive primarily from pricing power as a result of that first mover advantage. Further price cuts to grow volume will further reduce margins, unless further cost cuts can be achieved.
While I maintain a Hold on Tesla, Inc. at present, that could change if I do not see improvement by way of lower unit production costs in quarters ahead. This does not mean that I think Tesla has not performed fantastically and that it will not do exceedingly well in the future. It just calls into question the extraordinary amount of potential earnings growth implicitly reflected in the current share price.
Analyst’s Disclosure: I/we have no stock, option or similar derivative position in any of the companies mentioned, and no plans to initiate any such positions within the next 72 hours. I wrote this article myself, and it expresses my own opinions. I am not receiving compensation for it (other than from Seeking Alpha). I have no business relationship with any company whose stock is mentioned in this article.
Disclaimer: The opinions in this document are for informational and educational purposes only and should not be construed as a recommendation to buy or sell the stocks mentioned or to solicit transactions or clients. Past performance of the companies discussed may not continue and the companies may not achieve the earnings growth as predicted. The information in this document is believed to be accurate, but under no circumstances should a person act upon the information contained within. I do not recommend that anyone act upon any investment information without first consulting an investment advisor and/or a tax advisor as to the suitability of such investments for their specific situation. Neither information nor any opinion expressed in this article constitutes a solicitation, an offer, or a recommendation to buy, sell, or dispose of any investment, or to provide any investment advice or service. An opinion in this article can change at any time without notice.
Seeking Alpha’s Disclosure: Past performance is no guarantee of future results. No recommendation or advice is being given as to whether any investment is suitable for a particular investor. Any views or opinions expressed above may not reflect those of Seeking Alpha as a whole. Seeking Alpha is not a licensed securities dealer, broker or US investment adviser or investment bank. Our analysts are third party authors that include both professional investors and individual investors who may not be licensed or certified by any institute or regulatory body.
