Summary:
- Sentiment plays a significant role in trading Tesla stock, with fundamental forces also at work but not necessarily leading the stock price.
- Elliott Wave Theory and Fibonacci Pinball provide a non-linear approach to analyzing Tesla, offering a more nuanced tool than traditional technical analysis.
- We provide our updates on Tesla stock, with a focus on key resistance levels and potential turning points.
CelesteQuest/iStock via Getty Images
By Levi at Elliott Wave Trader; Produced with Avi Gilburt
The sentiment is strong in this one. In fact, our own Lyn Alden, lead fundamental analyst, affirms that Tesla (NASDAQ:TSLA) is one of the stocks that trades almost entirely on said sentiment. Yes, there are fundamental forces at work here, but do they lead the stock price? What is actually at work in the pushing and pulling across the chart? Let’s discover a bit more about the methodology that we use to analyze (TSLA). As well, we will share our latest update from the Wave Setups feature provided to members. The Fibonacci Queen, Carolyn Boroden will also provide her take. Ready?
First, Let’s Take A Retrospective Look
Seeking Alpha
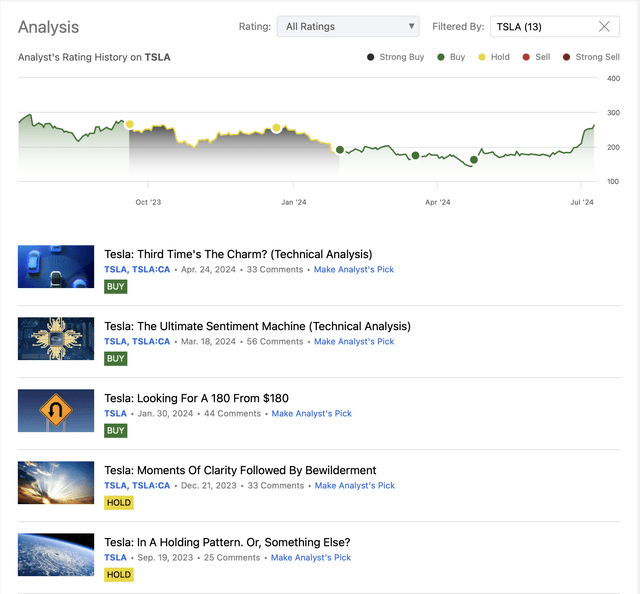
Here are the last five release dates for our Tesla articles. Members receive updates on a daily basis, but when we see a potentially key turning point, as we are able, we will also provide information to the readership here.
(Please keep in mind that the Buy / Hold / Sell ratings are required by Seeking Alpha. However, we are publishers of information and educators and are not an investment advisor or a brokerage research firm)
Easily identified are the past two articles marked in yellow that show we did not have a clear bullish setup. However, the next three missives did show the potential for a move higher. It took till the third setup for traction to really kick in. And did it ever. That setup is now up +62% as of the writing of this update. We would encourage you to briefly review that article again to see what we were looking for and then how it has actually played out in the weeks since.
This Is So Much More Than Technical Analysis
We understand why the label ‘technical analysis’ is used to describe our work. But what is left out of this sobriquet is that our methodology is actually so much more. Traditional ‘technical analysis’ is quite linear in nature. However, ask yourself, “How would a linear tool be effective in analyzing a non-linear system?”. The answer, as we have discovered over many years of study and in-depth observation, is that “it’s not” truly up to par in doing so.
As such, many will declare ‘technical analysis’ as unworthy of their attention and time. So, let us briefly explain why Elliott Wave Theory with the overlay of Fibonacci Pinball is the right tool for the analysis of a non-linear, fluid and dynamic environment such as the stock market.
When To Properly Use The F-Word (Fundamentals) When Investing
This was the title of an article published to the readership and written by Avi Gilburt. In it, he describes in-depth the why’s and the how’s of the market’s true nature. Again, if you have the inclination and desire to learn this, then we would encourage you to read that piece in its entirety here.
Here’s an appetizer for the main course. It’s an excerpt from the article that is discussing “why” markets turn when they do:
“During a negative sentiment trend, the market declines, and the news seems to get worse and worse. Once the negative sentiment has run its course after reaching an extreme level, and it’s time for sentiment to change direction, the general public then becomes subconsciously more positive. You see, once you hit a wall, it becomes clear it is time to look in another direction. Some may question how sentiment simply turns on its own at an extreme, and I will explain to you that many studies have been published to explain how it occurs naturally within the limbic system within our brains.
When people begin to subconsciously turn positive about their future (which is a subconscious – and not conscious – reaction within their limbic system, as has been proven by many recent market studies), they are willing to take risks. What is the most immediate way that the public can act on this return to positive sentiment? The easiest and most immediate way is to buy stocks. For this reason, we see the stock market lead in the opposite direction before the economy and fundamentals have turned.” – Avi Gilburt
How We Apply This Theory In Practice With Tesla
Let’s take a look at the most recent update shared today by Zac Mannes:
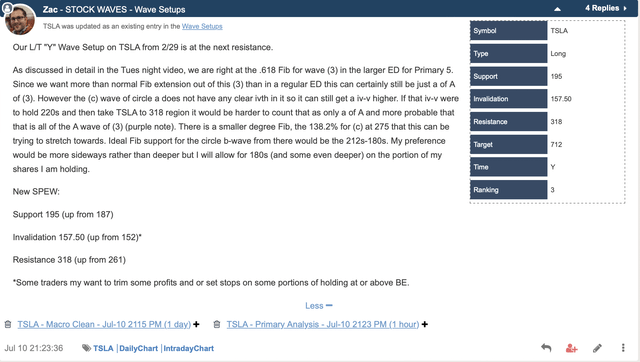
By Zac Mannes – Stock Waves – Elliott Wave Trader
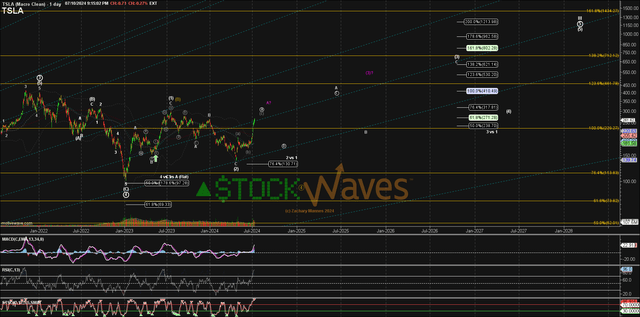
By Zac Mannes – Stock Waves – Elliott Wave Trader
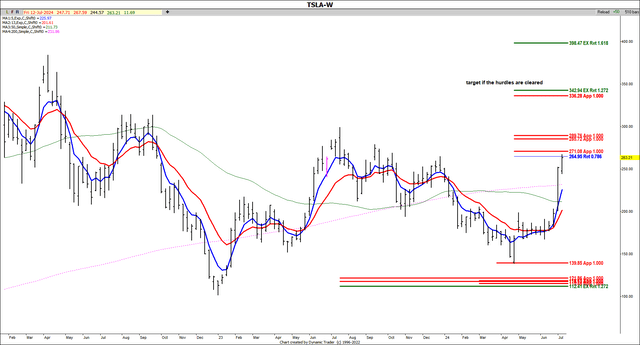
Note that long-term, Zac has a bullish scenario in place here. While this is the primary path currently in play on his chart, there are other probabilities and we are monitoring them closely. You will note here though specific levels and a key resistance area upcoming at the $270 – $310 area. How the stock reacts to this level will be quite telling for the next likely move.
It is at this time that we are turning just slightly protective in the near term. And, as Zac mentions in his post, “some traders may want to trim some profits”.
The Fibonacci Queen Weighs In On Tesla
We are happy to have Carolyn Boroden with us as one of our lead analysts. Here is a snapshot of her brief bio:

Elliott Wave Trader
There is an elegant simplicity to her methodology that has been honed, refined and polished over decades of practice. For those familiar with this work, they will report that it is almost uncanny at identifying high-probability turning points in stocks and the market overall. Shared below is her latest update for (TSLA) on both the daily and weekly timeframes.
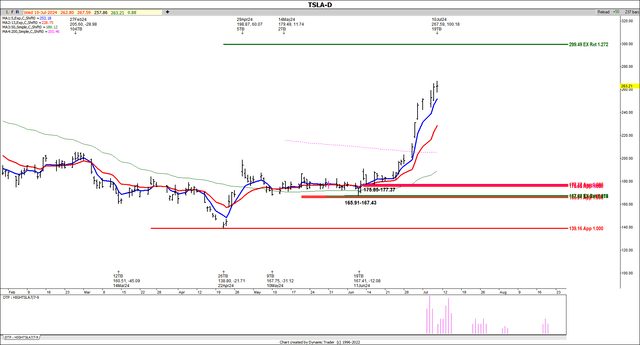
By Carolyn Boroden – Elliott Wave Trader
By Carolyn Boroden – Elliott Wave Trader
You can see on the daily time frame that there is some minor timing indicating a potential swing high in price as of July 10th, +/- 1 day either way. Note also on the weekly interval chart that Carolyn’s work seems to have some overlap with our own methodology via Elliott Wave Theory and Fibonacci Pinball. The $270 – $290 zone may provide resistance in the near term.
Carolyn also provides some free videos on YouTube that explain her use of specific indicators and how they can work to help identify potentially turning points on all time frames.
What Is Generating These Setups?
What is the methodology that produces these targets and identifies the risk vs reward? Simply put, what is at work here has always been. However, it needed to be identified and then quantified. If you can do this, then you can open your eyes to an entirely new way of looking at the markets.
Avi Gilburt has written extensively about this way of viewing the markets. You can read this six-part series available to the readership – just start here with part one.
Conclusion
Many weeks back, in April of this year, we used our analysis to identify a bullish setup in TSLA. And now that same analysis is telling us to protect those gains. Yes, there are nuances to the analysis. Once familiar with our methodology, our members discover a powerful ally on their side to provide guidance and risk management in their trading/investing.
There are many ways to analyze and track stocks and the market they form. Some are more consistent than others. For us, this method has proved the most reliable and keeps us on the right side of the trade much more often than not. Nothing is perfect in this world, but for those looking to open their eyes to a new universe of trading and investing, why not consider studying this further? It may just be one of the most illuminating projects you undertake.
(Housekeeping Matters)
If you would like notifications as to when our new articles are published, please hit the button at the bottom of the page to “Follow” us.
Analyst’s Disclosure: I/we have no stock, option or similar derivative position in any of the companies mentioned, and no plans to initiate any such positions within the next 72 hours. I wrote this article myself, and it expresses my own opinions. I am not receiving compensation for it. I have no business relationship with any company whose stock is mentioned in this article.
Seeking Alpha’s Disclosure: Past performance is no guarantee of future results. No recommendation or advice is being given as to whether any investment is suitable for a particular investor. Any views or opinions expressed above may not reflect those of Seeking Alpha as a whole. Seeking Alpha is not a licensed securities dealer, broker or US investment adviser or investment bank. Our analysts are third party authors that include both professional investors and individual investors who may not be licensed or certified by any institute or regulatory body.
STOCK WAVES: Where fundamental analysis meets technical analysis for highest-probability investment opportunities! Get leading Elliott Wave analysis from our team, along with fundamental insights and macro analysis from top author Lyn Alden Schwartzer.
“Stockwaves is my bread and butter, and that’s only catching maybe 10% of the charts they throw out! I had 7-10x+ trades with SW last year, and dozens more that were “slackers” (LOL) with “only” 3-4-5x returns. Amazing!” (Nicole)
Click here for a FREE TRIAL.
