Summary:
- Texas Instruments has been a beneficiary of pandemic trends and stimulus money, and has outperformed my pre-pandemic expectations.
- Analysts expect earnings growth to decline in 2023, and so do I.
- In this article, I examine Texas Instruments from both an earnings and a dividend investor’s perspective, and share the price I would be willing to buy.
Panuwat Dangsungnoen
Introduction
My last single-stock coverage of Texas Instruments (NASDAQ:TXN) was all the way back in 2019. The article was part of a series I wrote on “Sentiment Cycles”, and I judged Texas Instruments was a “Sell” based on its valuation at the time. That series contained around 40 articles on different high-quality, yet overvalued, stocks. While the vast majority of those stocks fell at least -20% after my warning articles, Texas Instruments was one that bucked the trend and performed better than expected.
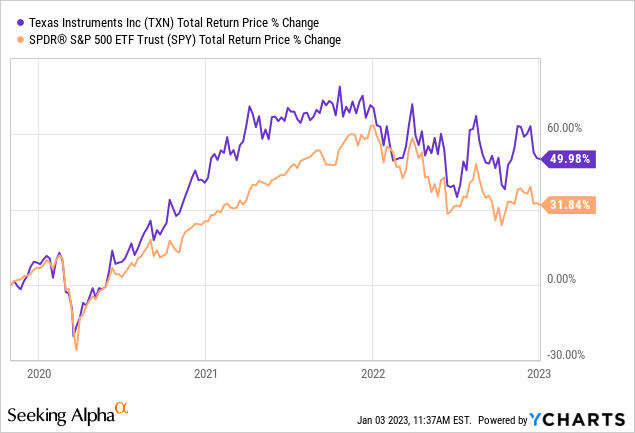
Texas Instruments has produced pretty good total returns and also outperformed the S&P 500 over this time period. It’s perfectly normal for about 1 in 5 stocks I expect to underperform over the medium term to actually outperform. So, in that sense, TXN isn’t much of an outlier. But when an outlier occurs I like to examine them more closely because sometimes doing so can reveal holes in my valuation system, which if filled, could potentially improve my performance in the future.
In Texas Instruments’ case, I think it threaded the needle of unusual COVID circumstances particularly well, similar to the way that Apple (AAPL) did over this period. After the initial panic period of March 2020, low interest rates, and increased demand for electronics, helped boost TXN’s earnings even as other parts of the economy were hurt. Then, in 2021, a massive boost in government stimulus money provided another boost for demand and earnings. In 2022, a lot of that stimulus money was still floating around the economy and there was still some backlog of demand, so earnings held up decently, rather than quickly reversing. So, as a business, based on earnings growth, TXN performed better than expected.
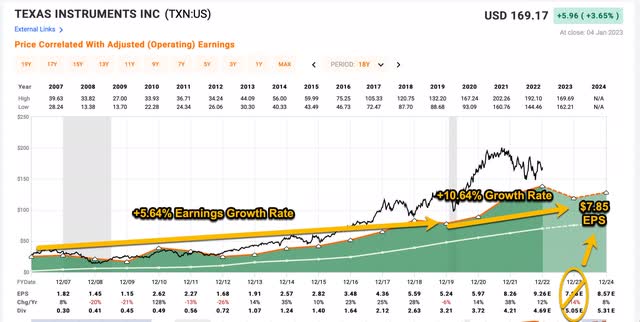
To put this into perspective, Texas Instruments’ annual earnings growth rate, while controlling for buybacks, during the 3 years of 2020, 2021, and 2022 was about +19.58%. In my 2019 TXN article, I calculated the annual earnings growth rate (again, adjusted for buybacks) from 2007-2019 at +5.64%. Both of those periods contained an “official” recession, though, for obvious reasons I don’t really count the 2020 recession when it comes to many stock valuations because it was so unusual. So, we have a case here where Texas Instruments broke with its historical earnings growth trend and performed better than expected. (Obviously, when I was writing in October of 2019, I had no clue COVID was coming or what the response would be.)
Stimulus aside, I also think Texas Instruments’ stock success also has to do with the cross-section of investors it has been able to attract. Because TXN is a technology company, the stock can be viewed as a growth stock, but because they have a well-known brand name among the older generations and they have paid continuous and steady dividends for many years, the stock is also popular with many dividend investors and retirees as well.
Much like Apple, TXN has had the best of both worlds in recent years when it comes to attracting shareholders. Additionally, as I will show in a moment here, TXN’s earnings, while they are moderately cyclical, aren’t deeply cyclical, so they have a lower beta than many semiconductor or technology stocks. This makes them fairly easy to evaluate compared to a stock like Micron (MU) or AMD (AMD).
Long-time readers of mine know that I don’t usually write a whole lot about dividends in my articles because I think that most of the time earnings are more important for steady-earning businesses like TXN. And that remains true for TXN. However, at the right price, I think TXN could potentially be a good dividend investment as well. So, in this article, I’m going to start with my normal earnings-based “Full Cycle Analysis”, in which I will make adjustments for the recent stimulus-fueled earnings boom TXN has experienced, and then share my “Dividend Time Until Payback” analysis and see how TXN looks from purely a dividend and income standpoint.
My Valuation Method For Texas Instruments
The valuation method I use for TXN first checks to see how cyclical earnings have been historically. Once it is determined that earnings aren’t too cyclical, then I use a combination of earnings, earnings growth, and P/E mean reversion to estimate future returns based on previous earnings growth and sentiment patterns. I take those expectations and apply them 10 years into the future, and then convert the results into an expected CAGR percentage. If the expected return is high, I will buy the stock, and if it’s really low, I will often sell the stock. In this article, I will take readers through each step of this process.
Importantly, once it is established that a business has a long history of relatively stable and predictable earnings growth, it doesn’t really matter to me what the business does. If it consistently makes more money over the course of each economic cycle, that’s what I care about the most.
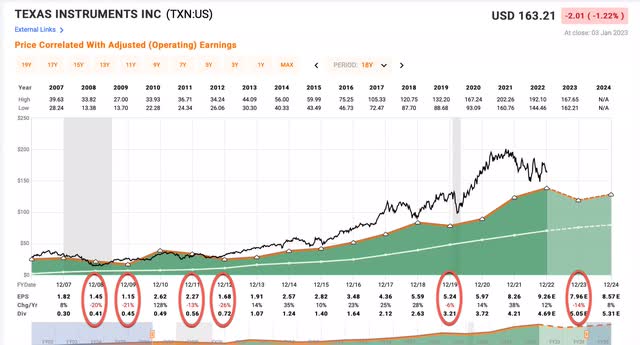
Over the past 20 years, TXN has had five years in which earnings growth was negative, and in 2023 earnings growth is expected to be negative again. The deepest decline in earnings growth was from 2007 to 2009 when earnings growth declined about -37%. The threshold I used to determine whether a business is too cyclical for an earnings-based analysis is -50%, so, while TXN has been moderately cyclical in the past, it hasn’t been so cyclical that I can’t make adjustments for those down years, and I can proceed with this style of analysis.
(However, I do think this is the type of stock where a dividend analysis can be helpful as well because the dividend is more stable than earnings. Where the dividend stands can reflect the earnings trend management has the most confidence in because usually businesses try very hard not to cut their dividend rates.)
Market Sentiment Return Expectations
In order to estimate what sort of returns we might expect over the next 10 years, let’s begin by examining what return we could expect 10 years from now if the P/E multiple were to revert to its mean from the previous economic cycle. Typically, for my sentiment mean reversion expectation, when I choose the time frame from which to calculate a stock’s average P/E, I start around the year 2015.
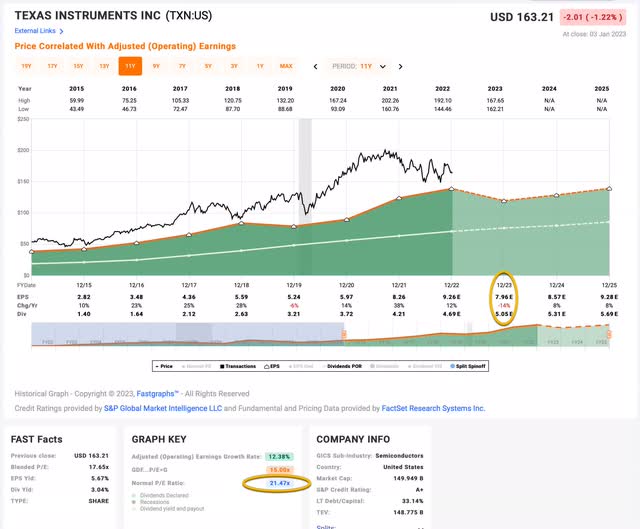
Texas Instruments’ average P/E ratio since 2015 had been 21.47 (the blue number circled in gold near the bottom of the FAST Graph). Using 2023’s forward earnings estimates of $7.96, TXN has a current P/E of 21.88. If that 21.88 P/E were to revert to the average P/E of 21.47 over the course of the next 10 years and everything else was held the same, TXN’s price would fall and it would produce a 10-Year CAGR of –0.19%.
There are a couple of aspects worth pointing out here. My selection of a time frame that starts in 2015 was during a very good period of optimism and low interest rates that produced a higher than average historical P/E for TXN (a longer time period would have produced an average P/E closer to 19). So, in that sense, the average P/E might be optimistic. However, because EPS is expected to fall next year and I pulled that lower earnings per share expectation forward for my current P/E ratio, that is perhaps a more conservative estimate than someone using the TTM P/E. In the end, I think they balance each other out to produce a reasonable estimate going forward.
Business Earnings Expectations
We previously examined what would happen if market sentiment reverted to the mean. This is entirely determined by the mood of the market and is quite often disconnected, or only loosely connected, to the performance of the actual business. In this section, we will examine the actual earnings of the business. The goal here is simple: We want to know how much money we would earn (expressed in the form of a CAGR %) over the course of 10 years if we bought the business at today’s prices and kept all of the earnings for ourselves.
There are two main components of this: the first is the earnings yield and the second is the rate at which the earnings can be expected to grow. Let’s start with the earnings yield (which is an inverted P/E ratio, so the Earnings/Price ratio). The current earnings yield is about +4.57%. The way I like to think about this is, if I bought the company’s whole business right now for $100, I would earn $4.57 per year on my investment if earnings remained the same for the next 10 years.
The next step is to estimate the company’s earnings growth during this time period. I do that by figuring out at what rate earnings grew during the last cycle and applying that rate to the next 10 years. This involves calculating the historical EPS growth rate, taking into account each year’s EPS growth or decline, and then backing out any share buybacks that occurred over that time period (because reducing shares will increase the EPS due to fewer shares).
Because we’ve had such unusual circumstances with the recent pandemic and stimulus, and because those circumstances were beneficial to TXN, I’m going make some adjustments for calculating the earnings growth rate, in order to try to account for those one-time boosts to earnings.
What I’m first going to do is see what TXN’s earnings growth rate was from 2007-2019 while taking into account buybacks and EPS growth declines. I did that in my previous TXN article and it resulted in a +5.64% full cycle earnings growth rate pre-pandemic.
Because stimulus money has created a one-time boost in earnings, but will also still be floating around the economy, contributing to our recent inflation, for the years 2020-2023, I will add an additional 5% per year to TXN’s ex-stimulus earnings growth rate to see where earnings should be at the end of 2023 after the stimulus is done contributing to growth, but still moving around the economy. So for this period, I will assume that the pandemic didn’t happen and I will assume TXN’s earnings would have grown at a +10.64% rate for four years from 2020 through 2023.
What I’ve estimated above is what TXN’s 2023 earnings would be without stimulus money directly boosting earnings from the previous year, but also accounting for the stimulus money still being in the economy and producing inflation. When I do that, I get a slightly lower EPS expectation for 2023 of $7.85, but compared to a lot of stocks I’ve made this adjustment for, it’s actually pretty close to what analysts are expecting now.
Next, I’ll apply that growth rate to current earnings, looking forward 10 years in order to get a final 10-year CAGR estimate. The way I think about this is, if I bought TXN’s whole business for $100, it would pay me back $4.57 plus +5.64% growth the first year after 2023, and that amount would grow at +5.64% per year for 10 years after that. (I used the long-term historical growth rate here since that is what I expect it to revert to on average.
And I’m pulling forward a whole year’s worth of earnings to be generous.) I want to know how much money I would have in total at the end of 10 years on my $100 investment, which I calculate to be about $164.38 (including the original $100). When I plug that growth into a CAGR calculator, that translates to a +5.10% 10-year CAGR estimate for the expected business earnings returns.
10-Year, Full-Cycle CAGR Estimate
Potential future returns can come from two main places: Market sentiment returns or business earnings returns. If we assume that market sentiment reverts to the mean from the last cycle over the next 10 years for TXN, it will produce a -0.19% CAGR. If the earnings yield and growth are similar to the last cycle, the company should produce somewhere around a +5.10% 10-year CAGR. If we put the two together, we get an expected 10-year, full-cycle CAGR of +4.91% at today’s price.
My Buy/Sell/Hold range for this category of stocks is: Above a 12% CAGR is a Buy, below a 4% expected CAGR is a Sell, and in between 4% and 12% is a Hold. TXN’s expected +4.91% makes the stock a “Hold” at today’s price, even though it’s likely a little overvalued.
The price at which TXN would cross by “Buy” threshold is $106.00, which is about -37% lower than where it trades today. This price would contain a margin of safety and would be likely to produce market-beating returns over the medium term.
Next, I’m going to examine TXN from strictly a dividend perspective and see what sort of buy price that approach produces.
Dividend Time Until Payback Analysis
What follows in this section is my standard explanation of the Dividend Time Until Payback analysis and how it works:
When it comes to the vast majority of individual stocks, risk increases with time. This situation is different for major stock indexes, where the longer one holds a major index like the S&P 500, the more likely it is that their investment will succeed and produce positive returns. Many investors do not understand this very important distinction. The reason risk increases with time for individual stocks is because it becomes more difficult to predict the future, the farther out in time we go.
Predicting Intel’s (INTC) earnings with some degree of confidence over the next few quarters, for example, is much easier than predicting their earnings 20 years into the future. This fundamental fact of 99% of individual stocks is rarely, if ever, taken into account with traditional analysis like a DCF or dividend discount model, or most other models of dividend valuation. But it should be.
Over the past 5-10 years, because we have had a large number of baby boomers retiring from the workforce, combined with low interest rates on bonds, dividend investing has become very popular. An additional appeal of dividends is that they are relatively easy to understand. The dividend yields are usually clearly posted right along with the stock prices on most financial websites. Theoretically, all an investor needs to do is find a high-quality business, look at the dividend yield and historical dividend growth rate, and after doing a little math, they can estimate their future income from the stock. These factors help explain the huge boom in dividend growth investing over the past decade.
In my view, when it comes to income investing, we have a very popular investing strategy that investors have adopted for good reasons, but for which there is a very big danger that typically goes unacknowledged. That danger is the rising risk of business disruption as time progresses. The central issue here is that as stock prices on dividend stocks rise due to their popularity, the dividend yields fall.
What I set out to do with the form of analysis I will share in this article is to integrate the time risk into the analysis. And the way I have done that is to frame the valuation question in terms of how long it is likely to take an investor to earn an amount equal to their investment in a stock back, strictly from dividends and dividend growth over time. In other words, if you invest $100 into a stock, what I want to know is how long it will take to earn $100 back only from the dividends. I call this measurement “Dividend Time Until Payback”.
Whether a dividend stock is a good value or not is then based on how far out an investor thinks they can forecast into the future and what they expect to earn in dividends. The time risk will be subjective for each investor and might vary from stock to stock. But, my view is that for most reasonably high-quality stocks like those in the S&P 500 index, I can probably do a good job forecasting out 10 years into the future, so if I can earn my money back in that amount of time, then it’s likely to be a good dividend investment including time risk into the equation.
On the high end, other than maybe Berkshire Hathaway (BRK.A) (BRK.B), I don’t feel confident predicting the future of any individual stock 20 years into the future or more. So, any dividend stock that looks to take more time than that to pay me back an amount equal to my investment is too risky for me because the risk of disruption, competition, or changing consumer demand over the course of 20 years is too high.
And in between 10 and 20 years is a range of payback periods where an investor might be able to make the case of making small adjustments for individual circumstances of each business depending on their predictability. But I think it’s fair to say any dividend stock that takes over 15 years to pay back an amount equal to its investment probably isn’t a “buy”, but perhaps, depending on other factors (like prevailing interest rates, inflation expectations, stability of the industry, etc.), individual cases can be made for those stocks that fall in the 11-14 years range.
Putting all this together, I think it’s fair to create a valuation range using dividend time until payback where 10 years or under is a “Buy”, 11-14 years is a fairly valued “Hold”, 15-19 years is a “Hold”, but overvalued, and 20 years and over is perhaps a “Sell” if there are better alternatives that can be found in the market.
Estimating Dividend Yield, and Dividend Growth
In order to estimate how long it would take to earn our investment amount back via dividends, we first need to estimate what the starting dividend yield is, and then also estimate what the dividend growth rate is likely to be. Since most good companies’ dividends often rise year over year, I pull forward dividends expected for the current year rather than use the trailing twelve-month dividends.
Texas Instruments expected dividend for 2023 is $5.05 per share. I am going to be generous and pull that forward, so that will be the base from which our dividend grows. Texas Instruments’ dividend payout ratio is right around 50%, which is the cut-off for how I estimate dividend growth rates. If the payout ratio is less than 50%, I usually average the earnings growth rate and the dividend growth rate together (because long-term dividends cannot exceed earnings), and if the payout ratio is more than 50%, then I just use the earnings growth rate. I’m going to be generous with TXN in this case, again, and average the earnings growth rate and dividend growth rate together.
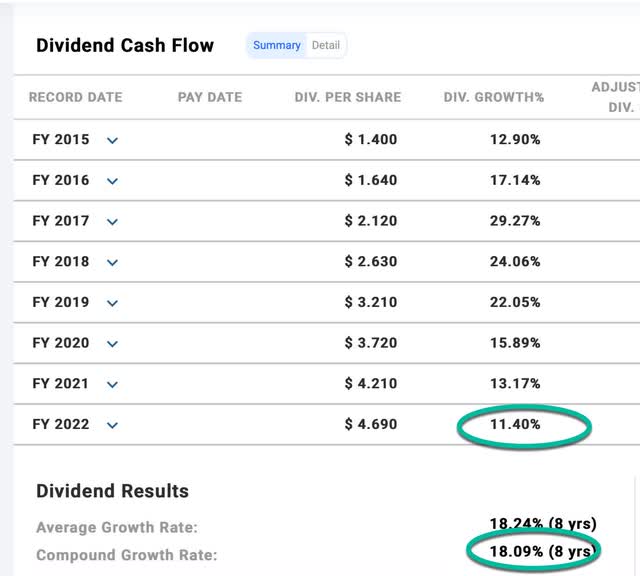
Since 2015 the compound dividend growth rate has been +18.09%. When I average that with the expected future earnings growth rate of +5.64%, I get an expected average dividend growth rate of +11.86% going forward, and that is what I will assume for my dividend payback method. (It’s worth noting that is right in line with 2022’s dividend growth rate circled in green above.)
So, we will start with a base of $5.05 and it will grow at an +11.86% rate, and we what to know how long it would take for that income to produce $100. I currently have TXN’s dividends crossing that threshold after about 14 years. Based on the framework I described earlier that would put TXN on the high end of what I would call “fair value”, which is a similar valuation to my earning-based analysis.
TXN would cross my 10-year dividend payback threshold and become a dividend “Buy” if the price fell to $97 per share. This is a little lower than the $106.00 threshold in my earnings-based analysis, but right in the same ballpark.
Conclusion
Texas Instruments stock is a little overvalued currently, but not overvalued enough to warrant a “Sell” rating in either one of my analyses. If an investor’s goal is to get returns that are both good on an absolute basis and that will also likely outperform the S&P 500, buying Texas Instruments stock in the range of $97-$106.00 during the next 12 months has a high likelihood of producing those results, and I would probably be a buyer myself at those levels unless earnings come in lower than my estimated $7.85 per share this year.
Disclosure: I/we have a beneficial long position in the shares of MU, AMD, BRK.B either through stock ownership, options, or other derivatives. I wrote this article myself, and it expresses my own opinions. I am not receiving compensation for it (other than from Seeking Alpha). I have no business relationship with any company whose stock is mentioned in this article.
If you have found my strategies interesting, useful, or profitable, consider supporting my continued research by joining the Cyclical Investor’s Club. It’s only $30/month, and it’s where I share my latest research and exclusive small-and-midcap ideas. Two-week trials are free.

