Summary:
- Texas Instruments has experienced strong share growth over the past five years, but its upward trajectory has slowed recently.
- The company holds a significant market share in the semiconductor industry and has solid fundamentals, including consistent revenue growth and high profitability.
- Texas Instruments faces competition from other chip makers and is currently trading at a premium based on valuation metrics, suggesting limited room for further growth.

JHVEPhoto/iStock Editorial via Getty Images
Investment Thesis
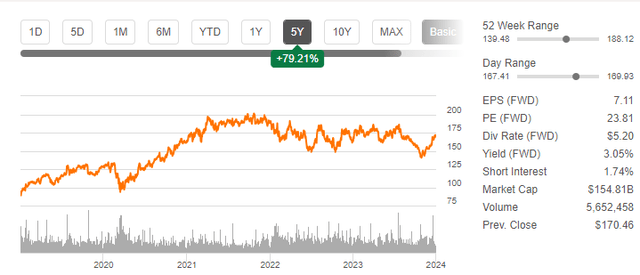
Texas Instruments Incorporated (NASDAQ:TXN) has been on a strong upward trajectory over the last five years, gaining about 79.21%.
Seeking Alpha
However, the company’s upward trajectory has slowed over time, as evidenced by a 4.34% gain in the last three years and a 3.71% gain in the last year, indicating that the company may have reached the end of its run and may be facing a reversal. From a technical standpoint, I find the stock to be in a consolidation phase, which offers very few opportunities. From relative valuation metrics, TXN is not a good investment opportunity at the moment with most of its key valuation metrics trading at a premium relative to sector medians. Given this background, I recommend holding this stock until it gets out of its consolidation phase.
TXN Solid Fundamentals
As of Q3 2023, TXN is one of the leading semiconductor companies in terms of market share. It holds a 10.99% market share in the semiconductor industry, which is higher than the majority of its competitors, including Analog Devices (8.39%), Broadcom (6.96%), and Microchip Technology (6.96%). It also dominates the analog chip segment, with a 22.55% market share, followed by Qualcomm (20.94%) and Broadcom (2.96%). In my opinion, its market share reflects its diverse product portfolio, customer base, and ability to innovate.
In my view, TXN has leveraged its impressive market share position and managed to record very solid fundamentals right from revenue growth, profitability, and dividend, which I believe have been the driving force behind its share growth over the last five years. Below are the highlights of its fundamentals.
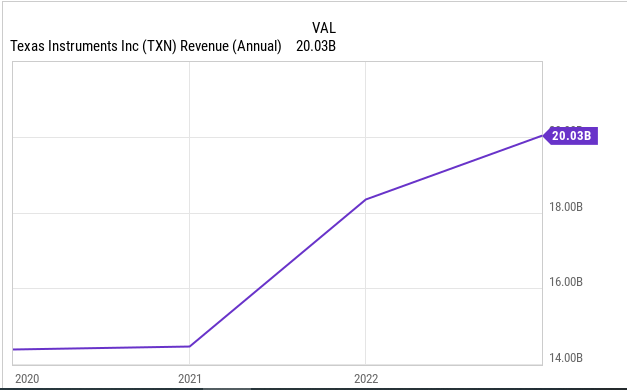
Revenue: TXN has a consistent record of revenue growth over the last five years. Its revenue is diversified across different markets, such as industrial, automotive, personal electronics, and communications equipment, which I believe reduces its exposure to cyclical fluctuations and increases its resilience to demand shocks.
YCharts
Profitability: TXN’s net profit margin is 39.21%%, reflecting its operational efficiency and pricing power. In addition, the company has a high return on equity of 62.69%, indicating its ability to generate value for its shareholders. Its profitability is bolstered by its in-house manufacturing capabilities, which give it greater control over costs and quality, as well as its emphasis on high-performance analog and embedded products, which have higher margins and longer life cycles than other types of chips.
YCharts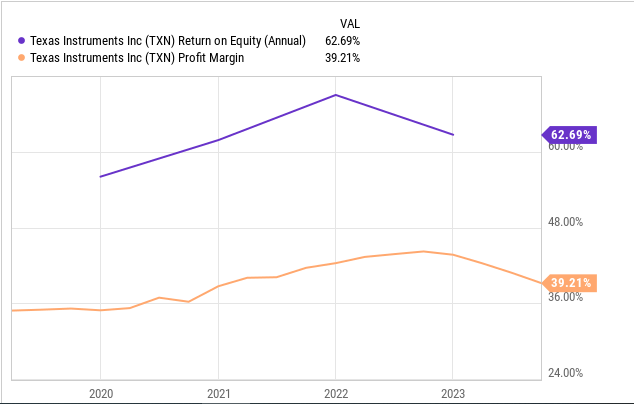
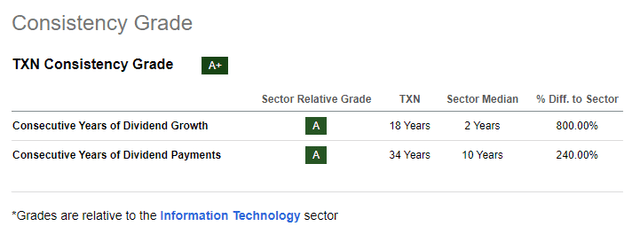
Dividends: The company has a long history of paying and increasing dividends to its shareholders, something I believe reflects its confidence in its cash flow generation and growth prospects. It has also raised its dividend for 18 consecutive years, compared to the sector median of 2 years, and currently pays an annual dividend of $5.20 per share, yielding 3.05%.
Seeking Alpha
Furthermore, the company returns capital to its shareholders through share buybacks, underscoring the management’s commitment to returning capital to shareholders. Although the stock has shown strong fundamentals over the last five years, it has dropped slightly in 2023 due to supply chain disruptions, which have seen the company’s quarterly revenue and net income decline compared to 2022 figures, resulting in a lower ROE and net income margin. Regardless, the overall conclusion is that the company’s fundamentals are strong.
TXN vs. Competitors: A Comparative Analysis
In my view, this company has strong fundamentals and growth potential given its large market share and diversified portfolio. However, it also faces competition from other chip makers, such as Analog Devices (ADI), Intel (INTC), Micron Technology (MU), and Broadcom (AVGO), among others. Here are some of the key aspects of how TXN compares to its competitors:
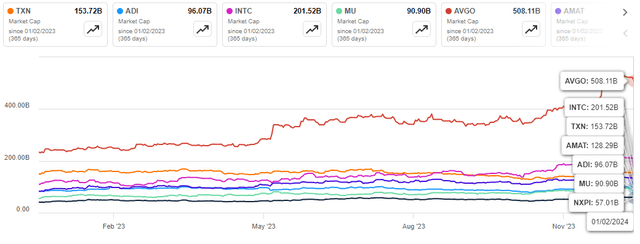
- TXN has a market cap of $153.72 billion, which is higher than most of its competitors, except for INTC ($212.91 billion) and AVGO ($508.11 billion). This indicates that TXN has a larger size and scale in the industry, and can leverage its resources and capabilities to gain a competitive edge.
Seeking Alpha
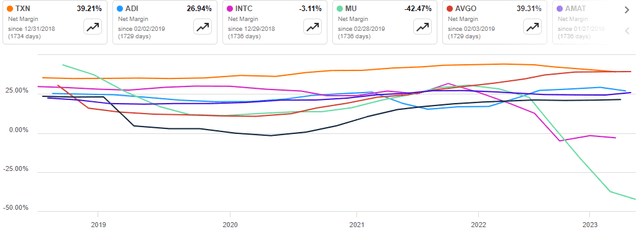
- Profit margin: TXN has a high net profit margin of 39.21%, which is higher than all of its competitors, except for AVGO (39.31%). This reflects TXN’s operational efficiency and pricing power, as well as its focus on high-performance analog and embedded products, which have higher margins and longer life cycles than other chips.
Seeking Alpha
- Dividend yield: TXN has a dividend yield of 3.05%, which is higher than all of its competitors listed above. This indicates that it is a reliable and attractive dividend payer, and returns capital to its shareholders through both dividends and share buybacks.
In summary, TXN is a competitive and successful semiconductor company, with a large market cap, high-profit margin, and attractive dividend yield. However, it also faces competition from other chip makers, especially in terms of revenue size, product diversity, and market share. It needs to continue to innovate and invest in its core competencies, as well as explore new opportunities and markets, to maintain and enhance its competitive position in the industry.
Valuation And Technical Analysis
In this section, I will cover the valuation of TXN based on relative valuation metrics, consensus estimates, and my technical analysis. First off, it has a trailing P/E ratio of 22.09 and a forward P/E ratio of 24.18, which are both slightly lower than sector averages of 27.33 and 28.90 respectively. This suggests that TXN is almost trading at its fair value based on its earnings potential.
It also has a high P/S ratio of 8.54, which is higher than the sector average of 3.12. This indicates that TXN is overvalued based on its revenue generation. Similarly, it has a high P/B ratio of 9.31, which is higher than the sector average of 3.26. This implies that TXN is overvalued based on its book value or net assets.
Another way to measure the valuation of TXN is to use enterprise value multiples, which take into account the debt and cash levels of the company. It has an EV/EBITDA ratio of 17.75 which higher than the sector average of 16.82. This means that TXN is overvalued based on its operating cash flow.
Based on this analysis, TXN appears to be trading at a premium to the majority of its valuation metrics. This implies that the stock’s valuation has very little room to grow. To support this, the average 12-month price target from 20 analysts is $170.1, which implies a potential upside of about 0.49%.
I also estimated the company’s fair value using Gordon’s growth model given the formula below.
P = D1 / (k – g),
Where P is the fair value of the stock, D1 is the expected annual dividend per share for the next year, k is the required rate of return, and g is the dividend growth rate. Here is the model output and the assumptions.
Authors’ Computation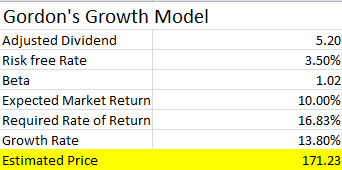
TXN has a fair value of $171.23 based on my model output, which translates to a 2.7% upside potential. In my model, I used an adjusted dividend of $5.20 which is the company’s forward dividend. For the risk-free rate, I assumed a rate of 3.5%, which is slightly lower than the 10-year US treasury note rate of 3.91%, which is a proxy because a long-term government note is considered risk-free because it has a very low probability of default and is backed by the government’s full faith and credit. According to Seeking Alpha, the stock’s beta is 1.02. For its expected market return, I used 10%, which is slightly below its 3-year total return of 11.57%. Given this justification and the model’s output, it is very clear that TXN has a very minimal upside and therefore not a good investment at the moment.
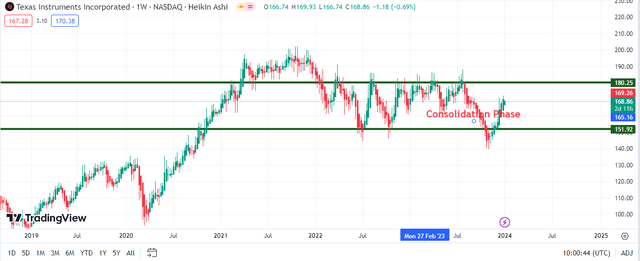
Further, based on my technical analysis, TXN appears to have entered a consolidation phase where there are minimal opportunities. Since March 2022, the stock has been trading with a narrow range between about $151.92 and about $180.25, the consolidation phase.
Author’s Analysis On Trading View
With this consolidation phase, I tend to believe the stock has reached its peak where a reversal is likely or another break out due to significant catalysts can occur. For this reason, my target prices and decisions would be as follows;
- Buy: I would be this stock if it breaks above the upper level ($180.25) of the consolidation phase, backed with a strong growth catalyst or news. Maybe, a new product launch with a tremendous market potential or a merger and acquisition.
- Sell: I would take a profit if the shares break below the lower level ($151.92) of the consolidation phase as this would be a sign that the stock is about to dip and reenter the stock at about $129 which is its strong support zone for the last 5 years, or when a stronger growth catalyst such as a merge and acquisition or a product launch.
Bottom Line
TXN is a great company with strong fundamentals and a sizable market share, but its strong 5-year share growth appears to have nearly, if not completely, exhausted its upside potential. The company appears to be in a consolidation phase, and a break-out from the phase, depending on market conditions and company news, would signal the start of a new rally. With the company trading at a premium based on the majority of relative valuation metrics, I recommend holding this stock until it breaks out of the consolidation face.
Analyst’s Disclosure: I/we have no stock, option or similar derivative position in any of the companies mentioned, and no plans to initiate any such positions within the next 72 hours. I wrote this article myself, and it expresses my own opinions. I am not receiving compensation for it (other than from Seeking Alpha). I have no business relationship with any company whose stock is mentioned in this article.
Seeking Alpha’s Disclosure: Past performance is no guarantee of future results. No recommendation or advice is being given as to whether any investment is suitable for a particular investor. Any views or opinions expressed above may not reflect those of Seeking Alpha as a whole. Seeking Alpha is not a licensed securities dealer, broker or US investment adviser or investment bank. Our analysts are third party authors that include both professional investors and individual investors who may not be licensed or certified by any institute or regulatory body.
