Summary:
- I assigned Texas Instruments stock a Hold rating in January 2023 as I didn’t think it was time to be bullish. TXN has underperformed the S&P 500 significantly since then.
- The company’s second-quarter earnings led to further weakness initially. But, strong buying support has underpinned its long-term uptrend.
- The company is undergoing near-term margin challenges while navigating downstream inventory burn. Despite that, analysts’ estimates suggest a more robust FY24-25 ahead.
- I argue why the market has discounted TXN’s execution risks through FY25. Moreover, recent robust buying support has bolstered my confidence that the worst is likely over.
- That said, it’s time for me to turn bullish on TXN. Dip buyers should consider buying its recent weakness before other investors return.
da-kuk
Texas Instruments (NASDAQ:TXN) has underperformed the S&P 500 (SPX) (SPY) since my Hold rating in January 2023, as I noted TXN’s premium valuation and price action wasn’t constructive enough to be bullish.
It has also significantly underperformed its semiconductor peers (SOXX) since TXN/SOXX topped out in October 2022, as investors focused on Texas Instruments’ leading edge semi peers.
The leading analog semiconductor company’s second-quarter or FQ2 earnings release in late July led to further weakness post-earnings. However, selling pressure didn’t intensify, as the stock of the wide economic moat semiconductor bellwether attracted robust buying sentiments, undergirding its long-term uptrend.
Despite that, the lack of upward momentum likely caused some semi-investors to rotate their exposure to TXN’s peers exposed to the AI hype cycle. Leading design peers such as NVIDIA (NVDA) and AMD (AMD) have benefited markedly since they bottomed out in late 2022/early 2023.
Furthermore, the slow economic recovery in China and Europe has likely held back the downstream recovery for Texas Instruments as customers continue to burn through their inventory. Management’s commentary suggests the headwinds could continue, although the automotive segment outperformed its expectations.
Notwithstanding auto’s bright spot, weakness was observed in industrial, enterprise, and consumer markets. Despite that, I assessed that management seems confident in continuing its capacity expansion, even though it anticipated near-term margin headwinds. Given Texas Instruments’ robust business model with relatively solid profitability, I assessed that management is taking a long-term stance. It has demonstrated its ability to build capacity ahead of time, leveraging on its significant scale to win market share and outperform expectations over time.
As such, I believe the near-term margin headwinds are likely transitory, as its free cash flow or FCF comes under pressure, worsened by topline growth challenges and inventory build. Despite that, TXN remains above the lows it formed in October 2022, suggesting investors aren’t expecting things to be worse than they were. In other words, I assessed that the worst could be over, allowing high-conviction investors a fantastic opportunity to add exposure before more buyers return.
Revised analysts’ estimates suggest a further decline in the company’s adjusted EPS through the first quarter of FY24. However, Texas Instruments is projected to post a 7.4% YoY growth in its adjusted EPS for the full year of 2024. Therefore, I gleaned that recent buyers remain confident of the company’s potential recovery, with the economy not expected to fall into a hard landing.
Notwithstanding my optimism, TXN’s valuation isn’t cheap, considering its recent challenges. Accordingly, TXN last traded at a forward EBITDA multiple of 17x, well ahead of its 10Y average of 14.5x. Seeking Alpha Quant’s “C-” valuation grade corroborates my observation, indicating TXN is, at best, fairly valued.
Despite that, I believe the underperformance of TXN/SOXX is well-primed to reverse, supported by robust buying support since its Q2 release. In other words, the market is likely pricing in a further recovery through FY25 as Texas Instruments’ adjusted EPS is projected to recover an additional 11%. Considering TXN’s FY25 EBITDA multiple of 13.4x, the market has likely discounted its execution risks adequately, suggesting it has not fully priced in the recovery.
TXN price chart (weekly) (TradingView)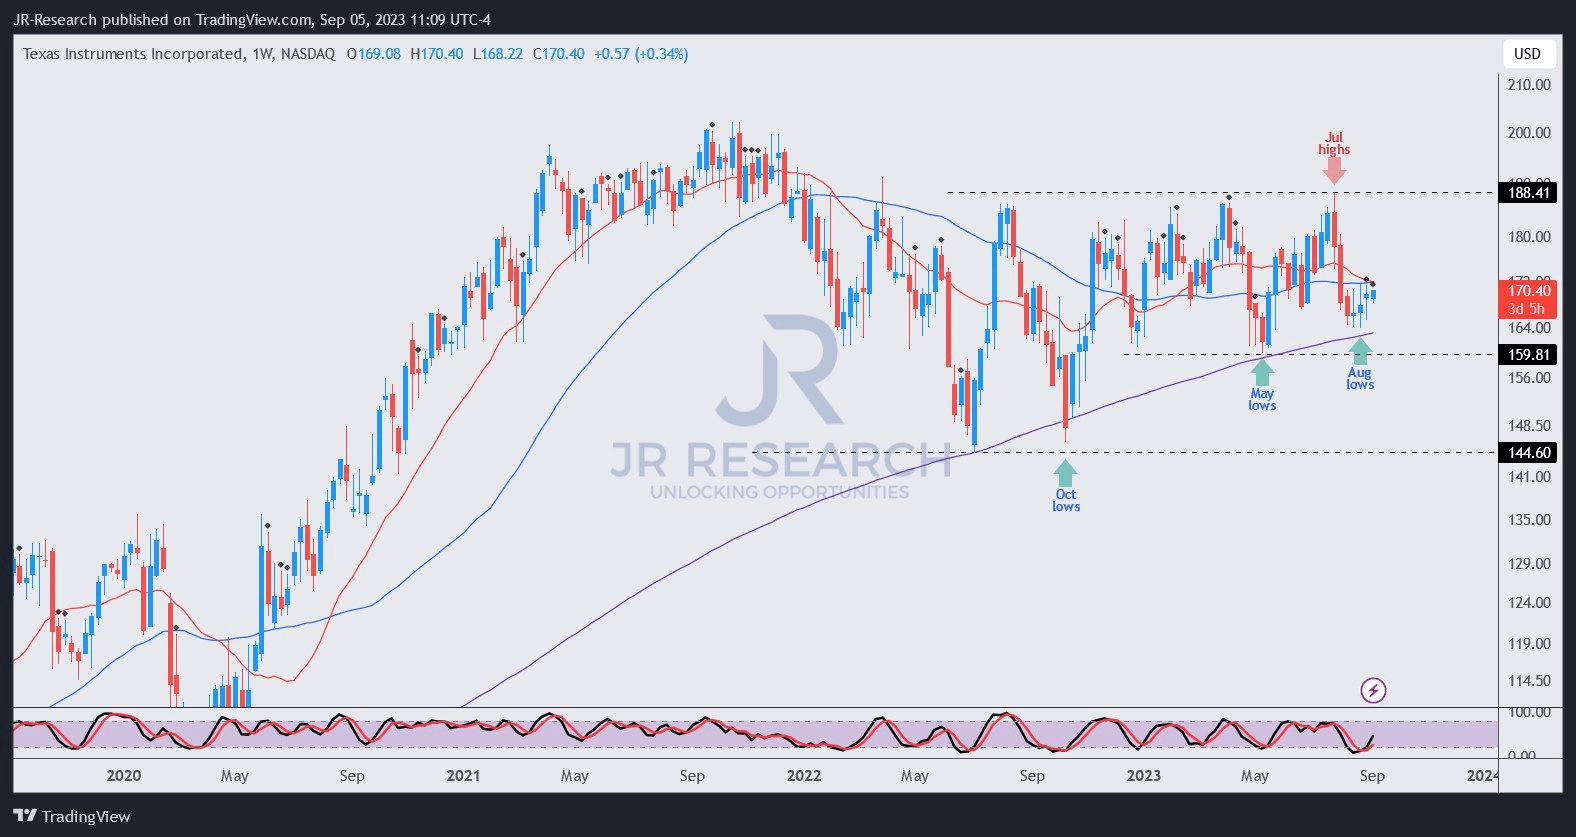
As seen above, TXN has already bottomed out from July to October 2022 and has not looked back.
Every significant dip since then was defended by buyers robustly, holding above the critical 200-week moving average or MA (purple line).
As such, I believe it’s pretty clear that the TXN has reversed from its downtrend bias, although it’s still consolidating before a potential uptrend resumption from here.
The $188 level remains a significant resistance zone, which I don’t expect to be breached in the near term. However, I assessed that TXN’s August lows seem robust, predicated against the critical support level of $160 formed in May 2023.
With that in mind, I’m ready to upgrade my thesis on TXN. Dip buyers should capitalize on its early recovery to build their positions before momentum investors return subsequently.
Rating: Upgraded to Buy. Please note that a Buy rating is equivalent to a Bullish or Market Outperform rating.
Important note: Investors are reminded to do their due diligence and not rely on the information provided as financial advice. Please always apply independent thinking and note that the rating is not intended to time a specific entry/exit at the point of writing unless otherwise specified.
We Want To Hear From You
Have constructive commentary to improve our thesis? Spotted a critical gap in our view? Saw something important that we didn’t? Agree or disagree? Comment below with the aim of helping everyone in the community to learn better!
Analyst’s Disclosure: I/we have a beneficial long position in the shares of AMD, NVDA either through stock ownership, options, or other derivatives. I wrote this article myself, and it expresses my own opinions. I am not receiving compensation for it (other than from Seeking Alpha). I have no business relationship with any company whose stock is mentioned in this article.
Seeking Alpha’s Disclosure: Past performance is no guarantee of future results. No recommendation or advice is being given as to whether any investment is suitable for a particular investor. Any views or opinions expressed above may not reflect those of Seeking Alpha as a whole. Seeking Alpha is not a licensed securities dealer, broker or US investment adviser or investment bank. Our analysts are third party authors that include both professional investors and individual investors who may not be licensed or certified by any institute or regulatory body.
A Unique Price Action-based Growth Investing Service
- We believe price action is a leading indicator.
- We called the TSLA top in late 2021.
- We then picked TSLA’s bottom in December 2022.
- We updated members that the NASDAQ had long-term bearish price action signals in November 2021.
- We told members that the S&P 500 likely bottomed in October 2022.
- Members navigated the turning points of the market confidently in our service.
- Members tuned out the noise in the financial media and focused on what really matters: Price Action.
Sign up now for a Risk-Free 14-Day free trial!