
Summary:
- Texas Instruments has led the Discrete, Analog, and Optoelectronics (DAO) market until 2021.
- The company is now losing its leadership position as it lags behind its analog competitors in terms of market share and revenue growth.
- We identify the reasons for its underperformance and its competitive advantages to better determine the outlook of the company.
Sundry Photography
In our previous evaluation of Texas Instruments Incorporated (NASDAQ:TXN), we highlighted the company’s steady dividend payout ratio of 52.8%, alongside a projected continued dividend growth rate of 6%. Moreover, the company has maintained stable free cash flow generation, boasting an average FCF margin of 30.9% over the past decade. However, we also noted the company’s low growth performance over the past 10 years, as seen in the table below. With a 10-year average total revenue growth rate of merely 3.68%, Texas Instruments lags behind its leading analog competitors, falling below the industry average of 12.39%.
|
Company |
Revenue Growth (10-year Average) |
|
Monolithic Power (MPWR) |
22.56% |
|
Lattice (LSCC) |
8.29% |
|
Marvell (MRVL) |
4.93% |
|
Analog Devices (ADI) |
15.92% |
|
Broadcom (AVGO) |
30.79% |
|
Microchip (MCHP) |
16.42% |
|
TI |
3.68% |
|
NXP (NXPI) |
10.67% |
|
onsemi (ON) |
11.48% |
|
Skyworks (SWKS) |
9.68% |
|
Infineon (OTCQX:IFNNY) |
14.98% |
|
STMicro (STM) |
7.90% |
|
Renesas (OTCPK:RNECF) |
4.69% |
|
Qorvo (QRVO) |
11.43% |
|
Average |
12.39% |
Source: Seeking Alpha, Khaveen Investments
IC Insights, WSTS, Company Data, Khaveen Investments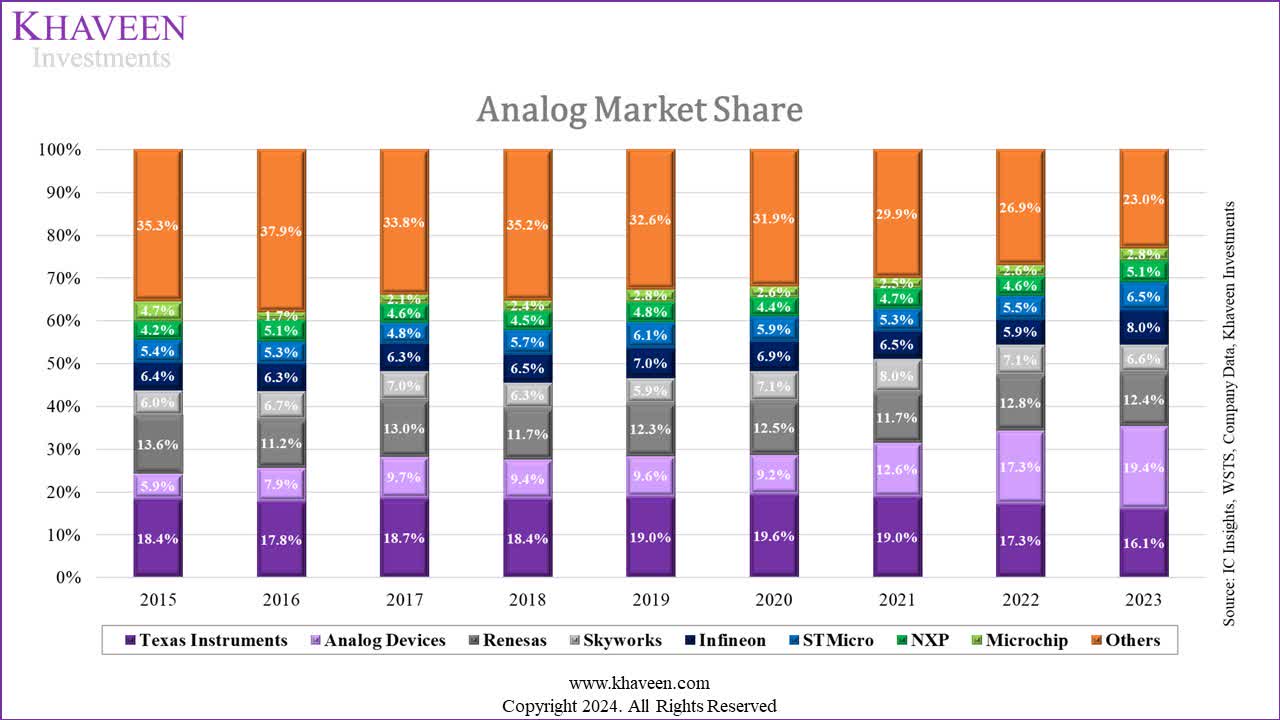
In terms of market share, TI’s share had eroded over the past 9 years from 18.4% in 2015 to 16.1% in 2023. On the other hand, some of its key competitors outperformed the company, gaining market share over the period. For example, ADI gained the most share over the period, rising from 5.9% to 19.4% by 2023, overtaking TI as the market leader, with its average growth boosted by its past acquisitions such as Maxim as covered previously. Other companies that have gained market share include Infineon, STMicro and NXP.
|
TI Revenue Breakdown ($ mln) |
2015 |
2016 |
2017 |
2018 |
2019 |
2020 |
2021 |
2022 |
2023 |
2023 |
9-Year TI Average |
9-Year Market Average |
|
Analog Revenue |
8,104 |
8,339 |
8,536 |
9,900 |
10,801 |
10,223 |
10,886 |
14,050 |
15,359 |
13,040 |
8,104 |
|
|
Growth % |
12.6% |
2.9% |
2.4% |
16.0% |
9.1% |
-5.4% |
6.5% |
29.1% |
9.3% |
-15.1% |
12.6% |
8.34% |
|
Embedded Processing Revenue |
2,740 |
2,787 |
3,023 |
3,498 |
3,554 |
2,943 |
2,570 |
3,049 |
3,261 |
3,368 |
2,740 |
|
|
Growth % |
11.8% |
1.7% |
8.5% |
15.7% |
1.6% |
-17.2% |
-12.7% |
18.6% |
7.0% |
3.3% |
11.8% |
5.5% |
|
Others |
2,201 |
1,874 |
1,811 |
1,563 |
1,429 |
1,217 |
1,005 |
1,245 |
1,408 |
1,111 |
2,201 |
|
|
Growth % |
-14.1% |
-14.9% |
-3.4% |
-13.7% |
-8.6% |
-14.8% |
-17.4% |
23.9% |
13.1% |
-21.1% |
-14.1% |
– |
|
Total |
13,045 |
13,000 |
13,370 |
14,961 |
15,784 |
14,383 |
14,461 |
18,344 |
20,028 |
17,519 |
13,045 |
|
|
Growth % |
6.9% |
-0.3% |
2.8% |
11.9% |
5.5% |
-8.9% |
0.5% |
26.9% |
9.2% |
-12.5% |
6.9% |
5.6% |
Source: Company Data, Khaveen Investments
Based on the table above, both the company’s Analog and Embedded Processing segments underperformed the analog semicon and MCU market growth, though its Analog represents its largest segment (75% of revenue). Thus, we focused on determining the reasons for TI’s underperformance in the Discrete, Analog and Optoelectronics (‘DAO’) market in this analysis.
We first broke down the DAO market into the main product categories with the market CAGR forecast, then we derived an estimate of the company’s Analog segment revenues by product categories based on market share data. For Power Semiconductors, we calculated its revenue based on its market share in power ICs, and we estimated its market share in power discrete at 2%. Moreover, for the RF market, we estimated its market share (part of Others) by Yole Development based on the midpoint of 9%. For Sensors and Optoelectronics, we estimated its share using its share of products on Digikey and Arrow Electronics as a proxy. Finally, for Discrete Semiconductors and Other Analog ICs, we calculated its revenue as the remainder of its Analog segment.
|
DAO Market |
Market Size (2022) ($ bln) |
Market Breakdown % |
TI Market Share |
TI Revenue ($ bln) |
TI Revenue Breakdown % |
Market CAGR |
|
Power Semiconductors |
60.4 |
32% |
8.8% |
5.3 |
35% |
6.30% |
|
RF |
19.2 |
10% |
9.0% |
1.7 |
11% |
12.32% |
|
Sensors |
20.4 |
11% |
4.4% |
0.89 |
6% |
10.79% |
|
Optoelectronics |
43.9 |
23% |
0.001% |
0.001 |
0.004% |
11.80% |
|
Discrete Semiconductors |
34.0 |
18% |
18.1% |
7.4 |
48% |
8.31% |
|
Other Analog ICs |
10.8 |
6% |
8.55% |
|||
|
Total |
188.66 |
100% |
15.4 |
100% |
Source: Company Data, Yole Development, Omdia, Digikey, Arrow Electronics, Market Research Reports, Khaveen Investments
Based on the breakdown above, Power Semiconductors accounted for the largest segment, representing 32% of the DAO market followed by Optoelectronics which includes LEDs, lasers and solar cells and Discrete Semiconductors including diodes, transistors and rectifiers. Furthermore, in terms of our derived estimate of the company’s breakdown based on its market share, we determined Discrete Semiconductors and Other Analog ICs represent 48% of the company’s revenue followed by Power Semiconductors. Compared to the overall DAO breakdown, the company’s exposure to Discrete Semiconductors and Other Analog ICs is twice as large as the market breakdown (48% vs 24%) while its Power Semiconductors breakdown is also slightly larger than the market breakdown (35% vs 32%) whereas RF is estimated to be in line with the market breakdown. In contrast, its exposure to Sensors and Optoelectronics is much lower, representing only 6% and 0.004% of its revenues compared to the market breakdown of 11% and 23%. Therefore, this highlights the company’s larger focus on Discrete Semiconductors and Other Analog ICs which have lower growth compared to Sensors and Optoelectronics which have higher growth, which could be attributed to its lower growth in DAO. Furthermore, we examined its product breadth and performance comparison by segments below.
Stronger Competition From ADI in Power Semiconductors
Omdia, Khaveen Investments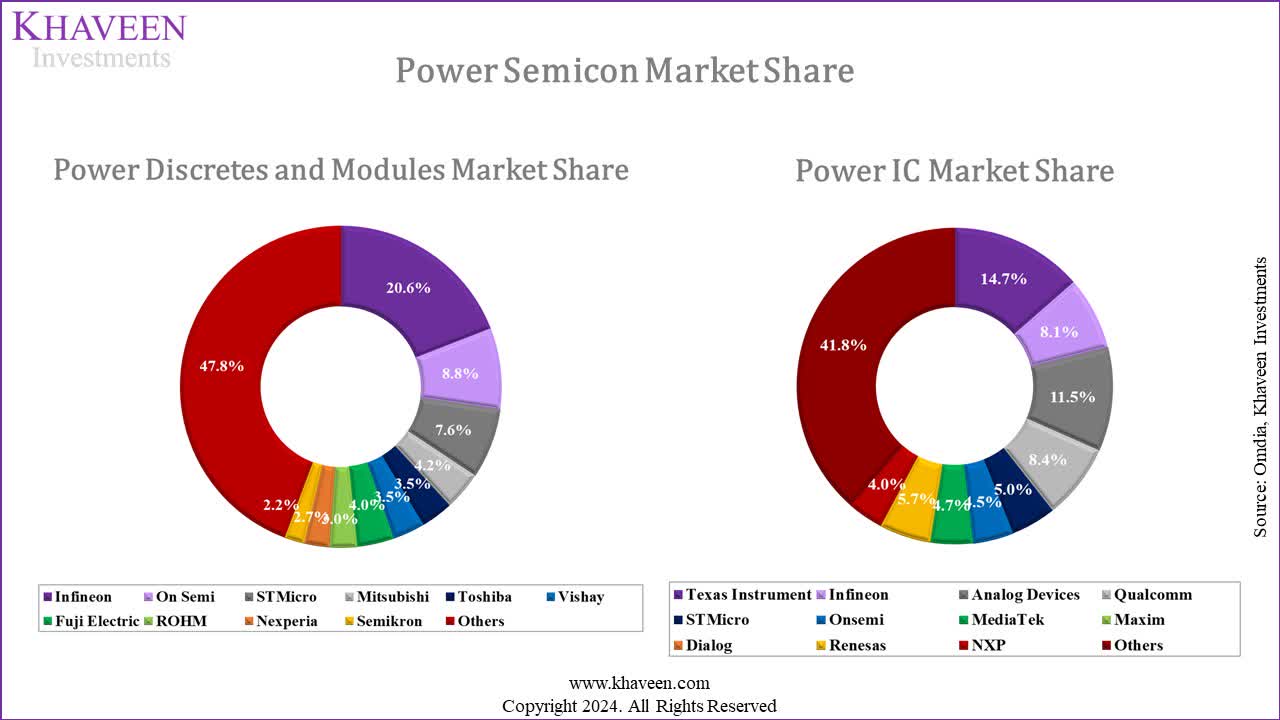
In terms of market share, TI leads the $32.2 bln Power ICs market with a 14.7% market share. However, Infineon leads the $28.1 bln Power Discrete and Modules market, while TI has less than a 2.2% market share. Many other competitors are much larger than TI in Power Discrete and Modules, highlighting TI’s greater focus and exposure to the Power ICs market.
Omdia, Khaveen Investments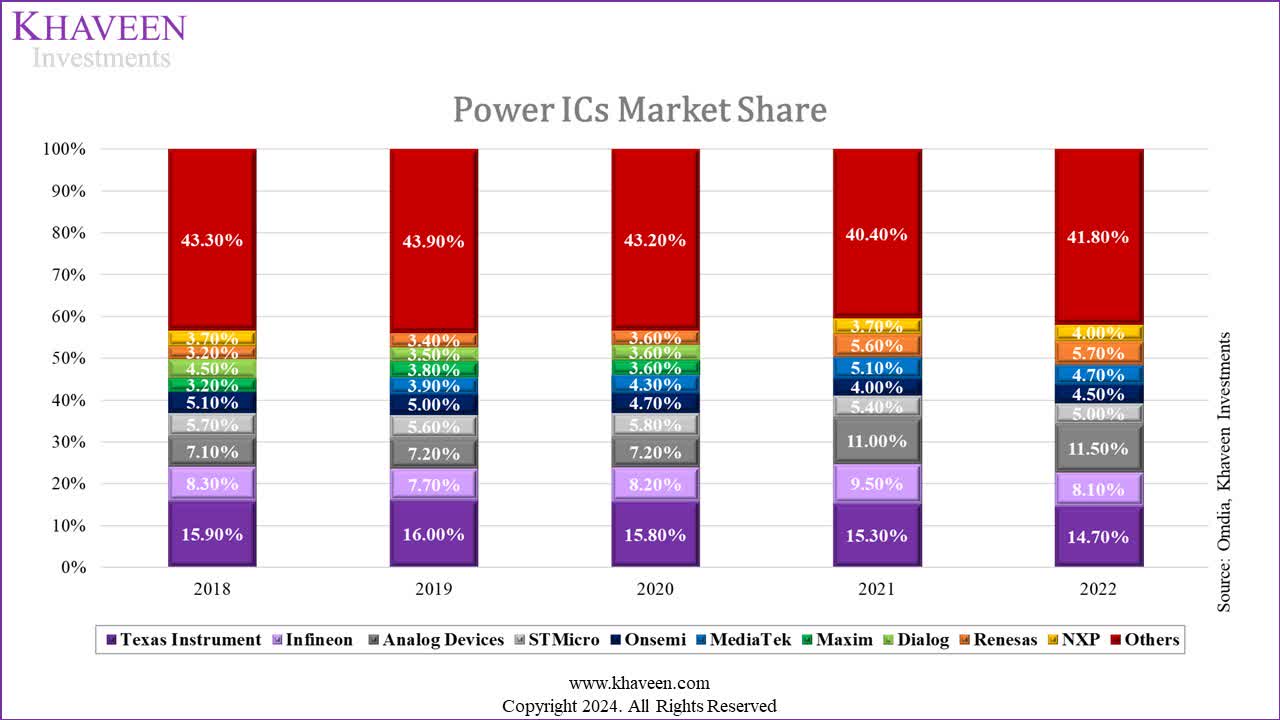
However, TI’s lead in the power ICs market has decreased slightly in the past 5 years as its market share decreased from 15.9% in 2018 to 14.7% in 2022. This is due to increasing competition within the market as competitors such as ADI had gained market share to become second following its acquisition of Maxim (3.6% market share in 2020) in 2021 and further increased to 11.5% in 2022. Additionally, smaller competitor Renesas also boosted its share with the acquisition of Dialog (3.6% market share) in 2021. However, not all companies gained market share, such as Infineon and STMicro.
|
Company |
Number of IGBT |
Max Volts |
Number of MOSFETs |
Max Volts |
Number of SiC Products |
Max Volts |
Number of PMIC |
|
onsemi |
557 |
1,500 |
4,493 |
1,700 |
89 |
1,700 |
32 |
|
Infineon |
2,480 |
6,500 |
7,615 |
2,000 |
102 |
2,000 |
56 |
|
Texas Instruments |
– |
– |
235 |
250 |
– |
– |
1,096 |
|
ADI |
– |
– |
– |
– |
– |
– |
512 |
|
Rohm (OTCPK:ROHCF) |
82 |
1,200 |
375 |
1,200 |
91 |
1,700 |
5 |
|
STMicro |
398 |
1,350 |
2,250 |
6,500 |
89 |
1,700 |
46 |
|
Average |
879 |
2,638 |
2,994 |
2,330 |
93 |
1,775 |
247 |
Source: Company Data, Arrow Electronics, Khaveen Investments
|
Company Ranking |
Number of IGBT |
Max Volts |
Number of MOSFETs |
Max Volts |
Number of SiC Products |
Max Volts |
Average Discrete Ranking |
Power IC Ranking |
Overall Ranking |
|
onsemi |
2 |
2 |
2 |
3 |
3 |
2 |
2.3 |
5 |
3.7 |
|
Infineon |
1 |
1 |
1 |
2 |
1 |
1 |
1.2 |
3 |
2.1 |
|
Texas Instruments |
5 |
5 |
5 |
5 |
5 |
5 |
5.0 |
1 |
3.0 |
|
ADI |
5 |
5 |
6 |
6 |
5 |
5 |
5.3 |
2 |
3.7 |
|
Rohm |
4 |
4 |
4 |
4 |
2 |
2 |
3.3 |
6 |
4.7 |
|
STMicro |
3 |
3 |
3 |
1 |
3 |
2 |
2.5 |
4 |
3.3 |
Source: Company Data, Arrow Electronics, Khaveen Investments
We updated our comparison of the top power semiconductors companies to compare the product breadth and performance in terms of power discrete semiconductors such as IGBTs, MOSFETs and SiC power devices as well as PMICs. Based on the table above, TI lags behind top competitors in terms of the power discrete semiconductors as competitors have more products compared to the company, led by Infineon with the largest product breadth and performance advantage in IGBT. However, we highlighted that based on market share, TI does not have much exposure to power discrete semiconductors. Instead, its focus is on power ICs as the market leader. Based on the table, TI has the highest number of PMIC products, ahead of all key competitors. Furthermore, in terms of ranking, we derived an average ranking for Discrete Power and Power ICs, with Infineon leading the Discrete Power but TI leading in Power ICs with the highest ranks. For the overall power semicon market, we derived the highest ranking for Infineon, followed by TI.
Outlook
Therefore, while its market leadership in Power ICs has eroded over the past years as competition intensified, we believe TI’s leadership currently remains supported by its product breadth advantage against competitors. However, with ADI pursuing product development in PMICs, for example, it recently launched 16 products, we expect ADI to continue pressuring TI in PMIC.
|
Patent Publications |
2014 |
2015 |
2016 |
2017 |
2018 |
2019 |
2020 |
2021 |
2022* |
Average |
|
TI |
2,497 |
2,382 |
2,442 |
2,652 |
2,491 |
3,001 |
3,488 |
2,879 |
2,601 |
|
|
Growth % |
-4.6% |
2.5% |
8.6% |
-6.1% |
20.5% |
16.2% |
-17.5% |
-9.6% |
2.8% |
|
|
ADI |
2,421 |
2,471 |
2,903 |
3,026 |
3,379 |
3,422 |
3,294 |
2,934 |
1,860 |
|
|
Growth % |
2.1% |
17.5% |
4.2% |
11.7% |
1.3% |
-3.7% |
-10.9% |
-36.6% |
3.2% |
*Data Until September
Source: Global Data, Khaveen Investments
Not only does ADI have a higher R&D spending % of revenue (13.5% vs 10.63% of revenue in 2023, but its patents growth has also been higher than TI as seen in the table above. Thus, we believe TI may continue to see some share losses amid strong competition from ADI, the second in the Power ICs market with the second largest product breadth. Based on our ranking, we determined Infineon as the best in discrete power semiconductors while TI ranks the best in power ICs but for the overall power semiconductor segment, our average ranking shows Infineon higher than TI.
More Competitive in Analog ICs
For Discrete Semiconductors and Other Analog ICs, we compiled the top companies to compare their product breadth based on the total number of products from Arrow Electronics. For Discrete Semiconductors, we examined Dipolar Transistors, RF Diodes and Thyristors groups which consisted of a total of 14 product categories whereas for analog ICs, this included Amplifiers, Electronic Switches, Data Converters, Interface, Clock and Timing, and Standard Specialty and Logic which consisted of a total of 67 products categories.
|
Discrete and Analog ICs |
Discrete |
Analog IC |
|||||||
|
Company |
Bipolar Transistor |
RF Diodes |
Thyristors |
Amplifiers |
Electronic Switches |
Data Converters |
Interface |
Clock and Timing |
Standard and Specialty Logic |
|
ADI |
29 |
1 |
14,342 |
3,573 |
14,035 |
6,471 |
1,859 |
366 |
|
|
TI |
147 |
105 |
18,155 |
3,468 |
7,108 |
8,322 |
2,148 |
29,517 |
|
|
Toshiba (OTCPK:TOSBF) |
2,113 |
1,098 |
27 |
149 |
272 |
1 |
1 |
14 |
3,004 |
|
Diodes Inc. (DIOD) |
2,060 |
3,739 |
55 |
238 |
790 |
342 |
688 |
741 |
|
|
onsemi |
4,663 |
3,090 |
164 |
1,132 |
887 |
17 |
409 |
816 |
6,992 |
|
STMicro |
707 |
1,473 |
783 |
1,943 |
94 |
40 |
342 |
189 |
1,154 |
|
NXP |
478 |
325 |
163 |
675 |
231 |
131 |
854 |
198 |
1,243 |
|
Nexperia |
2,384 |
1,227 |
46 |
1 |
514 |
28 |
59 |
5,264 |
|
|
Microchip |
2,466 |
4,547 |
77 |
1,567 |
554 |
877 |
1,330 |
1,465 |
431 |
|
Total |
15,047 |
15,605 |
1,315 |
38,202 |
10,383 |
22,209 |
18,099 |
7,436 |
48,346 |
Source: Company Data, Arrow Electronics, Khaveen Investments
Based on the table above, starting with Discrete Semiconductors, we identified diverse competitors including the group with key companies such as Toshiba, Diodes, onsemi, Nexperia and Microchip having more than a thousand products across Bipolar Transistors and RF Diodes. On the other hand, Texas Instruments’ number of products is low and is the second smallest in the table, only ahead of ADI.
However, in terms of Analog ICs, the company is much more significant, as TI leads with the highest number of products in product groups such as Amplifiers, Interface and Clock & Timing products as well as Standard and Specialty Logic. The company competes fiercely against ADI in these product groups, with ADI leading TI in Electronic Switches (TI not far behind) and Data Converters.
|
Discrete and Analog ICs |
Discrete |
Analog ICs |
|||||||||
|
Company |
Bipolar Transistor |
RF Diodes |
Thyristors |
Average Ranking |
Amplifiers |
Electronic Switches |
Data Converters |
Interface |
Clock and Timing |
Standard and Specialty Logic |
Average Ranking |
|
ADI |
9 |
9 |
9 |
9.0 |
2 |
1 |
1 |
2 |
2 |
9 |
2.8 |
|
TI |
8 |
8 |
8 |
8.0 |
1 |
2 |
2 |
1 |
1 |
1 |
1.3 |
|
Toshiba |
4 |
6 |
7 |
5.7 |
8 |
7 |
7 |
9 |
9 |
4 |
7.3 |
|
Diodes Inc |
5 |
2 |
5 |
4.0 |
7 |
4 |
8 |
6 |
5 |
7 |
6.2 |
|
onsemi |
1 |
3 |
2 |
2.0 |
5 |
3 |
6 |
5 |
4 |
2 |
4.2 |
|
STMicro |
6 |
4 |
1 |
3.7 |
3 |
9 |
5 |
6 |
7 |
6 |
6.0 |
|
NXP |
7 |
7 |
3 |
5.7 |
6 |
8 |
4 |
4 |
6 |
5 |
5.5 |
|
Nexperia |
3 |
5 |
6 |
4.7 |
9 |
6 |
8 |
8 |
8 |
3 |
7.0 |
|
Microchip |
2 |
1 |
4 |
2.3 |
4 |
5 |
3 |
3 |
3 |
8 |
4.3 |
Source: Company Data, Arrow Electronics, Khaveen Investments
We ranked the companies from our comparison table above with the highest-ranked company in each product category having the highest number of products. For Discrete Semiconductors, the best-ranked company is onsemi with an average of 2 as it leads in Bipolar Transistors and is second and third in Thyristors and RF Diodes respectively. This is followed by Microchip and STMicro as the second and third best in Discrete Semiconductors. Whereas TI is ranked as the second lowest, only ahead of ADI.
In analog ICs, TI is ranked the best overall with its top ranking in Amplifiers, Interface and Clock & Timing products as well as Standard & Specialty Logic. This is followed by ADI as the second closest competitor to TI, leading in Electronic Switches and Data Converters. Overall, we believe this highlights that TI and ADI are the two most significant companies in analog ICs with wide leads compared to the rest of the competitors, which correspond to both companies as the second and first place by analog market share respectively.
Additionally, as ADI is the fiercest competitor to TI and has overtaken it as the market leader in 2023, we believe competition from ADI in the analog ICs market could be a factor for TI’s declining position. Based on the ADI website, the company announced new product launches for various analog ICs such as A/D Converters (ADC) (1), Amplifiers (1) and Interface and Isolation (7).
Outlook
As mentioned in the intro, our derived TI’s revenue breakdown shows a heavy exposure in the Discrete Semiconductors and Other Analog ICs segment, twice larger than the market breakdown (48% vs 24%). As Discrete Semiconductors and Other Analog ICs have a lower market CAGR (weighted average of 8.4%) than our derived DAO market growth of 9.2%, we believe its underperformance in DAO could be attributed to its larger exposure to the Discrete Semiconductors and Other Analog ICs segment.
Additionally, we believe that its uncompetitiveness in discrete semiconductors, which is larger compared to the analog IC market (18% vs 6%) is also contributing to its underperformance in the DAO market. Furthermore, TI is weak in discrete semiconductors which is larger but stronger in the smaller analog ICs market. TI focuses more on Analog ICs, and we believe that while it has leading positions in several categories including Amplifiers, Interface and Clock & Timing products as well as Standard & Specialty Logic, the company faces strong competition from ADI, which has product developments with recent new product launches in some of these categories as well, expanding its portfolio. Additionally, as mentioned in the first point, we see ADI’s stronger commitment to R&D spending and higher patent growth than TI could continue to challenge TI’s market position in Analog ICs.
Lower Exposure to Remaining High Growth DAO Segments
Finally, we examined the company’s competitiveness in other remaining DAO segments including RF, Optoelectronics and Sensors.
RF
Yole Development, Khaveen Investments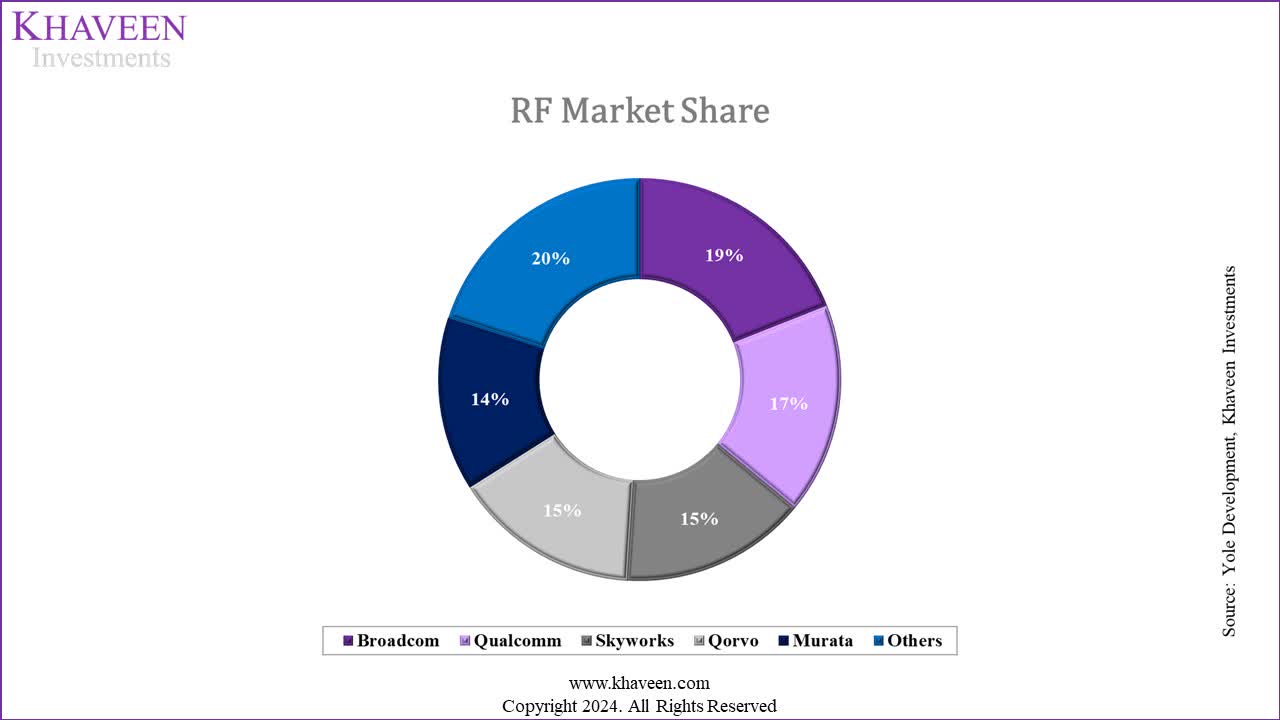
In the RF market, the top players include Broadcom, the market leader in 2022, as well as Qualcomm, Qorvo, Skyworks, Murata and Others. TI’s Analog segment includes RF products. However, the market share chart above shows the company is smaller than the top RF players, as it is included in Others.
|
Company |
Number of RF Products |
Integrated RFFE Performance (Bandwidth) |
Integrated RFFE Frequency Range |
mmWave Modules |
LNA/Filter Modules |
Power Tracker |
Antenna Tuner |
RF Transceivers |
Modem Integration |
Connectivity Modules |
|
Skyworks |
1,359 |
100 MHz |
700Mhz to 6Ghz |
No |
Yes |
Yes |
Yes |
No |
No |
Yes |
|
Qorvo |
1,185 |
100Mhz |
800Mhz to 9Ghz |
No |
Yes |
Yes |
Yes |
No |
No |
Yes |
|
Broadcom |
1,231 |
N/A |
N/A |
N/A |
N/A |
N/A |
N/A |
N/A |
N/A |
N/A |
|
Qualcomm (QCOM) |
369 |
100Mhz |
600Mhz to 7.2 Ghz |
Yes |
Yes |
Yes |
Yes |
Yes |
Yes |
Yes |
|
Murata (OTCPK:MRAAY) |
506 |
N/A |
N/A |
N/A |
N/A |
N/A |
N/A |
N/A |
N/A |
N/A |
|
Texas Instruments |
194 |
N/A |
N/A |
N/A |
N/A |
N/A |
N/A |
N/A |
N/A |
N/A |
Source: Company Data, Digikey, Khaveen Investments
In terms of RF, we updated our previous comparison of the top RF companies, and we determined that Qorvo has a performance advantage in integrated RFFE modules, boasting the highest maximum frequency among competitors like Skyworks and Qualcomm. However, Qualcomm’s modules offer more features. In addition, we compared the product breadth of the number of RF products where TI has the lowest number of RF products compared to competitors, which highlights that TI does not focus on the RF market. Overall, we believe TI’s smallest product breadth among competitors indicates a factor for its competitive disadvantage against larger RF players.
Sensors
In Sensors, we derived the company’s market share by estimating its share of sensing products on Arrow Electronics, which is only 4%, indicating its lack of competitiveness in the sensor market. To compare the company against competitors in Sensors, we compiled the total number of sensor products across 29 product categories and grouped them into 5 main categories which are Motion, Environmental, Pressure, Fluid, Detection and Power & Control.
|
Company |
Motion Sensors |
Environmental Sensors |
Pressure Sensors |
Fluid Sensors |
Detection Sensors |
Power and Control |
Total |
|
Honeywell (HON) |
423 |
1,452 |
3,851 |
114 |
530 |
222 |
6,592 |
|
Omron (OTCPK:OMRNY) |
6 |
19 |
14 |
47 |
482 |
94 |
662 |
|
TDK (OTCPK:TTDKY) |
7 |
2,776 |
148 |
2 |
7 |
12 |
2,952 |
|
Vishay (VSH) |
97 |
1,371 |
0 |
0 |
72 |
0 |
1,540 |
|
Amphenol (APH) |
72 |
1,271 |
671 |
0 |
27 |
91 |
2,132 |
|
TE Connectivity (TEL) |
518 |
1,305 |
1,100 |
195 |
409 |
58 |
3,585 |
|
STMicro |
192 |
43 |
35 |
0 |
293 |
0 |
563 |
|
Analog Devices |
284 |
845 |
0 |
2 |
413 |
70 |
1,614 |
|
Texas Instruments |
478 |
1,073 |
0 |
0 |
245 |
160 |
1,956 |
|
Melexis (OTCPK:MLXSF) |
1,596 |
65 |
83 |
0 |
78 |
274 |
2,096 |
|
Total |
3,673 |
10,224 |
5,902 |
360 |
2,556 |
2,311 |
Source: Company Data, Arrow Electronics, Khaveen Investments
Based on the table above, TI has a much smaller portfolio breadth compared to competitors with only 1,956 sensor products. In contrast, Honeywell has the largest portfolio breadth, followed by TE Connectivity. Overall, we believe TI’s smaller product breadth indicates its competitive disadvantage in the sensor market. Though, TI is still larger than key analog competitors such as ADI and STM. Nonetheless, we believe the gap between the top companies’ product breadth and TI highlights its competitiveness in the sensor market.
Optoelectronics
For Optoelectronics, TI’s presence in this market segment is even smaller as we estimate it to have a 0.001% market share, which indicates it lacks competitiveness in the market segment. We compiled the total number of products based on Digikey to compare the product breadth. We examined 27 different product categories and grouped them into 5 main categories which are LED Components, Display Technologies, Fiber Optics, Light Sources and Optical Components.
|
Company |
LED Components |
Display Technologies |
Fiber Optics |
Light Sources |
Optical Components |
Total |
|
Texas Instruments |
0 |
2 |
0 |
0 |
1 |
3 |
|
onsemi |
688 |
2 |
0 |
0 |
157 |
847 |
|
Broadcom |
3,692 |
0 |
577 |
5 |
189 |
4,463 |
|
Vishay |
1,106 |
259 |
0 |
0 |
1 |
1,366 |
|
NXP |
1 |
5 |
0 |
0 |
6 |
12 |
|
STMicro |
18 |
26 |
32 |
0 |
71 |
147 |
|
Infineon |
1 |
0 |
32 |
1 |
0 |
34 |
|
ams OSRAM (OTCPK:AMSSY) |
7,092 |
0 |
0 |
86 |
1,039 |
8,217 |
Source: Company Data, DigiKey, Khaveen Investments
Based on the table above, our results show that ams OSRAM has the broadest portfolio with the highest number of products, as we previously analyzed ams OSRAM as one of the leading LED chip producers. Moreover, the company also leads in Optical Components with the most products. This is followed by Broadcom with the second-highest overall total number of products and Vishay. Texas Instruments is lowest in the table, as it only has 3 products in Display Technologies and Optical Components. Therefore, we determined that TI is uncompetitive in the Optoelectronics segment of the DAO market.
Conclusion
Overall, we believe that TI is a relatively small player in the remaining DAO segments including RF (9% market share), Optoelectronics (0.001% market share) and Sensors (4.4% market share. Based on our comparison in terms of the product breadth of the company, we believe it indicates that TI is uncompetitive in these segments as there are various companies with larger product breadths in each segment. We believe TI’s competitiveness in these DAO segments is negative for the company’s overall growth, as these segments have higher market CAGRs compared to the DAO segments in which it is competitive (Power Semiconductors and Analog ICs which has a CAGR of 6.3% and 8.4% respectively). The average forecast CAGR of Discrete Semiconductors and Other Analog ICs is 8.4% compared to the average CAGR of RF (12.32%), Optoelectronics (11.8%) and Sensors (10.79%). Thus, we believe this could lead to TI continuing to underperform the DAO market as its exposure to these 3 segments combined is only 17%, compared to the DAO market breakdown of 44%. Based on our derived breakdown and market CAGR, we calculated a weighted CAGR of 8.2% for TI, compared with the weighted DAO market CAGR of 9.2%, indicating TI to continue underperforming the DAO market.
Risk: End Markets Weakness
In addition to threats to its competitiveness in the DAO market, we believe a risk to TI is the growth headwinds in the semicon industry. The company highlighted in its latest earnings briefing that all end markets suffered revenue declines as the market demand was weak and “as customers continue to reduce their inventory levels”. In our previous analysis of Microchip, we highlighted the end market weakness in Automotive and Industrial, which are also two of TI’s most important segments as the only 2 segments with above-company average growth in the past 9 years. Nonetheless, we expected a recovery in the second half of the year for Industrials and a gradual recovery in automotive as automakers reduce their elevated supply of chips.
Valuation
|
TI Revenue Projection ($ bln) |
2023 |
2024F |
2025F |
2026F |
2027F |
2028F |
|
Analog Revenue |
13,040 |
14,114 |
15,277 |
16,536 |
17,898 |
19,372 |
|
Growth % |
8.2% |
8.2% |
8.2% |
8.2% |
8.2% |
|
|
Embedded Processing Revenue |
3,368 |
3,497 |
3,631 |
3,770 |
3,915 |
4,065 |
|
Growth % |
3.8% |
3.8% |
3.8% |
3.8% |
3.8% |
|
|
Others |
1,111 |
1,032 |
959 |
891 |
828 |
769 |
|
Growth % |
-7.1% |
-7.1% |
-7.1% |
-7.1% |
-7.1% |
|
|
Total |
17,519 |
18,644 |
19,867 |
21,197 |
22,641 |
24,206 |
|
Growth % |
6.4% |
6.6% |
6.7% |
6.8% |
6.9% |
Source: Company Data, Khaveen Investments
We updated our revenue projections of the company based on the segment breakdown. For its Analog segment, we derived a weighted average growth rate of 8.2% as mentioned in the points above. For its Embedded Processing and Others segments, we based it on its past 10-year average growth. In total, we forecasted the company’s total revenue average forward growth rate of 6.7%.
Company Data, Khaveen Investments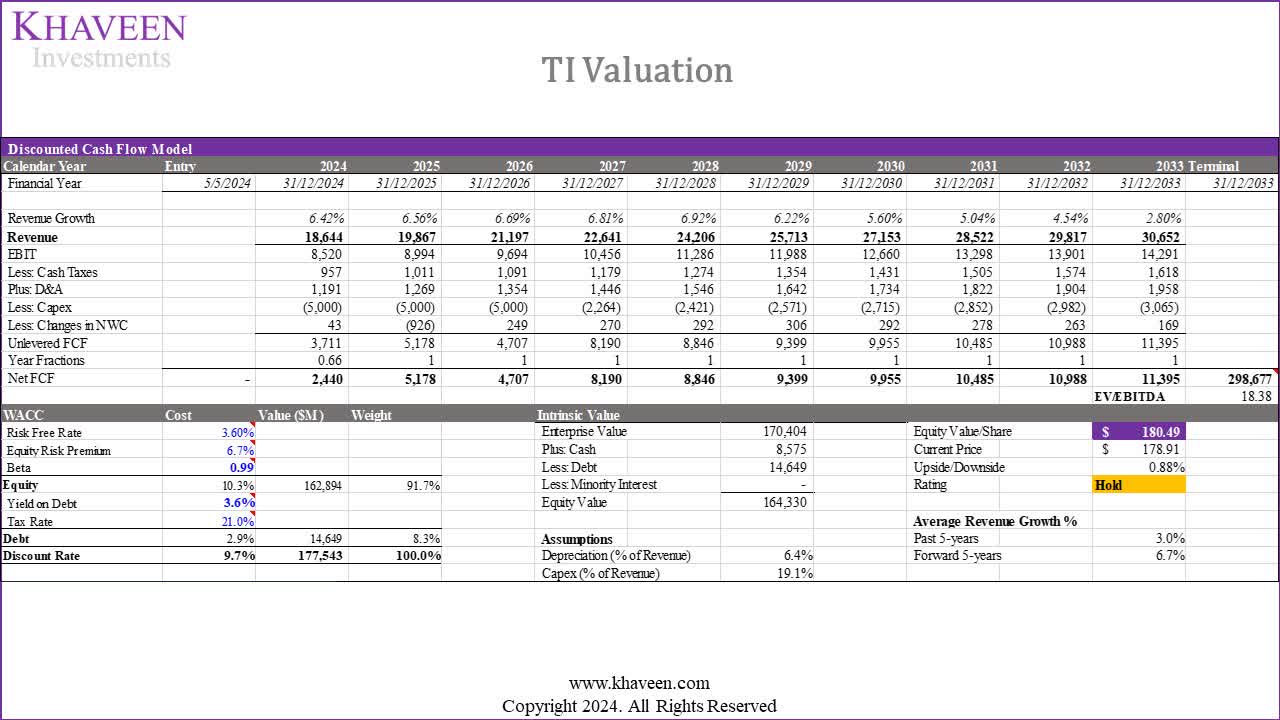
Based on a discount rate of 9.7% (company’s WACC) and terminal value based on the chipmakers’ 5-year average EV/EBITDA of 18.38x, our model shows its shares are fairly valued.
Verdict
|
DAO Market |
Market Size (2022) ($ bln) |
Market Breakdown % |
TI Market Share |
TI Revenue ($ bln) |
TI Revenue Breakdown |
Market CAGR |
TI Ranking |
|
Power Semiconductors |
60.4 |
32% |
8.8% |
5.3 |
35% |
6.30% |
2 |
|
RF |
19.2 |
10% |
9.0% |
1.7 |
11% |
12.32% |
6 |
|
Sensors |
20.4 |
11% |
4.4% |
0.89 |
6% |
10.79% |
6 |
|
Optoelectronics |
43.9 |
23% |
0.001% |
0.001 |
0.004% |
11.80% |
8 |
|
Discrete Semiconductors |
34.0 |
18% |
18.1% |
7.4 |
48% |
8.31% |
8 |
|
Other Analog ICs |
10.8 |
6% |
8.55% |
1 |
|||
|
Total |
188.66 |
100% |
15.4 |
100% |
Source: Company Data, Market Research Reports, Khaveen Investments
In summary, we believe that TI’s analog business segment is underperforming compared to competitors due to intense competition from ADI in Power Semiconductors within Power ICs and Discrete Semiconductors. Despite TI’s product breadth advantage, we believe recent product launches by ADI and stronger patent growth place competitive pressures on TI. Additionally, we identified TI’s heavy exposure to Discrete Semiconductors and Other Analog ICs, which have lower market growth and could contribute to underperformance in semicon DAO. Furthermore, we believe TI’s limited competitiveness in RF, Optoelectronics, and Sensors segments further hinders its overall growth, given the higher market growth rates in these areas. With a calculated weighted CAGR of 8.1% compared to the DAO market of 9.2%, we anticipate TI to continue to underperform the DAO market. Based on our valuation, we downgrade TI as a Hold following a 16% rise since our previous coverage with a price target of $180.49, fairly in line with our previous price target ($177.06).
Analyst’s Disclosure: I/we have a beneficial long position in the shares of TXN either through stock ownership, options, or other derivatives. I wrote this article myself, and it expresses my own opinions. I am not receiving compensation for it (other than from Seeking Alpha). I have no business relationship with any company whose stock is mentioned in this article.
No information in this publication is intended as investment, tax, accounting, or legal advice, or as an offer/solicitation to sell or buy. Material provided in this publication is for educational purposes only and was prepared from sources and data believed to be reliable, but we do not guarantee its accuracy or completeness.
Seeking Alpha’s Disclosure: Past performance is no guarantee of future results. No recommendation or advice is being given as to whether any investment is suitable for a particular investor. Any views or opinions expressed above may not reflect those of Seeking Alpha as a whole. Seeking Alpha is not a licensed securities dealer, broker or US investment adviser or investment bank. Our analysts are third party authors that include both professional investors and individual investors who may not be licensed or certified by any institute or regulatory body.