Summary:
- Texas Instruments reported an increase in revenue for Q2 2023 compared to the previous quarter but a decline compared to Q2 2022.
- The emergence of an ascending broadening wedge highlights the increased price volatility.
- The stock price of Texas Instruments is currently undergoing a correction and remains in a consolidation phase.
zorazhuang
Texas Instruments Incorporated (NASDAQ:TXN) observed an uptick in revenue for Q2 2023 compared to the previous quarter but a dip when measured against Q2 2022. This decline was primarily attributed to weakness in end markets, except automotive. The article provides a technical analysis of the stock price of Texas Instruments to predict its upcoming price trend and potential investment opportunities. It is observed that the stock price is currently undergoing a correction after encountering significant resistance and continues to remain in an intense consolidation phase.
Delving into Texas Instruments’ Recent Financial Insights
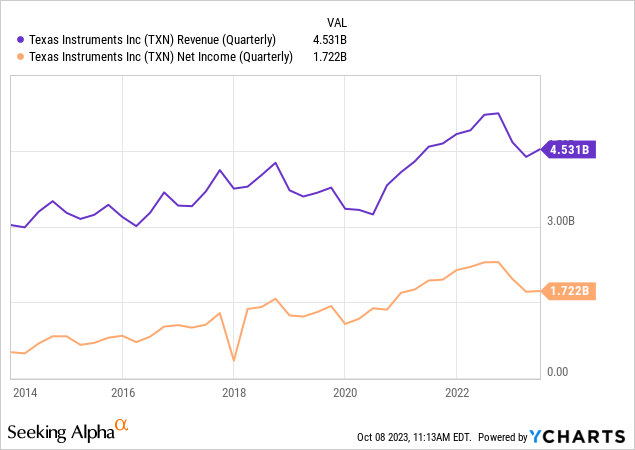
Texas Instruments announced a revenue of $4.531 billion, with a net income of $1.722 billion. This translates to earnings per share of $1.87 for this period. The company observed a sequential increase in revenue by 3%, but when compared to the same quarter from the previous year, there was a decline of 13%. This drop is attributed to weaknesses across most of the company’s end markets. However, the automotive sector remained an exception to this trend, showcasing strength. The chart below showcases the quarterly revenue and net income over the last decade. Notably, there’s a consistent positive trend, even with the dip experienced in the last quarter of 2022.

Cash flow from operations underscores the company’s financial health and operational efficiency. Over the past 12 months, this reached a noteworthy $7.4 billion. This number highlights the strength of its business strategy and the exceptional quality of its products, further enhanced by its 300-mm production techniques. Concurrently, the company’s free cash flow reached $3.2 billion, accounting for 17% of the overall revenue.
Furthermore, the company’s investments over the past year were spotlighted in earnings announcements for Q2 2023. Texas Instruments invested $3.6 billion in R&D and SG&A. Additionally, the company has invested $4.2 billion towards capital expenditures. In a display of commitment to its shareholders, the company returned a substantial $6.5 billion to its owners during this timeframe.
Despite originating from the glamorous microchip sector, Texas Instruments produces some of the industry’s most fundamental and straightforward chips. This is precisely one of the critical attractions of their stock. Unlike the frequently changing central processing units (CPUs), these basic chips find their way into almost every digital product. To quantify this, Texas Instruments boasts a clientele of over 100,000 customers globally.
Looking ahead, the third-quarter projections for Texas Instruments are optimistic. The company anticipates its revenue to be in the range of $4.36 billion to $4.74 billion. The expected earnings per share for this period are estimated to be between $1.68 and $1.92.
Deciphering Technical Price Trends
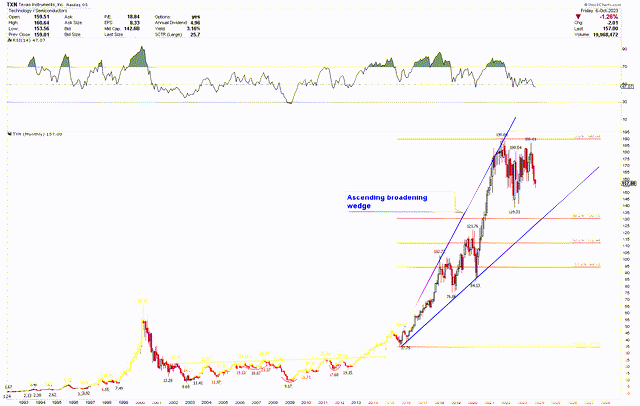
The stock price of Texas Instruments reveals a consolidation near a significant resistance zone, as evidenced by the monthly chart below. A close examination from August’s low of $34.91 to its all-time peak of $190.04 shows an ascending broadening wedge pattern. Such a pattern signifies rising volatility. The price topping at the resistance of this wedge suggests the onset of a recovery. Moreover, the Fibonacci retracement during this period confirms strong support at $130.75. The ongoing pullback accentuates potential further price consolidation. Despite this consolidation, the long-term bullish price perspective remains unchanged, as evidenced by the inverted head and shoulder pattern from 2002 to 2013. These inverted head and shoulders are foundational patterns indicating a long-term bullish inclination.
TXN Monthly Chart (stockcharts.com)
In 2020 and 2021, Texas Instruments experienced its most notable price surge. This surge was primarily due to the exponential demand for electronics and remote work tools during the COVID-19 crisis. Digital equipment like computers and tablets became essential as the world adapted to online spaces. Given that Texas Instruments’ chips are integral to many such devices, demand for their products soared. The company’s proactive management choices, including a streamlined supply chain and R&D investments, allowed it to thrive during these pandemic-driven market shifts, resulting in notable stock appreciation.
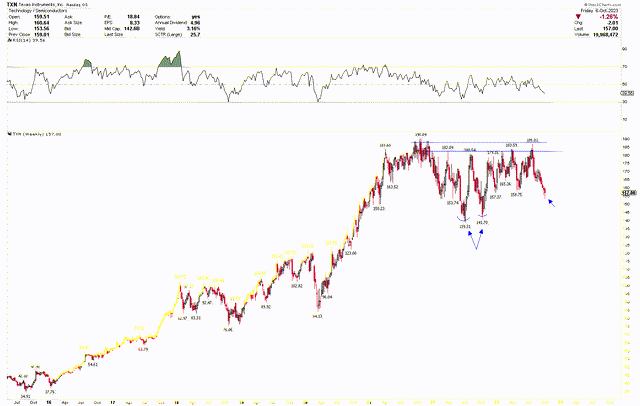
For a more granular understanding of Texas Instruments’ future price trajectory, the weekly chart below points to a double bottom at $139.31 and $141.70. Nonetheless, the recent September 2023 dip seems to diminish this pattern’s potential, suggesting extended consolidation within broad ranges.
TXN Weekly Chart (stockcharts.com)
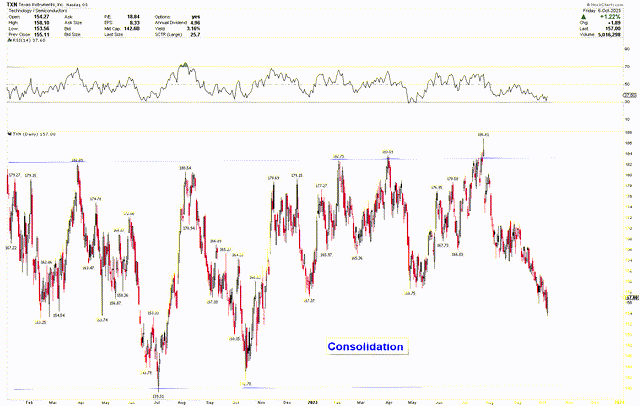
This period of consolidation is apparent in the daily chart below, where price movements hover between $140 and $190. Based on the above analysis, a decisive breakout above $190 would end this consolidation phase. Conversely, if prices approach $130.75, it presents an attractive buying window for long-term investors. Investment consideration could be based on two scenarios: when the price crosses the $190 threshold or if it retreats to the vicinity of $130.75.
TXN Daily Chart (stockcharts.com)
Market Risk
The company has declining revenue, primarily due to vulnerabilities in its key sectors. If these sectors remain weak or other areas falter, the firm’s profit margins might be jeopardized. Currently, the semiconductor sector grapples with supply-demand imbalances, which might hinder Texas Instruments from fulfilling demand or achieving anticipated sales. With the global complications in the semiconductor industry, any disruptions in the supply chain might impede the firm’s product delivery. Broader economic conditions, such as a potential recession or global economic downturns, might dampen the appetite for digital goods, thus affecting the revenue streams.
Furthermore, the company’s stock appears to be consolidating around crucial resistance levels. There might be prolonged periods of minimal price variations if the $190 mark isn’t surpassed. The ascending broadening wedge pattern indicates heightened volatility, which could result in erratic stock price shifts, potentially discouraging some investors.
Bottom Line
Texas Instruments showcased mixed financial results for Q2 2023, experiencing growth in sequential revenue but a year-over-year decline. A strong cash flow from operations emphasizes a solid business model, advanced manufacturing processes, and high-quality product offerings. Despite looming uncertainties in the microchip sector, Texas Instruments stands out due to its fundamental chips, robust customer base, and proactive growth strategies. The company remains optimistic, anticipating higher demand for digital products, and displays an unwavering commitment to its shareholders. However, amid these strong fundamentals, the stock price faces consolidation, impacted by market dynamics and industry challenges. The stock price consolidates between $140 and $190, showing no clear short-term trend. Still, long-term charts identify $130.75 as a significant support level, which coincidentally aligns with the ascending broadening wedge. Investors may consider buying Texas Instrument if the price drops to $130.75 or surpasses the $190 mark.
Analyst’s Disclosure: I/we have no stock, option or similar derivative position in any of the companies mentioned, and no plans to initiate any such positions within the next 72 hours. I wrote this article myself, and it expresses my own opinions. I am not receiving compensation for it (other than from Seeking Alpha). I have no business relationship with any company whose stock is mentioned in this article.
Seeking Alpha’s Disclosure: Past performance is no guarantee of future results. No recommendation or advice is being given as to whether any investment is suitable for a particular investor. Any views or opinions expressed above may not reflect those of Seeking Alpha as a whole. Seeking Alpha is not a licensed securities dealer, broker or US investment adviser or investment bank. Our analysts are third party authors that include both professional investors and individual investors who may not be licensed or certified by any institute or regulatory body.
