Summary:
- Texas Instruments stock currently has a high P/E ratio compared to its historical track record and sector median.
- However, P/E ratios can be misleading for highly cyclical stocks like TXN.
- They could lead to buying near cyclical highs and selling near cyclical lows.
- Alternative/additional metrics to consider for evaluating TXN stock include topline growth rates, dividend yield, and inventory levels.
Olivier Le Moal
TXN stock: P/E ratio can be misleading
Judging by its P/E, Texas Instruments (NASDAQ:TXN) stock is quite unattractive under current conditions. More specifically, the chart below summarizes TXN stock’s valuation grade in comparison to its historical track record and the sector median.
As seen, TXN’s P/E ratios are higher than both the sector median and its five-year average by a large margin. For its TTM P/E ratio based on non-GAAP EPS, TXN has a ratio of 29.34x, compared to the sector median of 22.44x and its five-year average of 22.30x. This represents a premium of more than 30% by both benchmarks. The picture is even worse in FWD P/E ratios (again, on non-GAAP EPS), which is what most of us focus on more than TTM P/E. Here, TXN’s ratio is 36.01x, over 50% higher than both the sector median of 23.52x and its 5-year average of 23.80x.
Against this background, the thesis of this article is to argue why you should not pay too much attention to P/E when evaluating highly cyclical stocks like TXN. Note that I’m not arguing that a high P/E is a good thing (or a Buy thesis on TXN under current conditions). My goal is to A) point out the limitations of P/E for cyclical stocks and offer some alternative metrics, and B) explain why these metrics point to a Hold rating.
TXN stock’s cyclicality
The first alternative idea involves topline growth rates. Bottom line-driven metrics like P/E or P/cash ratios can be highly chaotic for cyclical stocks. As pointed out in an earlier article on Micron Technology (another good example of a cyclical stock):
The underlying cyclical forces – which are out of the business’ control – can cause large fluctuations in these bottom line-oriented metrics in both directions. At good times, the business over-earns and the P/E ratios are low. Thanks to the extra earnings, the business also overly expands and plants the seed for the bad times to come. And vice versa.
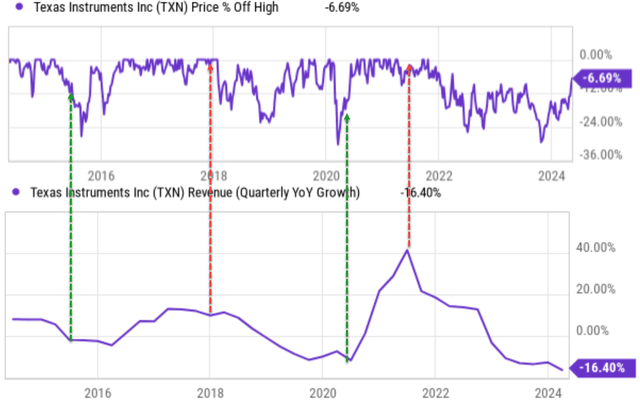
So if you rely on P/E ratios to sell or buy cyclical stocks, you could end up selling near the cyclical low or buying near the cyclical high. The following chart illustrates such potential pitfalls quite clearly.
The top panel of the chart shows price corrections for TXN stock in the past 10 years, and the bottom panel shows the quarter sales year-over-year growth rate. Over the past decade, I can identify at least two complete cycles, as marked by the red and green dashed lines illustrating the above dynamics. During a cyclical high (highlighted by the red dashed lines), its sales enjoyed tremendous growth (we are talking about ~20% or even 40%-plus growth YOY here). These are the times that its P/E tends to be low because of rapid earnings growth. However, such hypergrowth periods were often followed by drastic price corrections. Vice versa, near cyclical bottoms (as marked by the green dashed lines), the exact opposite tends to happen. Profits shrank, P/E ratios expanded, but stock price recovery followed.
TXN stock’s dividend yield
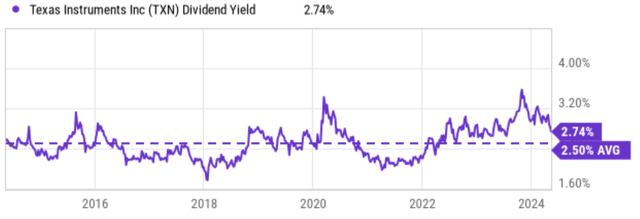
The second alternative idea involves checking its dividend yield instead of P/E ratios. I like cyclical stocks and I especially love cyclical stocks that pay regular dividends such as TXN because the dividends provide a backdoor to gauge the true owner’s earnings behind the highly volatile accounting for EPS.
The next chart below shows TXN’s dividend yield compared to its historical average. As seen, TXN’s current dividend yield is 2.74%, which is noticeably higher than its five-year average of 2.5%. This indicates an undervaluation of about 9%, which is the opposite of what its P/E ratio indicates.
TNX stock’s inventory
The third alternative idea involves checking the inventory levels. A key lesson I learned from Peter Lynch is his use of inventory for stock analysis:
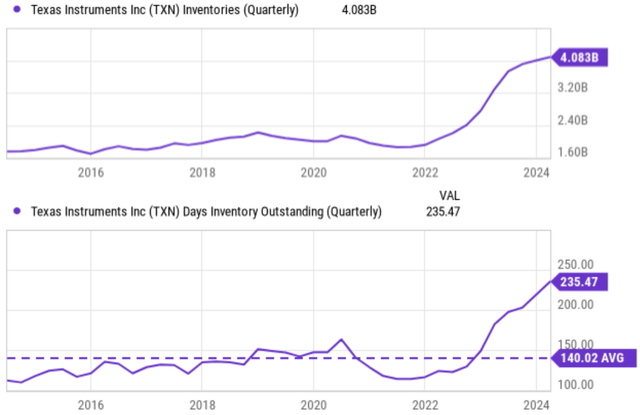
To start, unlike many other financial data that are more open to interpretation, inventory is one of the less ambiguous financial data. Lynch then explained why inventory levels can be a telltale sign of business cycles. Especially for cyclical businesses, inventory buildup is a warning sign, which indicates the company (or sector) might be overproducing while the demand is already softening. Conversely, depleting inventory could be an early sign of a recovery.
The following chart shows TXN’s inventory in absolute dollar amount (top panel) and also in days of inventory outstanding (DOIO, bottom panel). As seen, TXN’s inventory in absolute dollar terms has fluctuated and stayed below $2.4B before 2022. However, the inventory drastically built up after 2022, now sitting at a record level of $4.08 billion. In terms of DOIO, the picture does not improve at all. As seen in the bottom panel, TXN’s DOIO again fluctuated around an average of 140 days before 2022. The current level is 235 days, again by far the highest in at least a decade.
Looking ahead, I do not see how the inventory build-up can be addressed in a timely manner. On the contrary, I anticipate TXN to continue struggling with the tail end of the global chip glut, brought on by customers overstocking in response to pandemic-era chip shortages. In addition to the inventory buildup, I also see a few new problems to worsen the situation and make it even harder for TXN to empty the inventory, as to be elaborated on next.
Other risks and final thoughts
Besides the record inventory, a new and probably more severe challenge in my view is its China market. Economic recovery in China lagged expectations, and at the same time, rising trade tensions with the U.S. over semiconductor manufacturing pose a strong headwind for TXN’s business. China has historically been one of TXN’s most important markets. For instance, in 2022, 24% of the TXN’s revenue was derived from customers headquartered in China and close to 50% of its revenue came from products shipped to or within China. As the U.S.-China tension in the semiconductor space escalated, only 19% of the company’s revenue came from Chinese companies in 2023. And the company stopped its decade-long practice of breaking down the revenue by shipment destination. I do not see such headwinds as temporary, and anticipate them to keep pressuring TXN’s profits for the years to come.
To reiterate, my goal in this article is not to argue that you should ignore P/E ratios in stock analysis. My goal is to point out the limitation of P/E – either low or high – for the analysis of highly cyclical stocks like TXN. For such stocks, P/E alone could lead to totally backward buy/sell points. Investors should look past P/E and examine other metrics such as topline growth rate, dividends (if the stock happens to pay regular dividends like TXN), and inventory. For TXN, the picture is quite mixed after examining these additional metrics. Its dividend yield suggests some denervation, but I cannot see reliable signs of the end of this current contraction cycle from its topline growth rate or inventory levels. As such, my verdict is a Hold.
Analyst’s Disclosure: I/we have no stock, option or similar derivative position in any of the companies mentioned, and no plans to initiate any such positions within the next 72 hours. I wrote this article myself, and it expresses my own opinions. I am not receiving compensation for it (other than from Seeking Alpha). I have no business relationship with any company whose stock is mentioned in this article.
Seeking Alpha’s Disclosure: Past performance is no guarantee of future results. No recommendation or advice is being given as to whether any investment is suitable for a particular investor. Any views or opinions expressed above may not reflect those of Seeking Alpha as a whole. Seeking Alpha is not a licensed securities dealer, broker or US investment adviser or investment bank. Our analysts are third party authors that include both professional investors and individual investors who may not be licensed or certified by any institute or regulatory body.
As you can tell, our core style is to provide actionable and unambiguous ideas from our independent research. If your share this investment style, check out Envision Early Retirement. It provides at least 1x in-depth articles per week on such ideas.
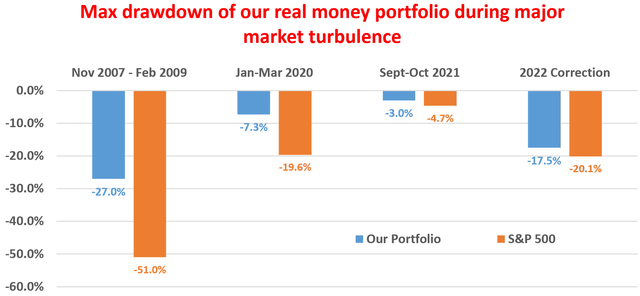
We have helped our members not only to beat S&P 500 but also avoid heavy drawdowns despite the extreme volatilities in BOTH the equity AND bond market.
Join for a 100% Risk-Free trial and see if our proven method can help you too.


