Summary:
- The Home Depot’s strong moat, scale, and market position support long-term growth, despite a lack of new store expansion.
- Aging U.S. housing stock and secular trends drive demand for home improvement, providing stable revenue and free cash flow growth.
- Despite a slight overvaluation, HD’s moat and shareholder returns justify holding the stock for the long term.
Davslens Photography/iStock Editorial via Getty Images
Investment Thesis
With a strong moat and a reliable market with secular trends that should support stable growth, The Home Depot (NYSE:HD) remains one of my highest conviction long-term investing ideas.
HD’s moat comes from its scale, massive retail store footprint, and the barrier to entry of a highly capital-intensive business that eliminates almost any chance of disruption to HD or its largest competitor, Lowe’s, Inc. (LOW).
An aging U.S. housing stock and the need for newly built homes should support adequate revenue growth for HD. The company’s operating leverage and increasing operational efficiency should help to accelerate the company’s free cash flow growth. Share repurchases, especially if done at the right times, should help HD grow free cash flow per share at an even greater rate. Existing stores keep generating increasing sales per square foot thanks to omnichannel improvements and the physical space acting like local distribution centers.
Some investors believe that HD lacks opportunities for growth due to a lack of store count growth. However, a stagnant store count is merely a sign of a mature business that has pulled back on investing in growth. It can now take its massive amounts of free cash flow and return it to shareholders in several different ways: a growing dividend, buybacks, and strategically eliminating debt.
Despite the stock being potentially overvalued by nearly 6%, moat and market opportunity carry more weight than valuation, and I rate HD as a hold.
Introduction
When HD slowed its expansion plans, reducing the investments required to grow its store count, it generated excess free cash flow and increased shareholder returns in the form of dividends and share repurchases. The chart below shows the shares outstanding (in blue) decreasing dramatically, and FCF per share (in red) and dividend per share (in green) rising just as dramatically.
Author-Generate Chart (Data from StockAnlysis.com)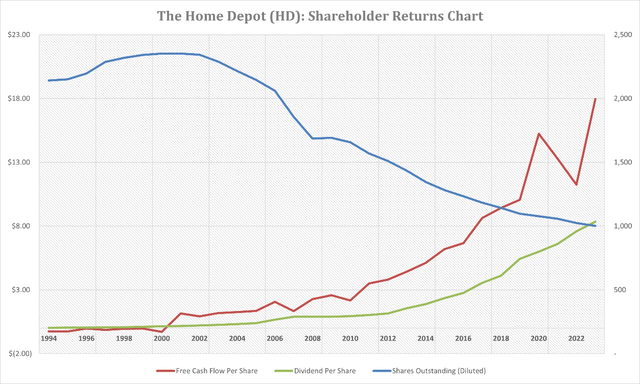
HD is a stage 5 company, firmly in the capital return phase of the business growth cycle and is optimized for free cash flow generation.
The Business Growth Cycle Chart (www.LongTermMindset.co)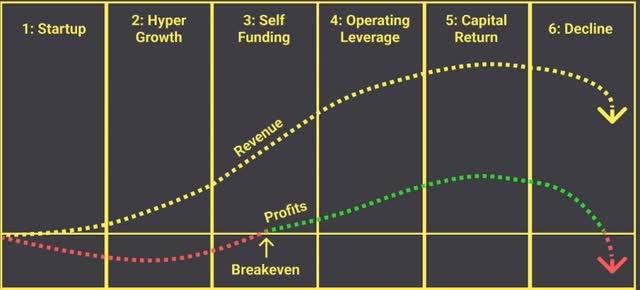
I help run investing education webinars for beginning and intermediate individual investors. During an introductory lesson identifying companies within the business growth cycle, a student asked how long a company could stay within the capital return stage of the business growth cycle. The lesson was simple and foundational, but the answer is a bit more complicated than we covered. I believe that for a company to survive and thrive in the capital return stage, two things matter more than anything else: moats and market longevity. The Home Depot has both of these, and I believe that’s the reason the stock almost always trades at a premium valuation and is perceived as expensive.
For such a well-covered stock like HD, I’m not sure how much I can contribute to the knowledge of investors. So, I’m going to do my best to explain why it’s okay to stay invested in such a stalwart business that appears to be lacking in expansion. The natural inclination of some investors is to think that a company that is not expanding can’t deliver strong shareholder returns. The problem with this line of thinking is that it just isn’t true; HD has been delivering for shareholders and may continue to do so. The chart below shows how HD stock has outperformed the SPDR S&P 500 ETF Trust (SPY), which I use as a proxy for the S&P 500. As I will discuss later, this has been done with almost no net new store growth.
HD vs SPY Total Returns (FinChat)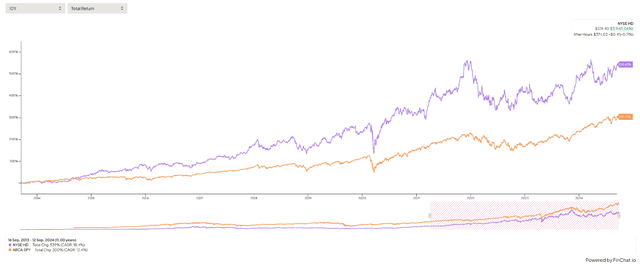
I don’t expect HD to deliver the kinds of explosive long-term shareholder returns that it has since going public, or even anything close to the 18.4% CAGR since 2014, but the stock could have plenty of room to run and for a much longer time than some think. This isn’t to say that I think the stock is a buy today, but perceived over-valuation isn’t necessarily a reason to sell the stock. I wrote about this issue in my Costco (COST) article in May. Inside one’s portfolio, it’s tempting to trim the flowers and to water the weeds. HD is one of the flowers in my portfolio. I only plan on selling HD if the company actually begins to near the decline stage of the business growth cycle, and I don’t see that happening any time soon.
The Moat Matters
When looking for moats, I want to see stable or expanding gross margins and at least one sustainable competitive advantage. HD holds scale advantages that allow it to remain a low-cost home improvement and lifestyle product provider. This scale advantage has put 90% of Americans within ten miles of an HD location. With that kind of reach, HD does not need new store growth, it just needs to milk more money out of each store.
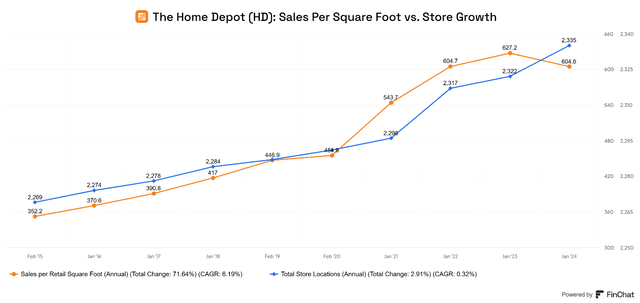
This growth in sales per square foot comes from increased operational efficiency, expansion of product lines, and a growing omnichannel presence. With e-commerce becoming a growing part of HD’s revenue mix, the company is leveraging its existing locations to act like local distribution centers. Combined, these three factors have sent sales per square foot to a 9-year CAGR of 6.2%, while total store locations have only grown at a 0.3% CAGR.
HD’s gross margin has remained fairly steady over the past twenty years. After eclipsing 33% in 2004, it has never fallen below 33.4%. This is a testament to the company’s moat. It’s rare to find a retailer with a true moat, but the company operates in an effective duopoly, competing with Lowe’s as the larger of the top two mega home improvement companies.
Home Depot’s stable gross margin indicates a potential moat (Author-Generated Chart (Data from StockAnalysis.com))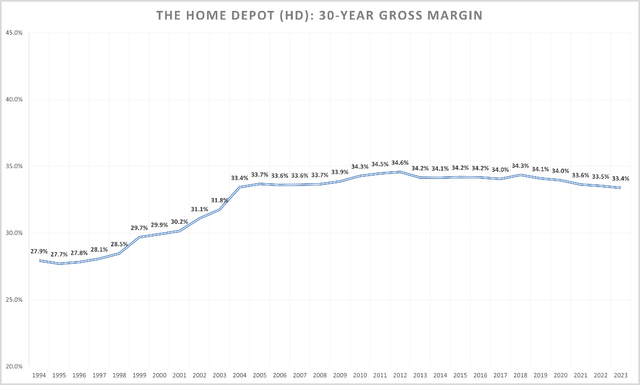
However, gross margin is currently at its lowest since 2004. To find out if this is concerning, we can look deeper down the income statement at other profit margins. The chart below shows 30-year operating, net, EBITDA and FCF margins for HD. The company has expanded these margins significantly, and despite a pull forward of pandemic-fueled demand and subsequent pullback in consumer discretionary big purchase spending, the company might be able to maintain or continue expanding its free cash flow margin. Being optimized for free cash flow generation is a hallmark of a stage 5 business.
Author-Generated Chart (Data from StockAnalysis.com)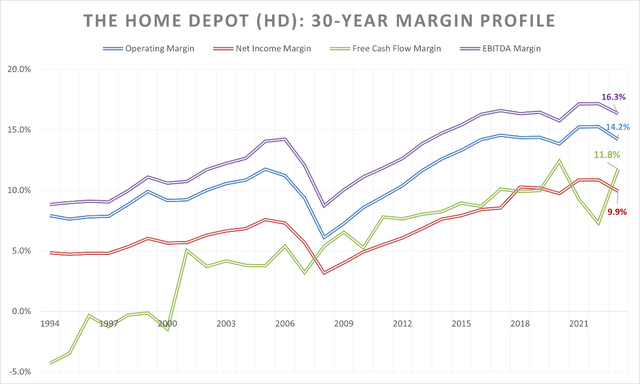
This is why I don’t worry about store count growth or high top-line growth for HD; the company is increasing profitability where it matters most.
HD also has a barrier to entry advantage. For competition to emerge in the home improvement space, massive amounts of capital and space will be required. This is something that even Amazon.com (AMZN) appears to be unable to accomplish beyond picking away at the margins. The larger and more entrenched in the market that HD and LOW get, the more difficult it will be for new entrants and smaller competitors to be in serious competition.
The Market Opportunity: Taking a Long-Term Outlook
I like to zoom out when looking at stocks like HD and focus on the company’s long-term opportunity. Companies with long histories of outperformance tend to outperform as long as they have a moat and strong market positions within reliable industries. Not only does HD have this, but it has a great secular trend ahead of it. The first big boom in housing following WWII and the rise of the middle class did home builders and suppliers well. Now that housing stock is beginning to show its age. There are about 85 million detached single-family homes in the United States, and roughly half are older than 43. These homes will need to be repaired or replaced in the decades ahead. HD is the clear leader in supplying residential and professional builders and contractors with home improvement materials and supplies.
Aging Housing Stock
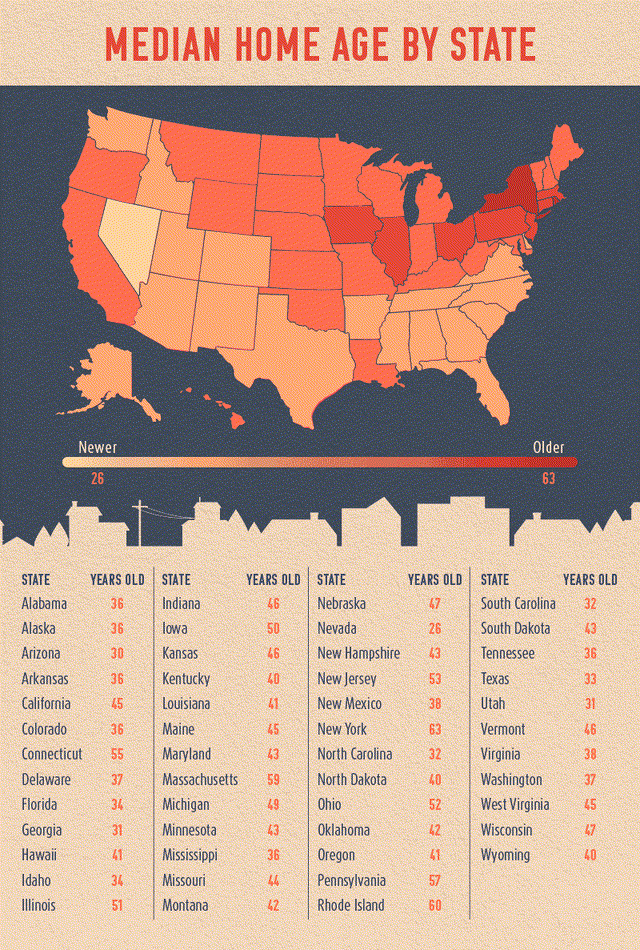
One of the most significant drivers for HD’s continued growth potential is the aging housing stock in the United States. Based on the state-by-state median home age statistics in the graphic below, and 2020 census population data, the median home age in the USA is approximately 43.0 years. In other words, half of all homes in the country were built before 1980.
As homes age, maintenance and remodeling costs kick in and then accelerate. Many household fixtures and components hold typical lifespans of 10–30 years, and significant repair costs can be observed after 20–30 years of a home being built. These costs accelerate further beyond the age of 30–40 years.
Author generated table, with general industry knowledge compiled from discussions with contractors and related industry experience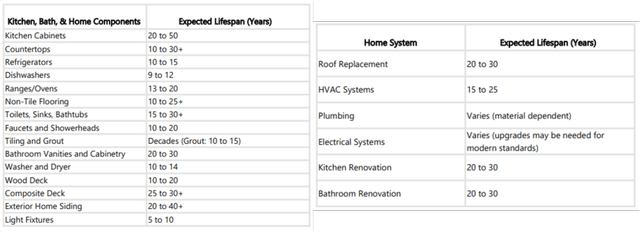
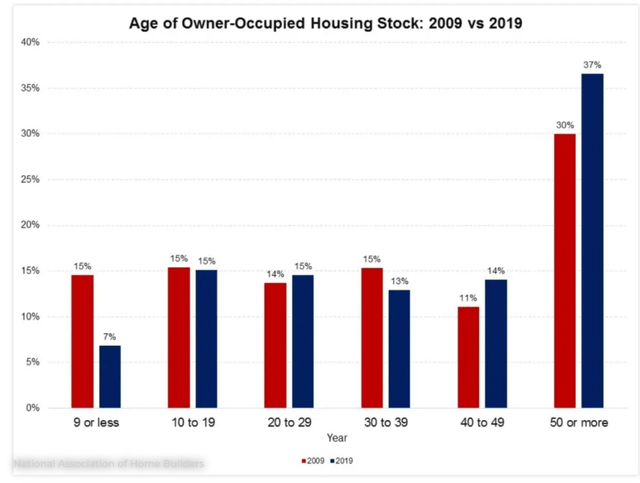
Housing stock aged 50 years or older has increased dramatically since 2009, with roughly 37% of homes falling into this category in 2019. It is now likely that 40% of owner-occupied homes in the U.S. are over 50 years old. These homes will need continuous repairs or remodels, and will eventually be replaced. This is something that HD’s management team discusses during almost every earnings call. Looking deeper, we see that roughly 2/3 of homes are now older than 30 years, which would mark an increase of at least 8% since 2009, likely closer to 10% today.
Not all regions have an installed base of homes as old as others, but in regions where the average home is older, I expect home renovation demand to increase. Many of these homes will need to be completely rebuilt, or new communities will spring up, driving new-build demand. There remains ample opportunity to see the demand for home improvement continue despite cyclicality. The beneficiaries of this will be the suppliers of the building materials, supplies, and tools needed to do this work, including The Home Depot. Even as the largest player in a highly fragmented industry, HD only commands a 17% market share. There could still be room to capture market share and continue to drive sales per square foot higher.
Increasing Profitability and Free Cash Flow
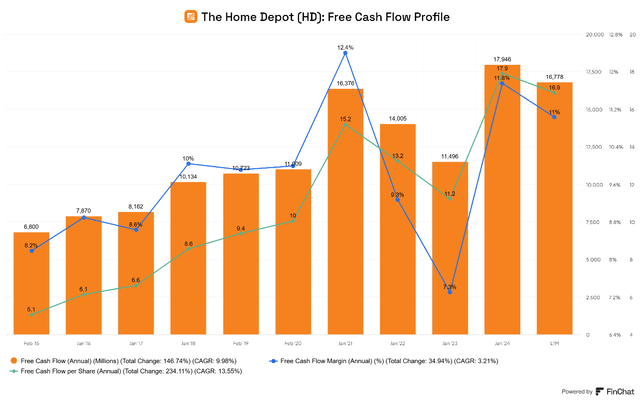
HD’s operating leverage has allowed it to grow free cash flow at a 10% CAGR since fiscal 2014 and, thanks to share repurchases, free cash flow per share at a 13.6% CAGR. Since 2014, HD’s free cash flow margin has expanded by 280 basis points until the TTM period.
Between 1994 and 2023, HD’s operating margin improved from 7.9% to 14.2%, net margin from 4.8% to 9.9%, and EBITDA margin from 8.8% to 16.3%. The company is a free cash flow generating machine, turning FCF-positive in 2001 and expanding FCF margin from a negative-4.3% in 1994 to 11.8% in 2023.
Valuation
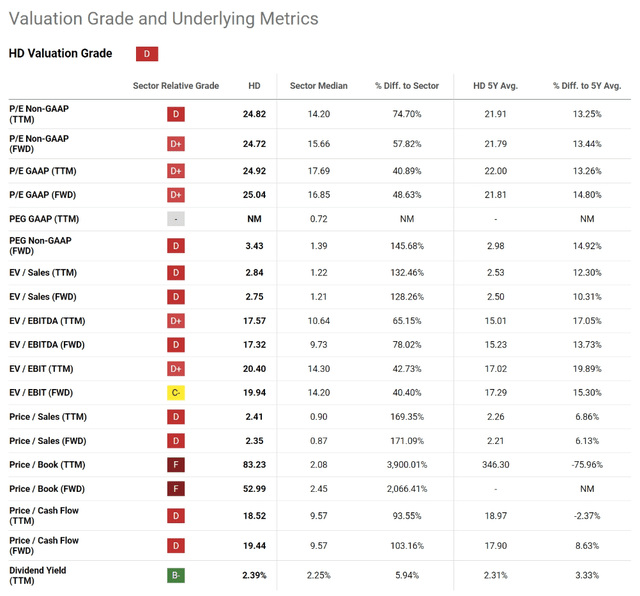
HD trades at a premium valuation of 25x trailing and forward P/E and above its 5-year averages on nearly every metric except trailing Price / Cash Flow. Seeking Alpha gives the company a grade of D for valuation.
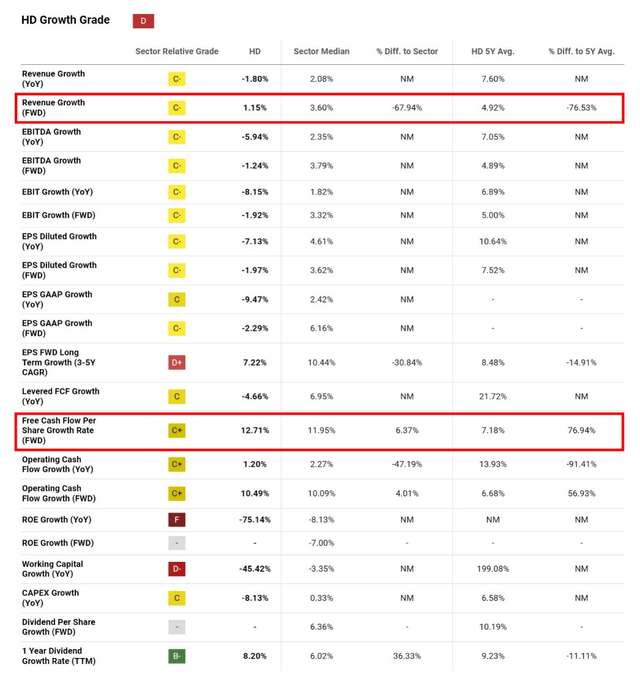
As seen earlier, HD has grown free cash flow at a 10.0% CAGR over the last 9-plus years. Free cash flow margin appears to be reliably in the 10% to 11% range outside of the pandemic. Seeking Alpha expects forward revenue growth of only 1.15% (2-year growth), but expects free cash flow per share to grow at 12.7%.
Discounted Cash Flow
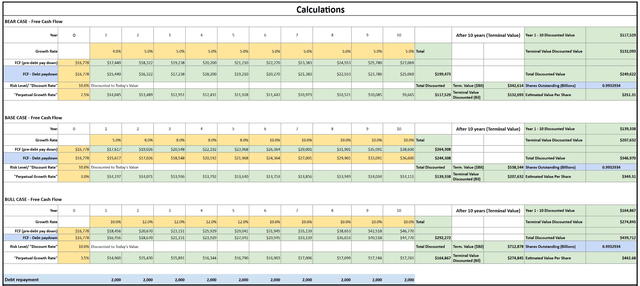
Base Case Methodology: I am projecting less than half of SA’s FCF/Share growth outlook for year one, as the next year may be challenging given the macroeconomic uncertainty and risk. For years 2-5, I am modeling for 8% annualized FCF growth; for years 6-10, I am modeling HD to grow FCF at its recent historical rate of 10% annually, which I highlighted earlier. I used a perpetual growth rate of 3.0%, which seems reasonable to me because I believe the home improvement market has a long runway for stable growth ahead, for reasons outlined earlier. I weighed the probability of the base case to 65%, as I am pretty confident HD can hit what, I believe, are conservative base case targets.
Bull Case Methodology: I projected HD’s historical FCF growth rate of 10.0% for year; a step-up to 12% for years 2-5; and a return to 10.0% for years 6-10. Given HD’s opportunity, this seems very attainable. I set the terminal rate to 3.5% for the bull case, which seems high under normal circumstances, but it assumes that the home improvement market remains slightly stronger than the base case. I weighed the probability of the bull case to 20%.
Bear Case Methodology: I projected HD’s FCF growth rate to underperform going forward, with only 4.0% for year one, and 5.0% for years 2-10. The terminal rate used is lower than the base case, at 2.5% or roughly GDP-plus. I weighed the probability of the bear case to 15%.
All cases use a 10% discount rate, reflecting my confidence in HD’s ability to sustain its moat, making it a low-risk business play.
I also reduced free cash flow by $2 billion each year to account for the $40 billion-plus in long-term debt that HD holds. I don’t necessarily expect them to pay down this debt completely, but this is my method for accounting for the debt within the DCF. This hypothetical pay down of debt is highlighted in blue within the DCF calculations table.
Given my inputs, the stock could be slightly overvalued by about 5.7%. It’s important to note that this DCF is not intended to be an accurate estimate of intrinsic value, but to provide some guidance when assessing whether or not the stock may be trading at a steep discount or a steep premium. In the case of Home Depot, it may be roughly fairly valued, given the inherent flaws in a DCF model and the unpredictability of the exact growth rates that it may achieve.
Author-generated DCF Model Author-Generated DCF Calculations Table
Risks
HD is facing challenges with shoppers pulling back the reins on large purchases, and a recession or series of poor earnings could significantly impact the stock in the short or medium term. The stock trades at a premium, which means that disappointing guidance or macroeconomic fear could make the stock prone to deserved or irrational sell-offs. Debt is a risk for HD, but the company generates nearly $17 billion in free cash flow every year, allowing it to wipe out its long-term debt in under four years if it were so inclined to. For this reason, I don’t think debt is as big an issue as some perceive it to be. It’s also important to consider that paying down debt is also a form of shareholder returns, as it lowers the liability held by not just the company but the shareholders of the company.
Conclusion
Given my investment thesis and confidence in HD’s ability to maintain its moat and continue driving free ash flow growth through its scale advantages, increasing efficiency, dominant market position, and the long-term sustainability of the home improvement market, I believe that a small overvaluation of the stock is no reason to sell it off. I have ignored many analysts’ calls to sell HD as low as $280 since I bought shares near its lows in 2022, when I made a large purchase of around $270. Ignoring these calls has been the right decision. Even if the stock falls back to my cost basis or below, I plan on adding to my position as long as my investment thesis holds. My plan is to hold my shares for the long term and hope to benefit from increasing shareholder returns in the years ahead. I assign The Home Depot a hold rating.
Analyst’s Disclosure: I/we have a beneficial long position in the shares of HD, LOW, COST, SPY, AMZN either through stock ownership, options, or other derivatives. I wrote this article myself, and it expresses my own opinions. I am not receiving compensation for it (other than from Seeking Alpha). I have no business relationship with any company whose stock is mentioned in this article.
Seeking Alpha’s Disclosure: Past performance is no guarantee of future results. No recommendation or advice is being given as to whether any investment is suitable for a particular investor. Any views or opinions expressed above may not reflect those of Seeking Alpha as a whole. Seeking Alpha is not a licensed securities dealer, broker or US investment adviser or investment bank. Our analysts are third party authors that include both professional investors and individual investors who may not be licensed or certified by any institute or regulatory body.
