Summary:
- Home Depot is a quality company with strong fundamentals.
- Growth has remained strong so far but is expected to slow next year.
- The intrinsic value derived using Cash Flow Returns On Investment based DCF analysis tools points to a value higher than the current share price.
- We examine companies using our affiliate ROCGA Research’s Cash Flow Returns On Investment based DCF valuation and modeling tools.
sevenstockstudio
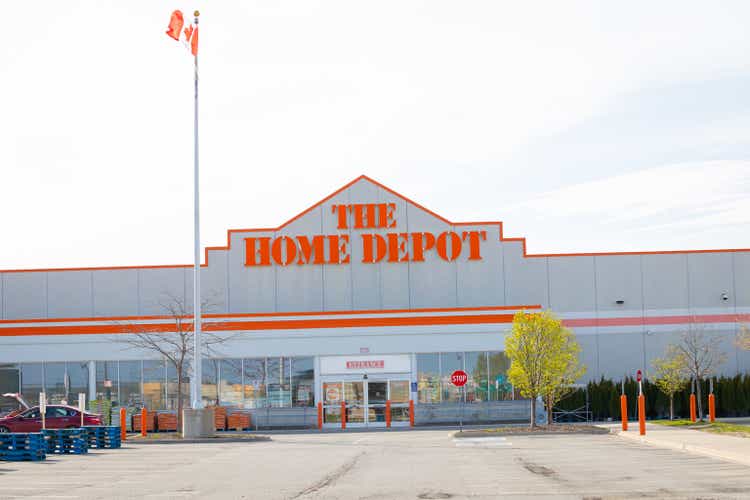
Home Depot (NYSE:HD) is a great company with a simple and easy-to-understand business model. Our DCF models based on Cash Flow Returns On Investments point to Home Depot being undervalued by 25%. Share prices are down by 14% compared to the 52-week highs of $347, providing a compelling entry point for investors.
Home Depot is the world’s largest home improvement retailer with over 2,300 stores across North America. Product ranges from building materials, home improvement, garden, décor, and maintenance and repair. Only about 3.7% of revenues come from services, which include equipment rental and home improvement installation. Their customer groups are professionals and direct consumers. Professionals are the renovators/remodelers, and the consumers are the homeowners.
FY2023 and Q4 Financial Overview
Q4 revenues were roughly flat in comparison to the same period last year. Margins remained stable and EPS was up 2.5% mainly due to the lower shares outstanding. Q3 saw an increase in revenue of 6.5%, but Q4 saw a slowdown. FY2023 (year ending January 2024) guidance provided by management expects revenue growth to be flat, operating margins to go down from the current 15.3% to 14.5% and EPS to decline by around 5%. The margin decline is mainly due to about $1bn extra pay for its frontline hourly workers.
FY2022 (year ending January 2023) saw revenue growth of 4.1%, margins saw no change and EPS was 4.1% higher at $16.74.
Detailed Financial Analysis
For long-term value creation, we need to see growth, efficiency, and high returns. Similar to a DuPont-like breakdown, we will try and identify the value drivers for Home Depot. We will look at the historical performance and the direction the company is taking and use our understanding to project forward.
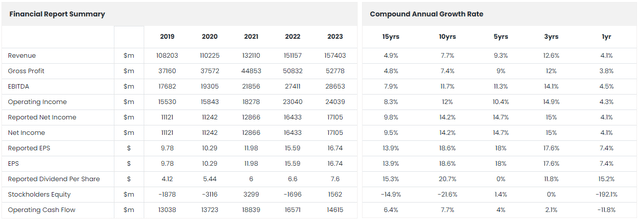
Financial Summary & Growth (ROCGA Research)
Let us start by looking at the growth numbers. 2021 saw revenue increase from post covid elevated demand in home improvement and from its acquisition of HD Supply. The three years CAGR in revenues of 12.6% are higher than the more modest longer-term averages. As mentioned above, FY2024 will see no growth in revenues, and consensus expects growth to start picking up again in FY2025.
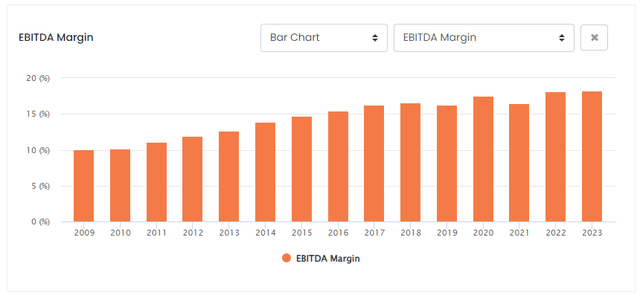
EBITDA Margins (ROCGA Research)
Margins have improved significantly from 2009’s 10% to 18.2% in 2023.
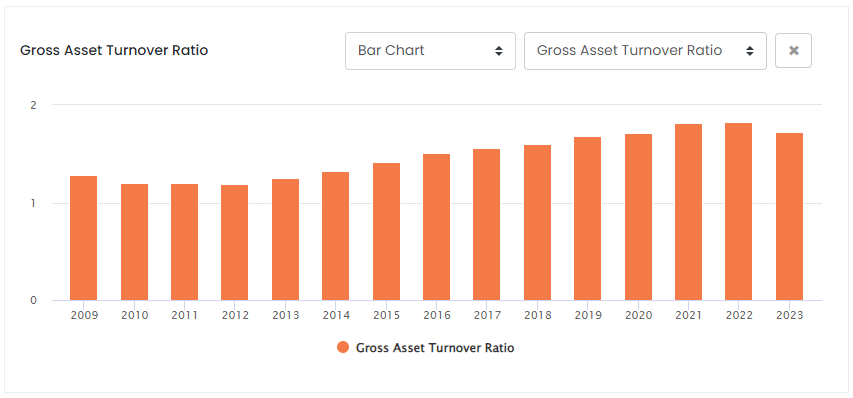
Gross Asset Turnover (ROCGA Research)
We can see that asset turnover has also improved over time. Asset turnover is calculated by dividing revenues by the assets used to generate those assets. Improving asset turnover shows the company is better at using its assets to generate higher revenues.
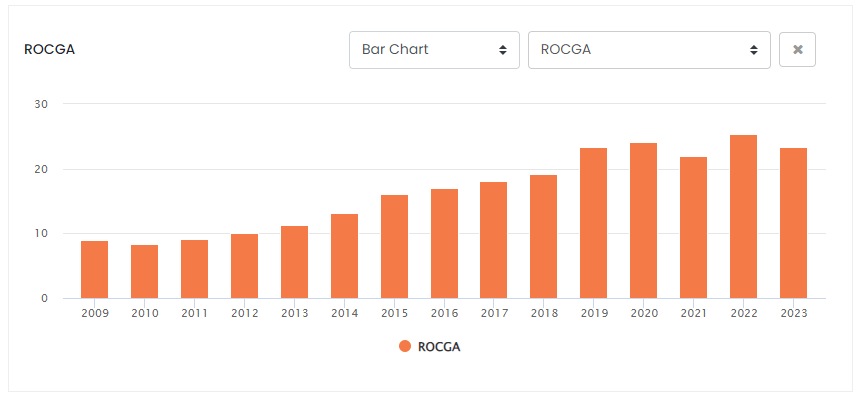
Returns On Cash Generating Assets (ROCGA Research)
Increasing asset turnover and improving margins translate to improving returns. We can see in the chart above, returns have improved significantly over the years and are now standing well above 20%. Returns On Cash Generating Assets (ROCGA) are similar to Cash Flow Returns On Investments and are a measure of economic performance. To add value, you need returns higher than the cost of capital and growth. Home Depot fits all the criteria required to be a serial value creator.
Valuation
The share price has more than doubled from 2018’s low of $136 to the current share price of $300. Even taking the high point at $207 per share, the share price is up approximately 50%. The rise is even more spectacular if we go back further to 2013’s midpoint of approximately $56, the share price has more than quintupled (x5).
With the help of our cash flow returns on Investments based DCF valuation tool, we will use the data gathered so far to derive an intrinsic value for Home Depot. The valuation tool gives us the ability to back-test our model assumptions and use that to project forward.
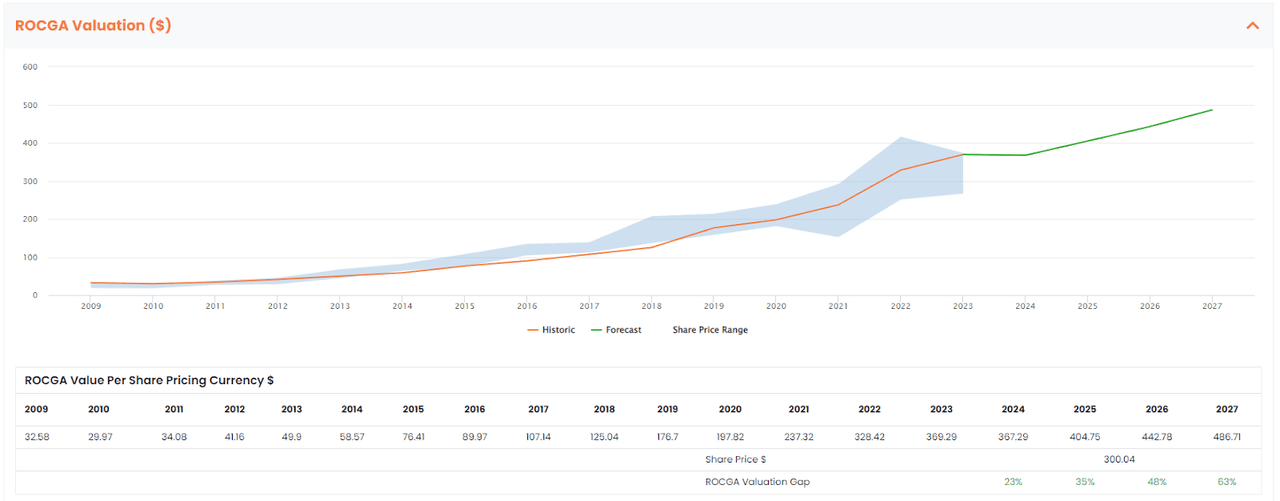
HD Default Valuation chart (Created by the author using ROCGA Research platform)
The valuation chart above shows the historic share price highs and lows (the blue band) and the model-driven valuation, the orange line. The valuation line follows closely with the share price band and that gives us the confidence to use the same model to project forward. The green line is the valuation forecast derived from our default back-tested model and consensus earnings estimates.
This Cash Flow Returns On Investments based DCF valuation tool points to Home Depot being undervalued by at least 23%. Being consistent with its history of creating value, valuation is expected to continue increasing for FY2025 and beyond.
Quality & Risks
The dividend yield is a respectable 2.6% with the cover hovering around and over 2x.
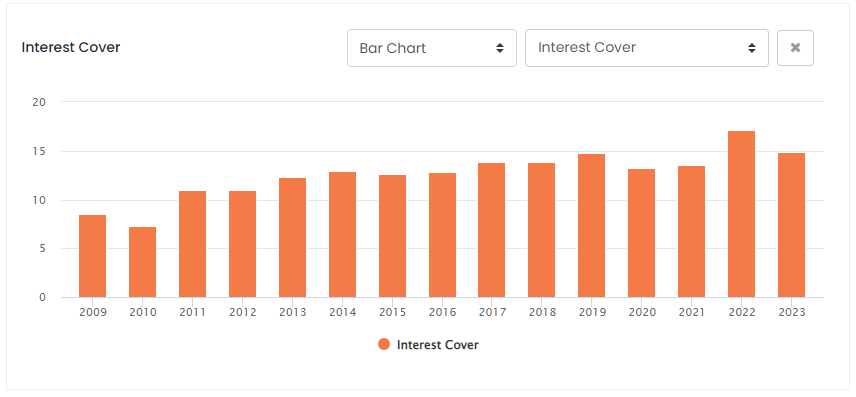
Interest Cover (ROCGA Research)
Interest cover is also strong in the mid-teens. EPS has grown by 13.9% over the past 15 years. All of the above indicators are of good financial quality. The company also has a prolific share buyback program. The current shares outstanding are approximately 1,013m, down a third from 2013’s 1,499m, returning over $70bn in the process. Financially, the company is stable and strong.
2022 saw a build-up in inventory from $16.6bn to $22.1bn, and this stood at $24.9bn at the year ending January 2023.
Working capital was impacted by higher merchandise inventories resulting from our efforts to continue to meet the demand environment and from higher product and transportation costs, along with the timing of vendor payments.
It would appear that the buildup of inventory occurred when revenue growth was high, but with slowing growth were not able to sell quickly enough. This had a negative effect on cash flows. The company could be holding onto some potentially redundant stock (negative), and these are at lower pre-high inflation prices (positive). With the revenue growth expected to be flat next year, we should expect the unwinding of this working capital and higher operating cash flows.
Given the macroeconomic backdrop, management expects flat real economic growth and consumer spending in 2023. This is also evident in the revenue growth expectations. Another point worth mentioning is that Home Depot has almost overwhelmingly had positive earnings and revenue surprises, so the risk on that is to the upside.
The inflationary environment will impact Home Depot. Flat growth in an inflationary environment does mean a modest reduction in actual growth. Wage inflation is already having an impact on margins.
Higher mortgage costs will keep people in their homes for longer and may encourage repair, renovation, and remodeling.
Conclusion
Home Depot has demonstrated its ability as a serial value creator, has strong fundamentals, and given the current share price, is presenting a discount of over 20%. They will continue to add value beyond 2024.
Lowe’s, in comparison, is looking more attractive on various valuation matrices. Given that revenues are expected to decline by approximately 8%, Home Depot seems better placed to whether the higher inflation, lower growth environment.
It is a good time to go long Home Depot stock.
Analyst’s Disclosure: I/we have no stock, option or similar derivative position in any of the companies mentioned, and no plans to initiate any such positions within the next 72 hours. I wrote this article myself, and it expresses my own opinions. I am not receiving compensation for it (other than from Seeking Alpha). I have no business relationship with any company whose stock is mentioned in this article.
Seeking Alpha’s Disclosure: Past performance is no guarantee of future results. No recommendation or advice is being given as to whether any investment is suitable for a particular investor. Any views or opinions expressed above may not reflect those of Seeking Alpha as a whole. Seeking Alpha is not a licensed securities dealer, broker or US investment adviser or investment bank. Our analysts are third party authors that include both professional investors and individual investors who may not be licensed or certified by any institute or regulatory body.
