Summary:
- The article examines whether Tesla, Inc. has the potential to appreciate ten times over with its current valuation, as part of the ‘The Hunt For Potential 10x Returns’ series.
- I have developed a rating system based on factors such as returns on invested capital, insider ownership, share repurchases, gross profit margin, and intangibles to evaluate Tesla.
- Tesla has the correct ingredients: high return on invested capital, industry tailwinds, and leading product offerings to produce great compounded returns over time.
- However, the most significant question is whether such a large cap can continue compounding. My hunch is yes, which is supported by its current cash flow valuation and set of catalysts that may outweigh potential risks.
NiseriN
Introduction
To continue my hunt for 10x potential returns, I couldn’t think of a better company to bring through my checklist than Tesla, Inc. (NASDAQ:TSLA). One main question investors are asking is: does Tesla even have the potential to appreciate ten times over with its current valuation? In this article, I am going to dedicate my “The Hunt For Potential 10x Returns” series solely to Tesla. In addition to rating the company on my 10-bagger list, I’m going to present a valuation and go through risks/catalysts that will support the question for this article: Is Tesla too big?
The 10-Bagger Rating List
Check out the start of this series in “The Hunt For Potential 10x Returns: 2 Software Giants,” where I have calculated the required annualized return to gain 10x returns over different time horizons. The power and influence 10x returns can have on your portfolio is immense, and I believe there are certain factors that correlate with this outcome. In short, this is what the series is all about:
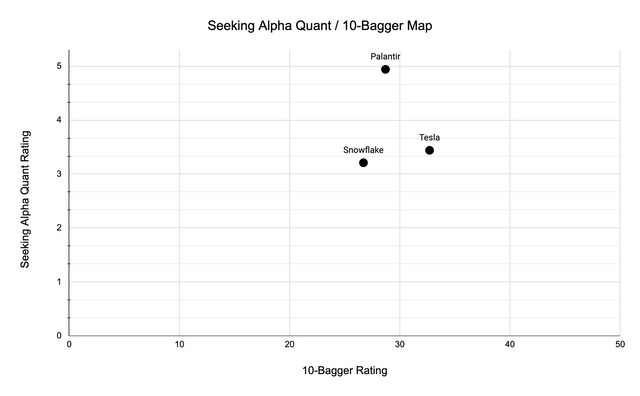
In this series, I will be rating one/two companies based on pre-determined criteria which have been found to increase the chance of a stock becoming a 10-bagger. My goal in this series is hence to give investors a quick checklist of 10-bagger factors for a multitude of different companies to compare with over time. Furthermore, I will be cumulatively adding to a scatterplot each company’s 10-bagger rating and Seeking Alpha Quant rating which we can track over time.
With inspiration from Christopher Mayer and Peter Lynch, as well as my own experience with investing, I have created the following rating list, which ranges from 1-10, with what I believe are the most important factors that contribute to a potential 10-bagger status. (if you have any recommendations for new factors, please let me know in the comments!)
Rating List
- Profitability (“ROIC”), (“ROE”) or (“ROCE”)
- Insider Ownership
- Share Repurchases
- Gross Profit Margin
- Intangibles.
Profitability: Ex. Returns on Invested Capital (“ROIC”), Return on Equity (“ROE”), Return on Capital Employed (“ROCE”).
| Rating | Level |
| 1-2 | <(0)-2% |
| 3-4 | 3-6% |
| 5-6 | 7-9% |
| 7-8 | 10-15% |
| 9-10 | 15%+ |
Insider Ownership
| Rating | Level |
| 1-2 | 0-5% |
| 3-4 | 5-10% |
| 5-6 | 10-25% |
| 7-8 |
25-50% |
| 9-10 |
50%+ |
Share Repurchase (yearly % purchase of outstanding shares)
| Rating | Level |
| 1-2 | <(-5%) |
| 3-4 | (-5)-(0%) |
| 5-6 | ±0% |
| 7-8 | 1-5% |
| 9-10 | 5%+ |
Gross Profit Margin
| Rating | Level |
| 1-2 | Compressing |
| 3-6 | Steady |
| 7-10 | Expanding |
Intangibles
| Rating | Intangible Asset |
| 1-10 | Company Culture |
| 1-10 | Industry Potential |
| 1-10 | Operating Leverage |
Tesla: $869.8 billion Market Cap
($8.7 trillion for 10-bagger status)
| Characteristic | Level | Rating |
| Returns on Invested Capital (“ROIC”) | 35,64% | 10 |
| Insider Ownership | 14,48% | 5 |
| Share Repurchases | (4.65%) | 3 |
| Gross Profit Margin | Steady | 5 |
| Intangibles | Exceptional | 9,7 |
Total Points: 32,7/50
Returns on Invested Capital (“ROIC”)
“ROIC” = Net Operating Profit After Tax (“NOPAT”) / (Total Debt + Total Equity – Cash & Cash Equivalents).
Tesla has an impressively low amount of debt at $1,752 million, a large cash buffer of $16,048 million, and $49,235 million in total equity of which $32,878 is additional paid-in capital and $15,398 is retained earnings. In all, the company has an invested capital base of $34,939 million.
The Author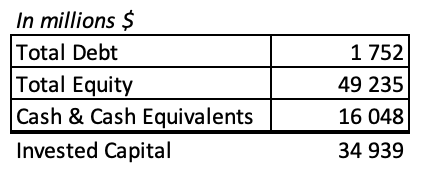
For the sake of this calculation, I will use twelve trailing months figures and I will adjust “NOPAT” by capitalizing R&D costs for an assumed 3 years. In the latest quarter, the company spent about 3.3% of sales on R&D initiatives which I would consider low in comparison to its automotive peers (shown farther down). Nevertheless, after adding back expensed R&D and subtracting the estimated tax rate, I find that Tesla earned a “NOPAT” of $12,541 million for the trailing twelve months.
When dividing “NOPAT” by invested capital, I find that Tesla has a “ROIC” of 35,64%. This is well above the upper limit of the scale at 15+%, which easily supports a 10/10 profitability rating.
When running the same exercise for some of Tesla’s peers, we find that the company stands out. Compared to the ‘traditional’ automobile companies, Tesla has a much higher “ROIC” (about double that of Ford). Furthermore, the American electric vehicle company, Rivian, is extremely unprofitable for the time being. The biggest threat to Tesla, which Elon Musk himself has pointed out, is not the competition from the United States but the competition from China. BYD is a heavily vertically integrated electric vehicle manufacturer in China and achieved a “ROIC” of 36,17% (TTM) which is slightly higher than the comparable period for Tesla.
| Automobile Companies | “ROIC” | R&D % of Sales |
| Tesla | 35,64% | 3,3% |
| Rivian (RIVN) | -129,07% | 85,1% |
| BYD (OTCPK:BYDDF) | 36,17% | 4,7% |
| Toyota (TM) | 2,01% | N/A |
| Ford (F) | 18,32% | N/A |
Insider Ownership
According to Seeking Alpha’s estimate, insiders own 14.48% of the outstanding shares in Tesla. Almost all of this insider ownership is concentrated with Elon Musk. When looking at the latest proxy filing, I find that other management and directors own around 0.3% of Tesla’s outstanding shares. Although this seems like a small amount, 0.3% of the outstanding Tesla shares have a market value of around $2.6 billion which should be enough to get the managers out of bed in the morning!
Since Tesla does not have a dual-class share structure such as Alphabet (GOOG), Meta Platforms (META), and Berkshire Hathaway (BRK.B), to name a few, Elon Musk does not have a majority influence over the voting at Tesla. However, I stumbled upon an interesting article from 2018 called “How Elon Musk Controls Tesla With Only a Minority Ownership Stake,” where Ronald Orol explained how Tesla had supermajority voting rules. At the time, Tesla required that “a minimum of 89.5% of outside shares must vote to approve key changes — an incredibly high hurdle.” According to the most recent proxy filing, Tesla now has a supermajority voting rule that claims that “at least 66 2/3% of the total outstanding shares entitled to vote is required to approve such amendments.” Last year, the company had its highest participation rate in the last five years of 63% yet still short of the required 66% to pass certain voting matters. In the same filing, Tesla claims:
“Once we have achieved a total stockholder participation rate of at least 65% at a stockholder meeting, the Board will again propose charter and bylaw amendments to eliminate supermajority voting requirements.”
Hence, although the supermajority voting rules were once a way for Elon Musk to have more control over Tesla, this privilege is waning – and most likely for the better. In conclusion, given the CEO’s ownership of around 14% but lack of majority voting rights, I rate Tesla a 5/10 with regards to insider ownership on the 10-bagger scale.
Share Repurchases
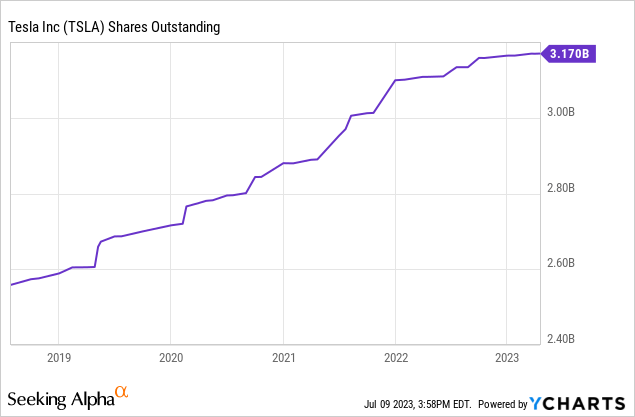
Since 2019, Tesla shareholders have been diluted by roughly 22% and by roughly 9,3% since 2021. In my analysis of Palantir (PLTR) and Snowflake (SNOW), I measured share dilution since 2021. Therefore, for the sake of consistency, I can conclude that Tesla shareholders have been diluted by an average of 4.65% per year since 2021. This motivates a share repurchase rating of 3/10. Although my analyses for share repurchases are backward-looking, I want to comment a bit on what I believe may happen to Tesla’s outstanding shares going forward.
Since Tesla was unprofitable on a GAAP basis up until 2020, the company has needed equity financing to scale production. However, the company has significantly scaled its cash flow from operations from $2 billion in 2018 to $14.7 billion in 2022. This performance gives Tesla an incredible amount of flexibility when allocating capital. So, when can we expect the company to begin repurchasing shares on a net basis?
Well, as a manufacturer, Tesla is generally capital-intensive. Of the $14.7 billion generated from operations in 2022, around $7.4 billion was incurred as capital expenditures. Going forward, the company has a goal to produce 20 million vehicles per year by 2030 (Torque News) which means that future operating cash will most definitely be used for further expansion in production capacity. Tesla CFO, Zach Kirkhorn, alluded strongly to this notion in the past quarter earnings call (Seeking Alpha Transcripts):
“What’s really important for us this year in addition to just managing the day-to-day of the business but is also investing in, as Elon mentioned, what 2024 and 2025 will look like. And so using the cash generated from the sale of products today and reinvesting that, this is very important for us.”
For these reasons, I don’t expect Tesla to begin heavily repurchasing shares in the next few years. But, over the long-term Tesla will have the ability to reverse the course of the share count very quickly, if they decide to do so. The company has several operating levers that, if executed, have the ability to generate huge amounts of free cash flow. One of these levers is the full self-driving subscription business, which I discuss in more detail in the operating leverage section.
Gross Profit Margins
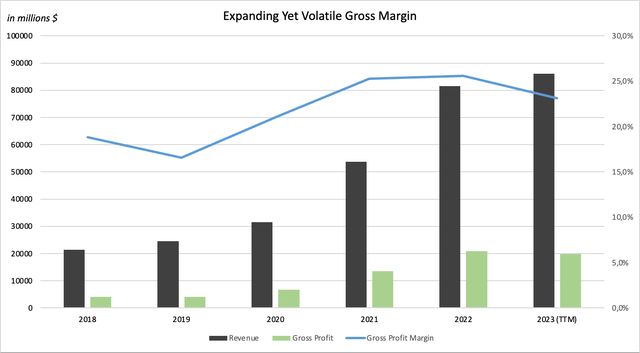
In Q1, Tesla achieved a revenue of $23 329 million and a gross profit of $4 511 million which represents a 19.3% gross profit margin (Q1 2023, Tesla). This was significantly lower than the company’s 25,6% gross margin in 2022. Zach Kirkhorn again provides some context about the company’s thinking regarding price reductions during the earnings call:
“And I think that what happens to margins over the next couple of quarters that only matters in the context of what that means for our ability to reinvest into 2024 and 2025.”
This is a powerful quote that should be cherished by long-term investors. It is a reassurance showing that Tesla is extremely focused on 2025, 2030, and 2035, not 2023. In spite of this, there are investors and analysts that are worried about the recent price cuts. This could prove to be a legitimate worry, though it is too soon to tell. For example, the margin drop from 2018 to 2019 may have been worrisome at the time, but the company recouped the margin directly in the following year and expanded the margin even more in the years following 2020. Tesla’s general margin trend over the years is upward, however, the recent margin compression motivates me to give the company a 5/10 on the gross profit margin scale.
Intangibles
| Intangible Asset | Rating |
| Company Culture | 10 |
| Industry Growth Rate | 9 |
| Operating Leverage | 10 |
Average Points: 9,7
1. Company Culture
From the outside looking in, Tesla seems to promote innovation on all fronts. This is most likely the reason for why Tesla was ranked the second most desirable place for engineers to work in 2022 (Teslarati). Tesla wrote in its 2022 Impact Report that
“At Tesla, meaningful engineering ideas can come from interns, analysts, or executives. We strive to minimize red tape so our engineers can be creative and solve engineering problems that have never been solved.”
Ranked no. 1 was SpaceX. This may speak to the gravitational pull that Elon Musk and the companies he builds have on aspiring engineering students. Though, he does not lead without controversy. On Glassdoor, Elon has an approval rating of 72% by his employees and Tesla has an overall rating of 3,7/5,0. Considering the desire for engineers to work at Elon’s companies, I’m surprised to see a relatively low/only average approval rating. The company is surely notorious for intense workloads, which is perhaps why only 63% of employees would recommend Tesla to a friend. But, it’s this type of company culture that has driven incredible results.
During the 2023 Investor Day Presentation, we gained insights into how significantly different business units within Tesla had cut costs and driven efficiency. Here are some examples:
- From 2017-2022 the Model 3 powertrain used 25% less rare earth metals, the powertrain production space decreased by 75%, and the cost to produce decreased by 65%.
- Produced only 20% of internal controllers in the Model S, but 85% are internally produced in the Cybertruck.
- Model 3/Y center display cost was reduced by 24% from 2017-2021, with more reductions to come.
- The per kWh supercharger cost decreased by 40% from Q1 ’21 to Q4 ’22 (excludes energy cost)
- Supercharging times have decreased by 30% from 2018-2023
- Model 3 cost per car decreased by 30% between 2018 and 2022.
In short, Tesla has an incredible ability to manufacture with efficiency. Once the company has decided on a production method, teams begin doing the work manually, then they semi-automate the process, and finally, they automate the process completely. Tesla is expecting its next-gen vehicle to be the cheapest and most efficient yet, with an all-in cost of $1,000. For these reasons, I believe the company culture deserves a 10/10.
2. Industry Growth Rate
Tesla is at the forefront of a selection of the most attractive industries going forward. The two industries are the electric vehicle industry and the sustainable energy industry (a grouping of energy storage, electric charging, solar, and heat pumps).
Electric Vehicle Industry
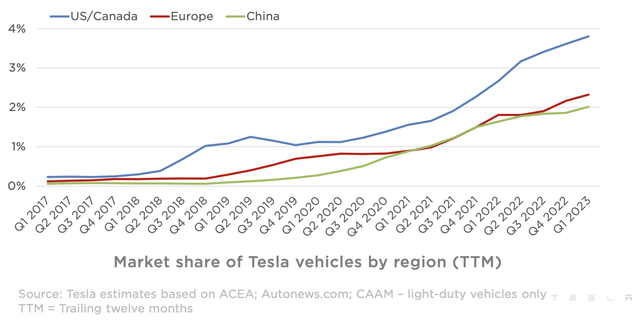
Vantage Market Research estimated the electric vehicle market to be worth $193,55 billion in 2022 and the firm expects the market to grow by a 17,3% CAGR until 2030. This suggests that the electric vehicle market will be worth around $693,7 billion in 2030. Tesla currently has a 62,4% market share in the U.S. electric vehicle market (Barrons) and has the following market share of all total automobiles sold.
The large opportunity for Tesla is to continue expanding its market share in such a quickly growing industry. According to Barron’s, Tesla’s U.S. electric vehicle market share grew from 59,3% in Q4 ’22 to the current 62,4% which is very promising. What is less promising is Tesla’s share in the Chinese market. In another Barron article, it was estimated that:
“Tesla’s share of the total EV market in China, which includes both battery-electric vehicles and plug-in hybrids, is at about 10%, compared with 7% over the same span of 2022. BYD‘s market share is at about 45%, up from about 30% a year ago. BYD makes both plug in hybrids and battery electric vehicles.”
Although these figures may not be comparing apples to apples, they give a clear picture of BYD’s dominance over Tesla in the Chinese market. Capturing more of this market may be the biggest hurdle for Tesla’s EV business and how it plays out is yet to be seen.
Sustainable Energy Industry
Megapack energy storage
In the most recent quarter, Tesla disclosed that it has deployed a total of 3,9 GWh. BNEF estimates that new global storage capacity of a whopping 1,143 GWh will be added from 2022 to 2030, which represents a 15-fold increase (BloombergNEF). This means that Tesla’s megapacks have a long runway of growth. For example, if we assume that Tesla will deploy (3,9 GWh x 4 x 1,50) 23,4 GWh in 2023 and assume that the business continues to grow by 50% until 2030 then Tesla will have new deployments of 399,81 GWh. This assumes that the company will capture 35% of all new deployments. If we think backward, is this reasonable? According to BNEF, GWh deployments around the world reached around 45 GWh in 2022. Tesla deployed 5,92 Gwh in the same period, which implies a market share of 13,2%. Therefore, I can imagine a 35% market share as the best-case scenario but a more realistic outcome is that Tesla’s megapack market share slowly ticks upward over time and could hover around 20% of new deployments.
Supercharging/charging network
In a recent Seeking Alpha news article, Wood Mackenzie projected EV charging points to grow fourfold by 2027. Tesla currently claims a 61% share in direct current fast charging (“DCFC”) and around a 40% share in level two charging points. The charging industry has immense potential for Tesla, especially at the onset of major North American Charging Standard (“NACS”) adoption by various automobile manufacturers. Through its network of superchargers, Tesla will be able to gain so many new customers which will contribute to its prospects of quickly growing charging revenues. Furthermore, its charging points provide a network of marketing points that no customer, regardless of the EV they drive, will be able to avoid.
Solar
According to Allied Market Research, the solar roofing market is expected to grow from $59,4 billion in 2021 to $241,5 billion in 2031, which represents a CAGR of 15,1%. Tesla’s acquisition of Solar City gave the company a portfolio of solar products that it can draw synergies from, with its existing energy storage business and charging network. In certain instances Tesla compliments (or subsidizes) its energy units in order to incentivize the sale of more cars. One example of this is its $30/month unlimited overnight charging, mentioned at the shareholder meeting, that launched in July.
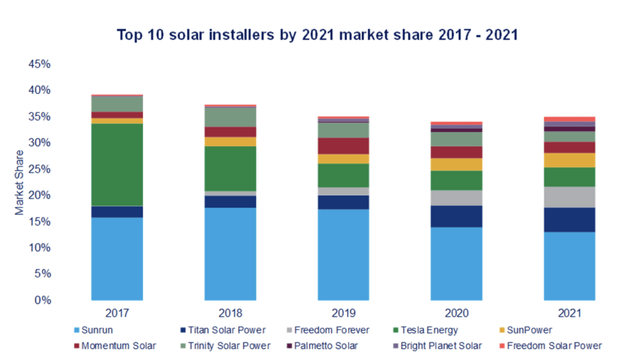
Although Tesla’s solar business is complementary to its other business units, it is not a successful business unit on a stand-alone basis. In this graph provided by Wood Mackenzie, referenced in Solarbuildermag, we can see Tesla Energy (light green) significantly lose market share between 2017 and 2020. In 2020 to 2021, the market share remained stable but the overall trend is worrying. After the acquisition, Tesla may have needed to restructure the management of Solar City and build products that synced better with each other which may explain the company’s lack of focus on sales and installations. In the latest quarter, solar deployed amounted to 67 MW or a 40% YoY increase. This as well as future performance may suggest that Tesla has reprioritized its focus to the solar business, but time will tell.
Conclusion
The string of funding that is accelerating the growth of Tesla’s various energy units is for one the Inflation Reduction Act passed under President Biden and second, as mentioned by Wood Mackenzie “Biden’s Bipartisan Infrastructure Law [that] has outlined investments of $7.5B in EV charging and over $7B in EV battery components, critical minerals, and materials.” While I expect Tesla to continue to uphold/expand its EV market share and expand its energy market share in the U.S, the Chinese market remains a significant challenge for Tesla’s car business with growing competition from BYD and XPeng (XPEV). Furthermore, it will be important to follow the solar business’s performance going forward because the alarming shrink in market share could turn quickly given the synergies Tesla can sell with. Given that all of Tesla’s markets are growing at such a significant rate and that Tesla has a considerable share in all of them, I rate the industry growth potential a 9/10.
3. Operating Leverage
History
Tesla’s operating leverage is no secret to investors/followers of the company. In fact, the company is probably best-in-class, the epitome of how to drive operating leverage. In 2016, revenues were just slightly above operating expenses; in the previous quarter, revenues were 12,6x greater than operating costs. Tesla’s scale in manufacturing and car sales, complimented with a company culture committed to improving efficiency has been the driver of the company’s huge operating leverage.
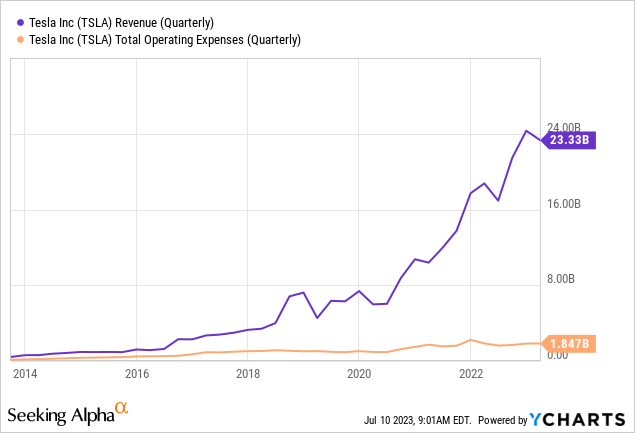
As we can see in the chart below, Tesla has significantly been reducing its operating expenses as a % of revenue over time. Zach Kirkhorn mentions that part of this is due to Tesla’s optimized selling, general & administration (“SG&A”) costs which are, according to the company 60-70% lower than the traditional automaker as measured by “SG&A” per car sold. One of the reasons Tesla has been able to do this also relates back to company culture. In order to improve the efficiency and costs of production, the company has had to develop its own software, its own controllers, its own data management systems, its own insurance underwriting segment, etc.
Tesla Shareholder Meeting 2023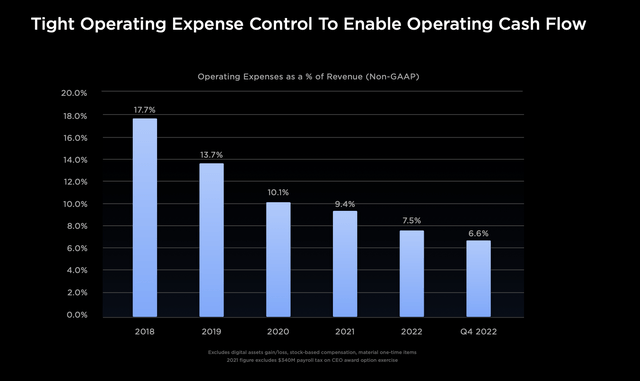
Going Forward
So, it is clear that Tesla has proven its ability to drive operating leverage, but how can Tesla drive even more in the future? Lo and behold full self-driving (“FSD”). It is estimated that around 285,000 consumers in the U.S. have purchased “FSD” as of January 2023, and 1,5 million vehicles had been sold at that point; this implies a take rate of 19% (insideevs). The company could move from having manufacturing margins to software-like margins if “FSD” becomes widely available and increases its take rate. Tesla is currently selling the capability to use the “FSD” Beta version for $200/month which is essentially a SaaS business model. Wide-scale adoption of this product would allow Tesla to generate even more operating leverage and free cash flow going forward, a product that Elon Musk has described as being one of the largest value-adds in history. Seeking Alpha analyst Hunter Wolf agrees: in his article “Tesla: Full Self-Driving Fuels Almost Half Of Stock Valuation,” the author estimates that the fair value of full self-driving is equal to $176/share. He assumes a take-rate of 40% in 2032 and a total price of around $15,000, which given 13 million deliveries, would equate to ~$87 billion in revenue and ~$65 billion in profit. Given Tesla’s proven ability to drive operating leverage and its future potential to drive even more, I rate the company a 10/10 for this metric.
10-Bagger Rating & Seeking Alpha Quant Map
I would like to conclude this article as well as future 10-bagger hunts with a map continuously plotting the companies I analyze based on my 10-bagger rating and Seeking Alpha’s quant rating. This allows us to gauge company performance with a perspective for companies that I analyze over time on a two-dimensional rating scale.
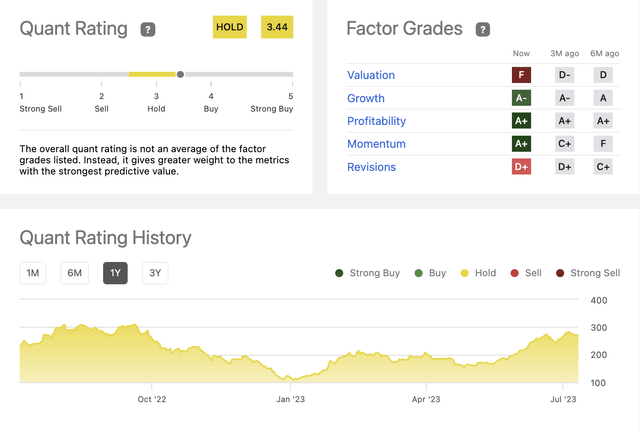
Tesla Quant Rating: 3,44/5,00
Rating Map
In this article, I find that Tesla scores 32,7/50 with regard to the 10-bagger rating and 3,44/5,0 with regard to Seeking Alpha’s Quant rating. This is the highest-rated company in the hunt for potential 10x returns yet! To me, this implies that if we put valuation to the side, Tesla has the correct ingredients to return 10x to shareholders. But, is Tesla too big to do so? We’ll look into this below.
Conclusion: Is Tesla Too Big?
In my opinion, Tesla is not too big for giving shareholders potential 10x returns. Given that the company executes its “FSD” goals and continues taking market share in industries with strong tailwinds, which is likely to be achieved due to the company culture, then Tesla is likely to continue compounding. This conclusion is not only supported by lofty goals but also a proven track record for delivering operating leverage as well as significant industry influence (for example within Supercharging). Financial catalysts also include the company using its financial flexibility to repurchase shares. Below is a reverse discounted cash flow model for Tesla, as well as risks and catalysts that further support my conclusion.
Valuation
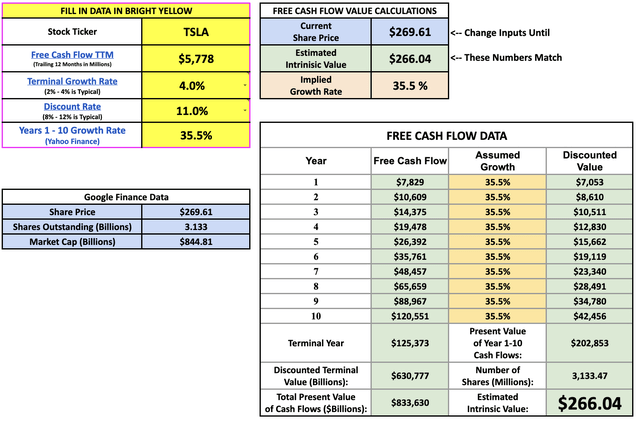
In order to gauge whether Tesla’s valuation is reasonable or not, let’s use a reverse discounted cash flow model developed by Brian Feroldi, Brian Stoffel, and Brian Withers. The point of this valuation technique is to find an assumed cash flow growth rate to match the current share price valuation. Starting from the top left, Tesla generated $5,78 billion in free cash flow (“TTM”). I assume that Tesla has a long runway for growth given its industry dynamics and hence gives the company a terminal rate growth value of 4%. Furthermore, I assume that cash flows will be discounted by 11%. With these assumptions in place, the reverse “DCF” claims that Tesla must grow its future cash flows at a 35.5% CAGR over the next ten years in order to justify its current valuation. Our job is now to answer: is this reasonable?
My short answer to this is yes. Hunter Wolf, Seeking Alpha analyst, estimated that “FSD” can generate around $65 billion profit in 2032 alone. Much of that profit will become free cash flow and makes up for half of the expected free cash flow needed in 10 years in order to make the valuation reasonable. Furthermore, Tesla’s car sales, energy sales, insurance sales, and more are likely to fill the rest of the $60 billion in cash flow year 2032. However, in order for lofty goals to come to fruition, Tesla must unlock the catalysts presented below.
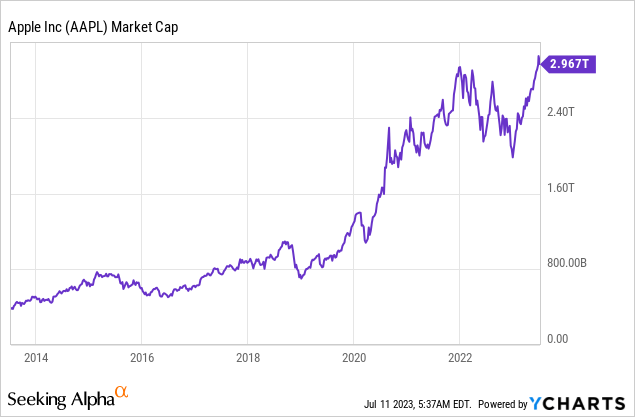
Can large numbers, such as $868,8 billion, be able to grow even larger? To give some reference, the largest company as measured by market cap in 2014 was Apple ($560 billion). Within the nine following years, the company has been able to grow its market cap by nearly 5x! Apple is still one of the largest caps and given that the largest cap could be able to 5x again, then the largest cap company in 2033 could potentially have a value of $15 trillion. This makes Tesla’s $8.7 trillion potential all the more feasible – especially if financial conditions ease over time.
Catalysts/Risks
Catalysts that will drive Tesla toward potential 10x returns include:
- The majority/all autos join the Tesla supercharging network by supporting NACS
- Giga-Mexico starts construction for the new ‘next-gen vehicle’
- Cybertruck deliveries begin in Q4 ’23 and are an exceptional hit
- Dojo production & heat pump production open up new business models for Tesla
- Tesla receives permission to enable full self-driving globally
- Full self-driving rollout in the U.S. leads to a potential Robo-taxi business
- Initiating share repurchases.
However, the risks that hinder Tesla to achieve these potential returns include the following:
- Elon/leadership shake-up due to investor worries that Elon is too focused on Twitter/other endeavors
- Regulatory blockage of “FSD” in the U.S. and abroad
- Failure to compete in the international market, especially against competitors such as BYD and XPENG
- Failure to breathe new life into the solar business
- Abandonment of a potential Robo-taxi business model (which makes up 67% of Ark Invest’s enterprise value estimate for Tesla in 2027).
Tesla has the highest chance of delivering 10x returns so far in this series.
If you enjoyed this article, let me know! My plan is to search for one/two new potential 10-baggers on an ongoing basis, so if you are interested in following the series then give me a follow. All the best, thanks!
Editor’s Note: This article discusses one or more securities that do not trade on a major U.S. exchange. Please be aware of the risks associated with these stocks.
Analyst’s Disclosure: I/we have a beneficial long position in the shares of TSLA either through stock ownership, options, or other derivatives. I wrote this article myself, and it expresses my own opinions. I am not receiving compensation for it (other than from Seeking Alpha). I have no business relationship with any company whose stock is mentioned in this article.
Seeking Alpha’s Disclosure: Past performance is no guarantee of future results. No recommendation or advice is being given as to whether any investment is suitable for a particular investor. Any views or opinions expressed above may not reflect those of Seeking Alpha as a whole. Seeking Alpha is not a licensed securities dealer, broker or US investment adviser or investment bank. Our analysts are third party authors that include both professional investors and individual investors who may not be licensed or certified by any institute or regulatory body.


