
Summary:
- Alphabet/Google’s Q3 earnings miss resulted in a nearly 10% stock decline, wiping out $160 billion in value.
- The market overreacted to Google Cloud’s growth expectations, despite it gaining market share and becoming profitable.
- Google Cloud is growing 20% annually and is expected to grow operating profits by 1400% by 2028 or 71% annually.
- There is one simple sentence about Google we will share that investors may have never heard, but which perfectly exemplifies why all investors need to own this company.
- There are few lower risk ways (AA+ credit rating) to earn Warren Buffett-like returns in the short-term and life-changing 400% returns in the next decade.
Deagreez
When companies miss on earnings, they often get punished.
This quarter, that’s especially true after a red-hot year for stocks that baked in perfect execution that many companies aren’t delivering.
Daily Shot 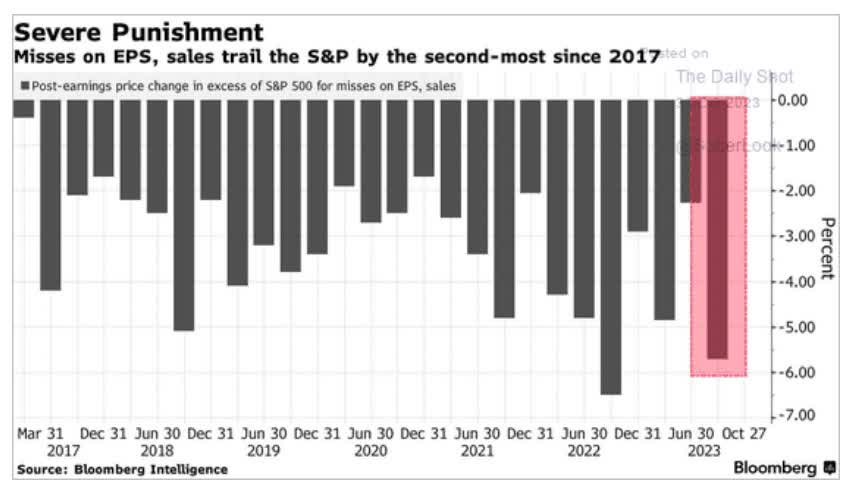
Alphabet Inc. (NASDAQ:GOOG, NASDAQ:GOOGL) aka Google reported earnings on October 24th, and the reaction was even more violent, a nearly 10% decline the next day that wiped out $160 billion in value.
Ycharts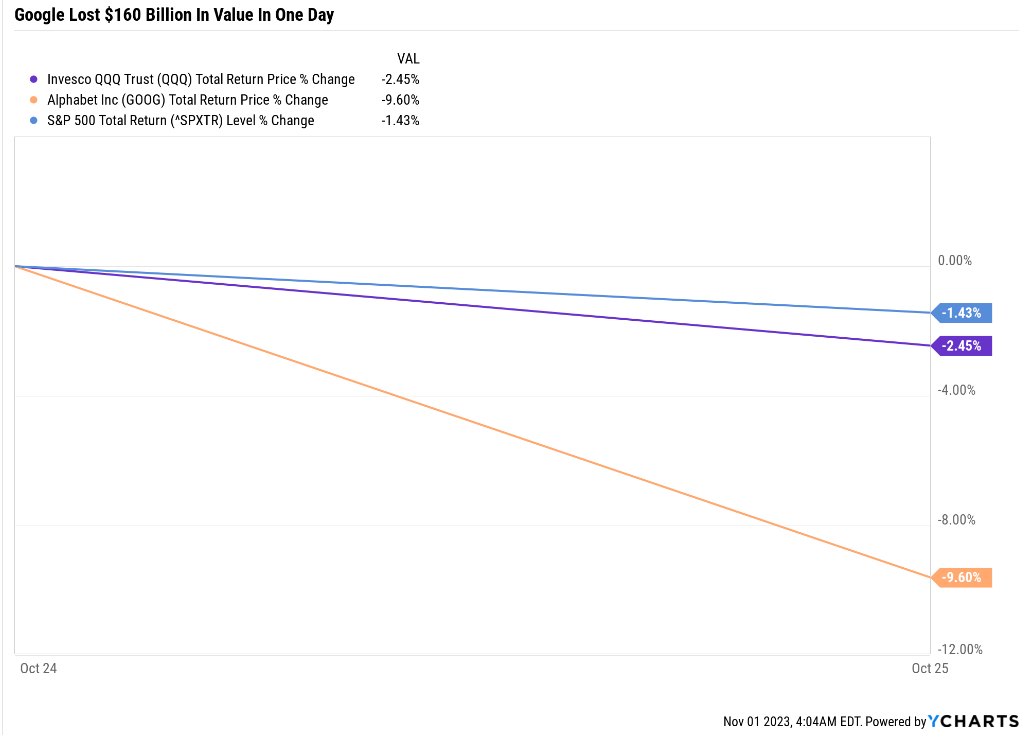
How much is $160 billion?
- 1/3rd of all U.S. charitable donations last year
- the economist estimates that much money could end global poverty for one year
- larger than the GDP of New Zealand
- stacked in $100 bills it’s a stack of money 108 miles high almost halfway to the international space station.
Why did Alphabet investors “lose” $160 billion in a day?
And is this a buying opportunity? Or a warning sign that something is broken with the company?
Is Google a value trap or a wonderful opportunity?
I understand how many investors might be nervous right now.
After all, in 2023, V.F. Corp (VFC), a dividend king with a 52-year dividend growth streak, cut its dividend not once, but twice, for a total of 82%.
Ycharts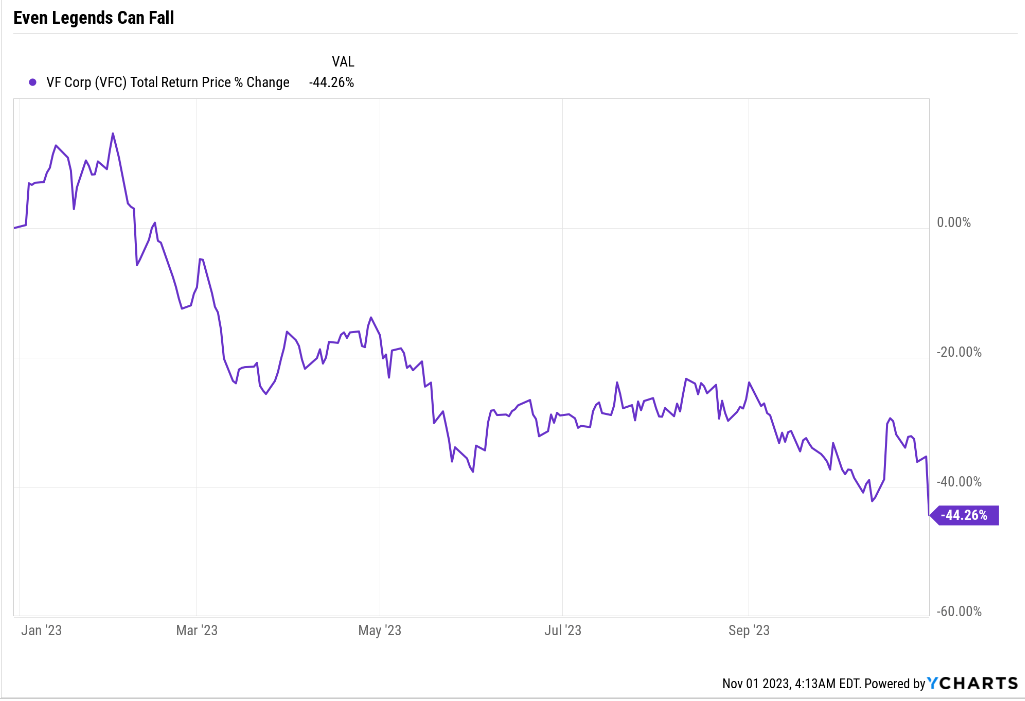
And there are several other dividend aristocrats and kings suffering an at elevated risk of following VFC this year onto the rubbish pile of failed aristocrats.
Ycharts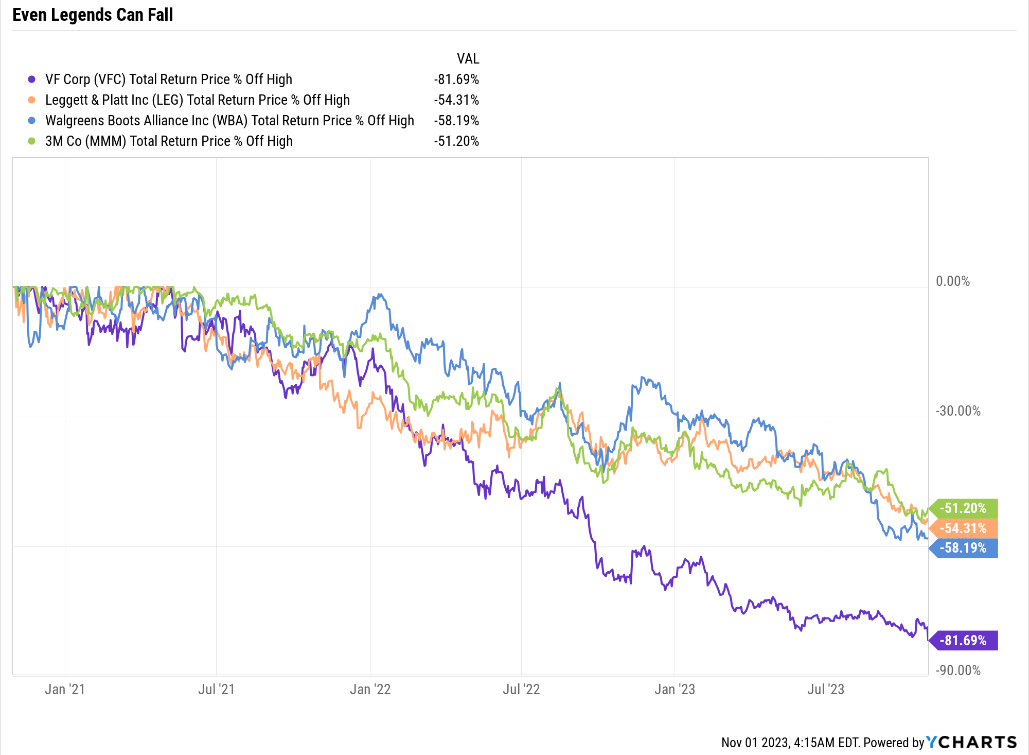
What do aristocrats have to do with Google? Simply a reminder that former glories are not a guarantee of future returns.
| Sector |
% Of Companies That Suffer Permanent 70+% Declines Since 1980 |
| Energy | 65% |
| Tech | 59% |
| Communications | 49% |
| Consumer Discretionary | 48% |
| Healthcare | 48% |
| All Sectors | 44% |
| Industrials | 39% |
| Materials | 38% |
| Financials | 29% |
| Utilities | 14% |
(Source: JPMorgan Asset Management.)
60% of tech companies have historically turned out to be disasters, falling 70% or more and never recovering.
Those that don’t go bankrupt just languish for years or even decades with investors praying to one day, break even.
Even the best investors in history, like Buffett, are dead wrong about 1/3rd of the time.
In this business, if you’re good, you’re right six times out of ten. You’re never going to be right nine times out of ten.” — Peter Lynch.
So, let me put your mind at ease about why GOOG fell 10% in a day, and is a great buying opportunity for a great company.
Ycharts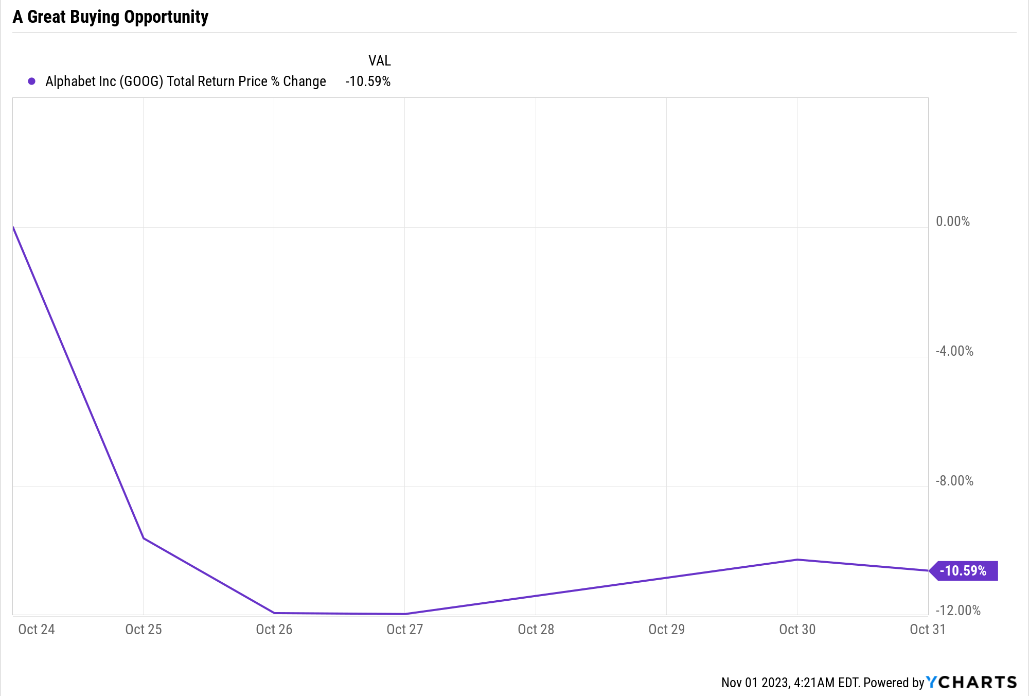
Want the bottom line up front?
Here is the most important summary sentence GOOG investors will likely ever read.
This is a life-changing company that has transformed the world, is still leading in innovation and invention, and makes modern life possible.
5 billion people worldwide use GOOG’s products and services, more than any other company in history.
Analysts expect that in 2028 GOOG will be spending $100 billion per year on growth and still generating almost $200 billion in free cash flow and sitting on a $504 billion mountain of cash after spending nearly $500 billion on buybacks over the previous six years.
If you don’t own GOOG in some way, even through exchange-traded funds (“ETFs”), you are doing long-term investing wrong;)
What Wall Street Hated About Alphabet’s Earnings
Google’s big miss wasn’t in its top or bottom line – it was in the cloud business, which reported 22% sales growth.
What’s wrong with 22% growth? Because Microsoft (MSFT) reported 29% cloud growth on the same day.
Mind you, Amazon’s (AMZN) AWS reported 12% sales growth, but analysts had been expecting that and they had forecast a lot higher growth for Google Cloud since Google Cloud is the #3 player in cloud computing.
Synergy Research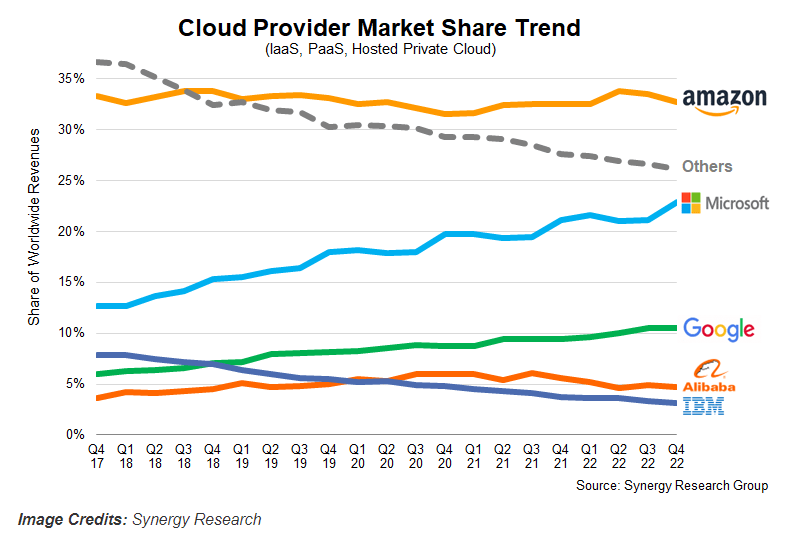
Google, Microsoft, and Amazon make up 66% of the cloud market, and Microsoft and Google are gaining market share. Amazon isn’t losing share – it’s holding its own, and everyone else is getting their lunches eaten by MSFT and GOOG.
Why The Market Is Being Silly Freaking Out About Google Cloud
Google Cloud missed growth expectations, but the question investors should be asking is “Is it still gaining market share?”
According to Synergy Research Group right now cloud computing is growing at 18%, so that means MSFT and GOOG gained market share (and Amazon lost share this quarter).
FactSet Research Terminal 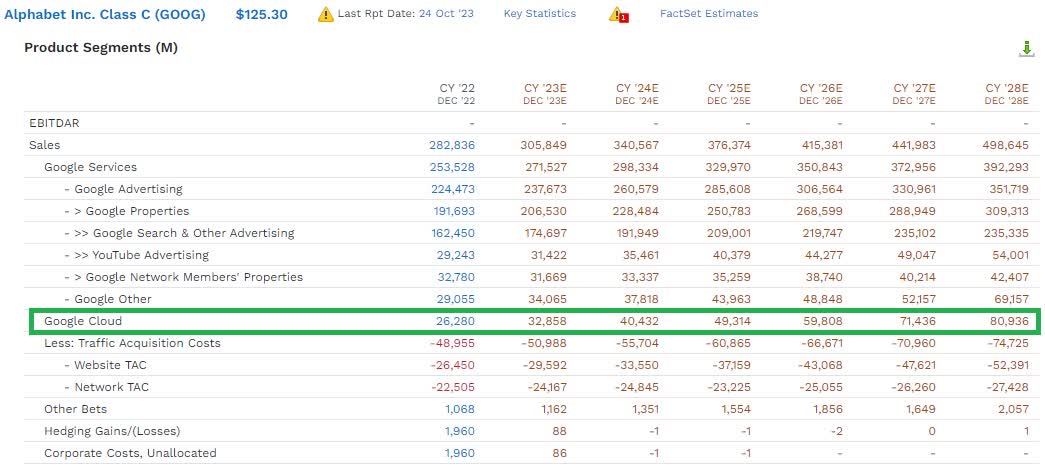
How fast is the cloud computing market expected to grow in the future? 14% through 2030 according to Grand View Research, to a $1.6 trillion market.
Google Cloud is now expected to, after the miss last week, to grow “just” 21% annually through 2028, to $81 billion in sales.
- 5X the revenue of the NFL
- in $100 bills a stack of cash 54 miles high.
And that’s just the cloud business! 84% of its business in 2028 is going to be cloud (we’ll get to that in a minute).
OK, but what about profits? We all know that Amazon and Microsoft are minting cash from the cloud and Google hasn’t been. Maybe all that sales growth will require the company to spend so much on R&D and growth spending that none of it will drop down to the bottom line?
FactSet Research Terminal 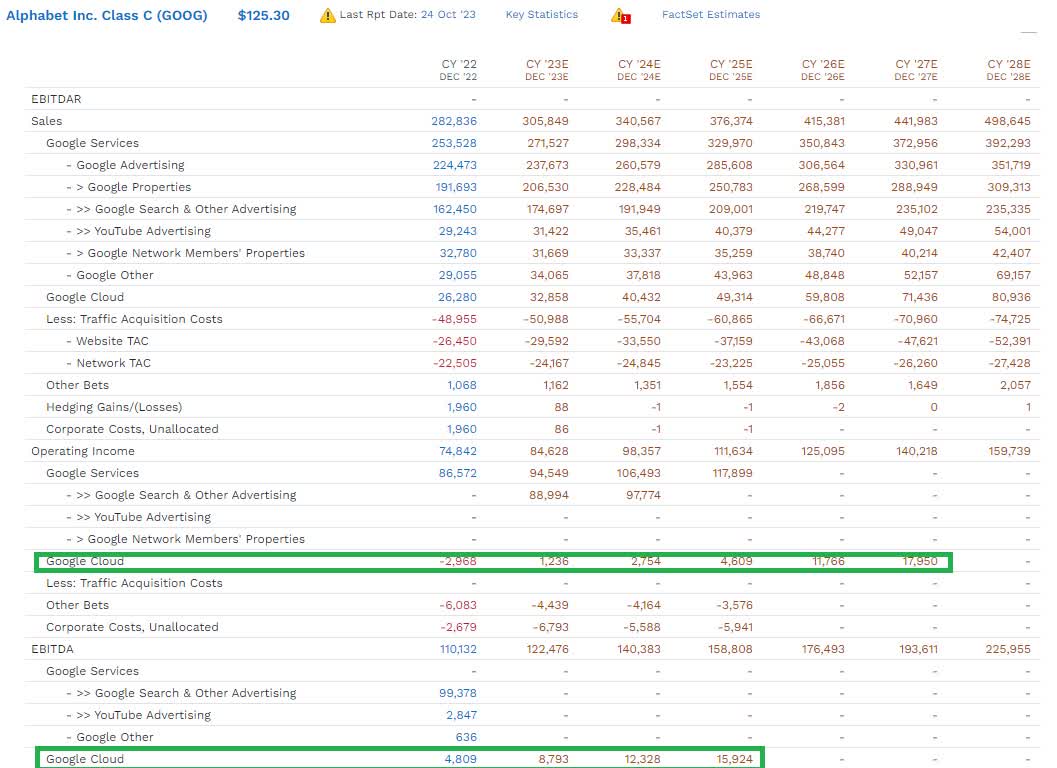
Google Cloud is newer than Azure or AWS but it’s now also profitable. Its operating profit is expected to be $1.2 billion this year, and that’s expected to grow to $18 billion by 2027, a 71% annual growth rate in profits.
- 15X growth in operating profits for cloud in 5 years.
Wall Street took 22% sales growth and 21% sales growth expected for the next five years leading to 71% profit growth and a 1400% increase in overall profits from cloud and concluded “Sell!”
My conclusion?
- Google Cloud is gaining market share
- already profitable
- profits growing like a weed
- this year is expected to generate operating profits equal to a stack of $100 bills 0.8 miles high
- on its way to $18 billion in profits equal to the Budget for NASA or a stack of $100 bills 11.8 miles high
- twice the height of commercial airliners!
Can you see why this is a great buying opportunity?
Google Is Firing On All Cylinders
Google Services, led by Google Search, is the cash cow for the company, generating 88% of sales.
Google Search is 57% of sales. And how is that doing?
Statcounter 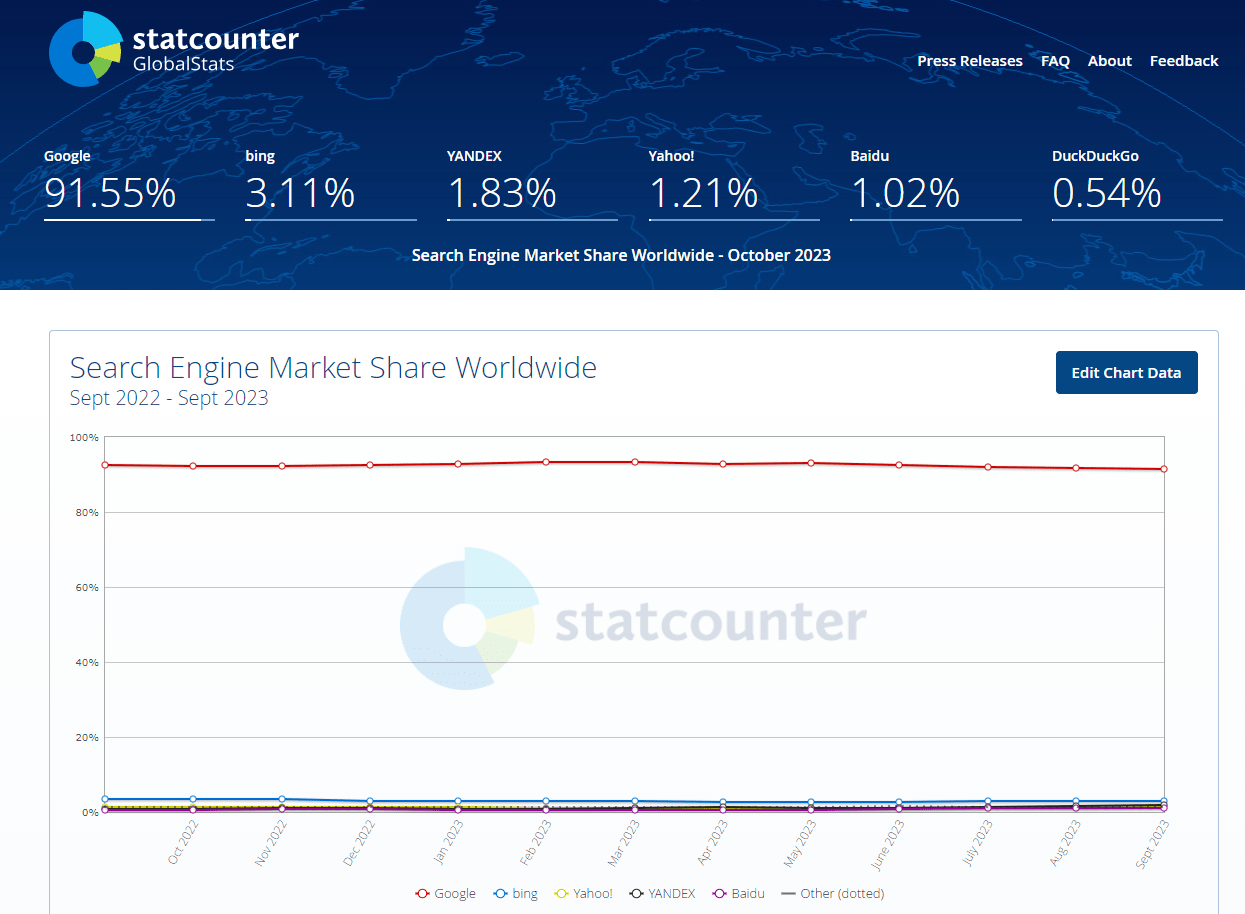
Google’s global market share in search is holding steady at 92%.
Despite Bing using ChatGPT, its market share has dropped from 3.5% to 3.1%.
Advertising has been in a recession as businesses cut back on marketing in a high-inflation environment. But take a look at the advertising business for GOOG in the last few quarters.
- Q4 2022 it shrank by 1.6%
- Q1 2023 It grew by 1.9%
- Q2 2023, it grew 4.8%
- Q3 2023, it grew 11.3% to $44 billion.
How much is $44 billion?
- more than the GDP of Serbia
- a stack of $100 bills 29 miles high.
74 billion Reasons Google Isn’t A Broken Company
FactSet Research Terminal 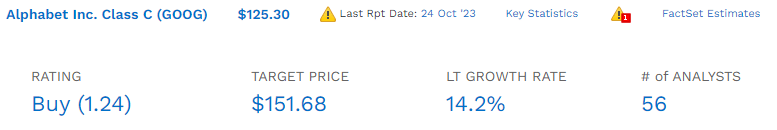
Before earnings, the median long-term growth consensus for GOOG was 16.1%, and now it’s 14.2%.
For a company this big and complex, that’s not a significant change.
- for the S&P 500 it’s 8.5% (driven by big tech).
And that’s just long-term earnings growth estimates. From the 56 people who collectively know this company better than anyone other than Google CEO Sundar Pichai.
Medium-Term Growth Consensus
| Year | Sales | Free Cash Flow | EBITDA | EBIT (Operating Income) | Net Income |
| 2022 | $282,836 | $60,010 | $110,132 | $74,842 | $59,972 |
| 2023 | $304,296 | $74,020 | $121,040 | $84,952 | $71,645 |
| 2024 | $339,262 | $87,896 | $137,389 | $98,447 | $83,080 |
| 2025 | $376,274 | $100,457 | $159,429 | $111,994 | $95,268 |
| 2026 | $411,304 | $114,535 | $174,592 | $122,527 | $104,229 |
| 2027 | $436,139 | $149,000 | $192,782 | $134,336 | $116,489 |
| 2028 | $497,207 | $167,819 | $221,758 | $156,706 | $136,825 |
| Annualized Growth 2022-2028 | 9.86% | 18.70% | 12.37% | 13.11% | 14.74% |
| Cumulative 2023-2028 | $2,364,482 | $693,727 | $1,006,990 | $708,962 | $607,536 |
(Source: FactSet Research Terminal.)
Google’s free cash flow is the ultimate source of intrinsic value for the stock, and that’s growing 19% per year.
In 2023 it’s expected to grow 23% and by 2028 reach $168 billion.
How much is $168 billion in free cash flow?
- more than the GDP of Kuwait
- a stack of $100 bills 110 miles high (reaching space).
And through 2028 Alphabet is expected to generate $693 billion in free cash flow. How much is that?
- more than the GDP of Switzerland
- a stack of $100 bills 456 miles high
- twice the altitude of the international space station.
Don’t Forget About Alphabet’s Future Dividends!
FactSet Research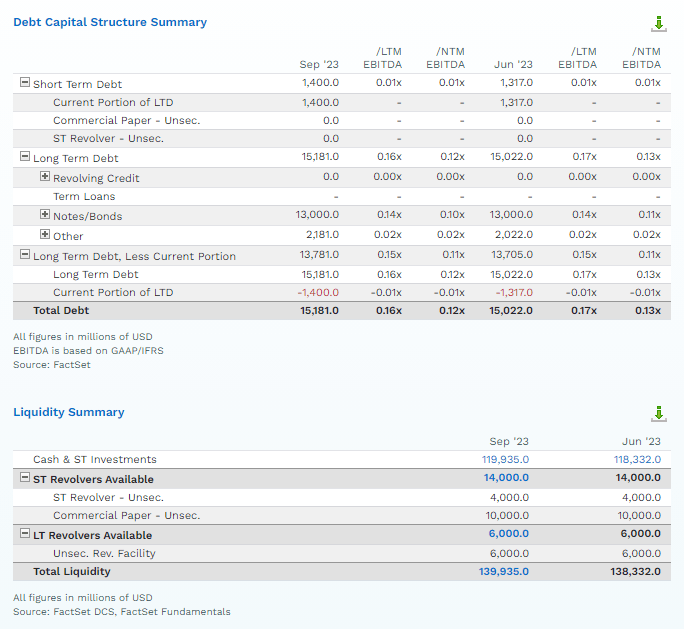
Alphabet has $120 billion in cash and almost no debt.
- more than the GDP of Ecuador
- a stack of $100 bills 78 miles high
- 12X the cruising altitude of commercial airliners.
| Year | FCF Margin | EBITDA Margin | EBIT (Operating) Margin | Net Margin |
| 2022 | 21.2% | 38.9% | 26.5% | 21.2% |
| 2023 | 24.3% | 39.8% | 27.9% | 23.5% |
| 2024 | 25.9% | 40.5% | 29.0% | 24.5% |
| 2025 | 26.7% | 42.4% | 29.8% | 25.3% |
| 2026 | 27.8% | 42.4% | 29.8% | 25.3% |
| 2027 | 34.2% | 44.2% | 30.8% | 26.7% |
| 2028 | 33.8% | 44.6% | 31.5% | 27.5% |
| Annualized Margin Growth 2022-2028 | 8.04% | 2.29% | 2.96% | 4.44% |
(Source: FactSet Research.)
Every 4th dollar drops straight to the bottom line and free cash flow margins are growing almost as fast as S&P earnings, and are expected to reach 34% by 2028.
$477 Billion In Consensus Buybacks By 2028
FactSet Research Terminal 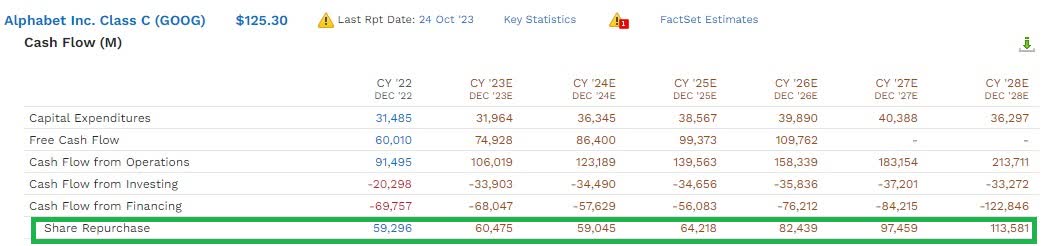
Google is a buyback machine, and the pace of buybacks is expected to nearly double by 2028 to a record $114 billion.
- to date, no company in history has ever bought back $114 billion worth of stock
- an amount of money equal to the GDP of Morocco
- or a stack of $100 bills 74 miles high
- 12X the height of Mount Everest.
So why am I convinced that GOOG will one day pay a dividend? Just like Qualcomm (QCOM), Broadcom (AVGO), MSFT, Apple (AAPL), Nvidia (NVDA), Texas Instruments (TXN), and so many other tech/growth stocks?
FactSet Research Terminal 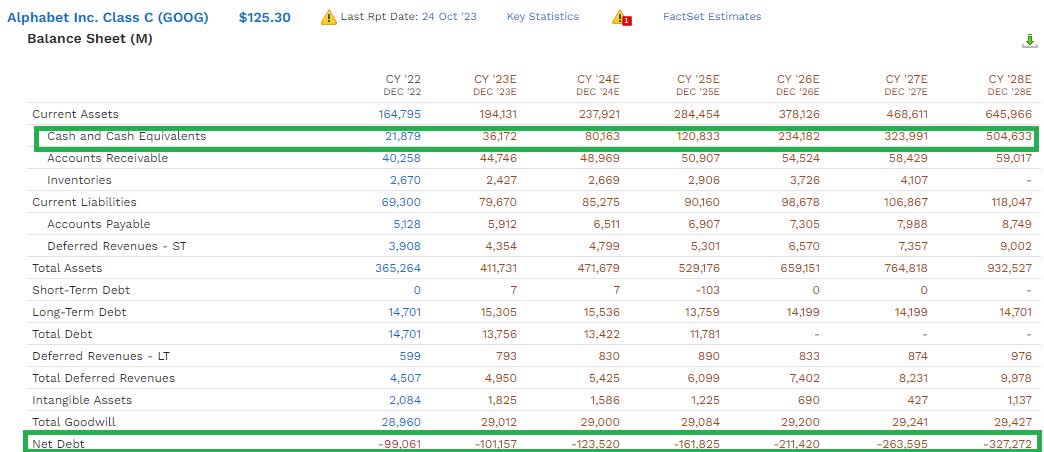
Because even with nearly $500 billion in buybacks, GOOG is expected to have $504 billion in cash by 2028 or $328 billion in net cash.
Apple had $250 billion in cash when it started paying dividends.
At some point, probably by 2029 or 2030 at the latest, GOOG’s mountain of cash is going to become so large that activist investors will call on Vanguard and BlackRock, owns of the majority of its proxy voting rights, to demand a dividend.
What about spending more on R&D and growth?
- GOOG is spending $31 billion on growth capex this year and $44 billion in R&D
- In 2028? $36 billion in growth capex spending and $61 billion in R&D.
Analysts expect that in 2028 GOOG will be spending $100 billion per year on growth and still generating almost $200 billion in free cash flow and sitting on a $504 billion mountain of cash after spending nearly $500 billion on buybacks over the previous six years.
Valuation: A Wonderful Company At A Wonderful Price
It’s far better to buy a wonderful company at a fair price than a fair company at a wonderful price.” – Warren Buffett.
GOOG is better than a wonderful company at a fair price, it’s a downright wonderful price.
Fundamentals Summary
- fundamental safety: 98% very safe (AA+ stable credit rating, 0.29% 30-year bankruptcy risk)
- overall quality: 99% very low-risk Ultra SWAN
- credit rating: AA+ stable (0.29% 30-year bankruptcy risk)
- long-term growth consensus: 14.2%
- long-term total return potential: 14.2% vs 10.1% S&P 500
- current price: $124.08
- fair value: $162.32
- discount to fair value: 23% discount (potential strong buy) vs 1% overvaluation on S&P
- 10-year valuation boost: 2.7% annually
- 10-year consensus total return potential: 0% yield + 14.2% growth + 2.7% valuation boost = 16.9% vs 10.2% S&P
- 10-year consensus total return potential: = 377% vs 164% S&P 500.
FAST Graphs, FactSet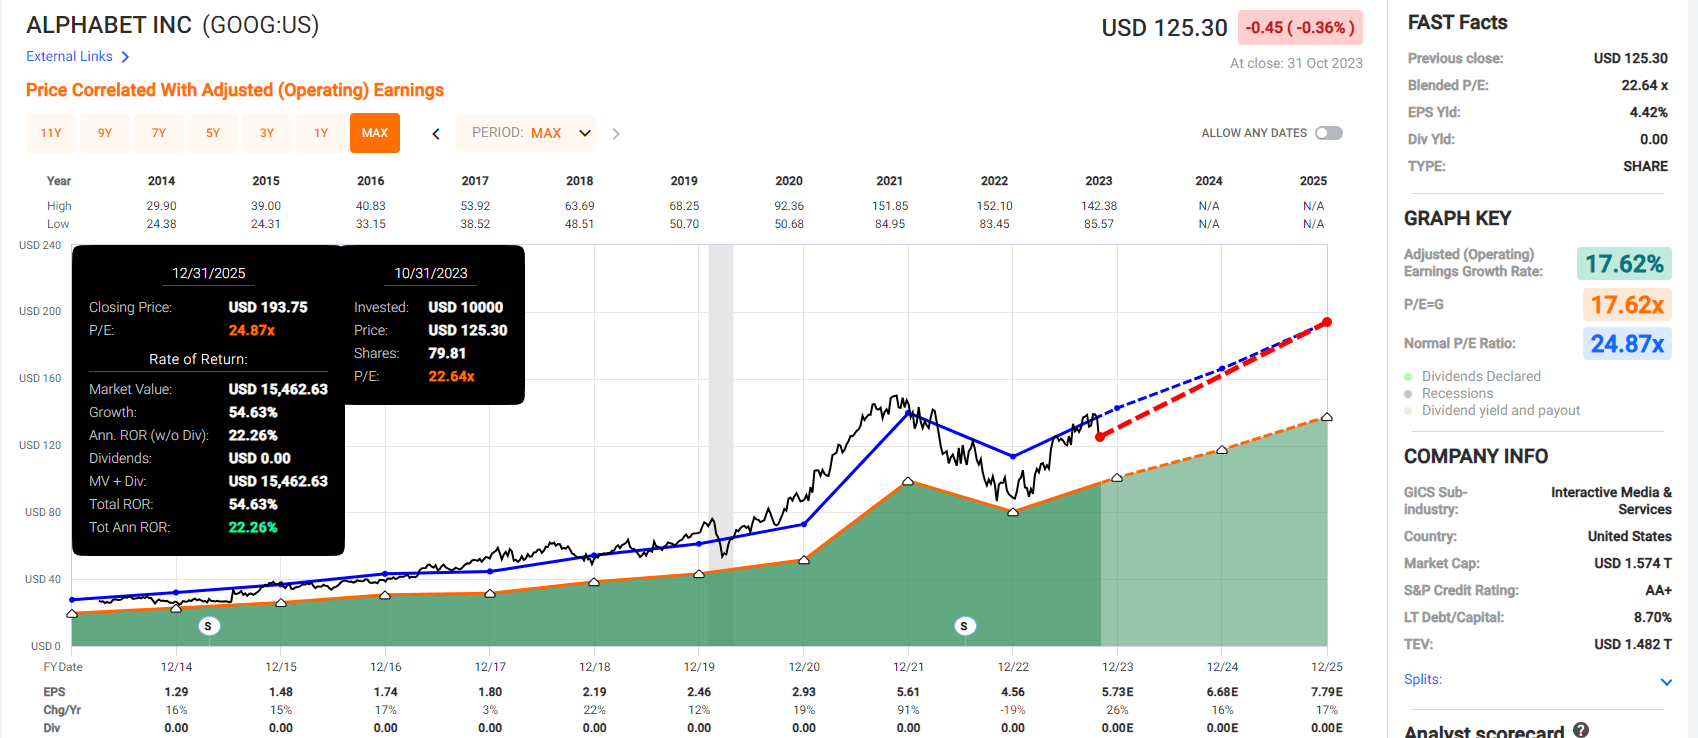
If you’re looking for Buffett-like 20+% return potential for the next few years, there are few lower-risk ways than GOOG.
Risk Profile: Why Google Isn’t Right For Everyone
There are no risk-free companies, and no company is right for everyone. You have to be comfortable with the fundamental risk profile.
GOOG’s Risk Profile Includes
- political/regulator risk (anti-trust threats)
- market share risk (from major rivals like AMZN, whose ads are 4X as effective as GOOG’s)
- disruption risk (web 3.0 potentially will allow everyone to own their data and monetize it, forcing GOOG to pay part of its current profits on data to users)
- M&A execution risk (lots of small bolt-on acquisitions and a lack of large M&A opportunities due to regulatory concerns over anti-trust)
- talent retention risk (tightest job market in over 50 years)
- currency risk (as sales become more international)
- cyber-security risk: hackers and ransomware
- AI disruption risk.
Morgan Stanley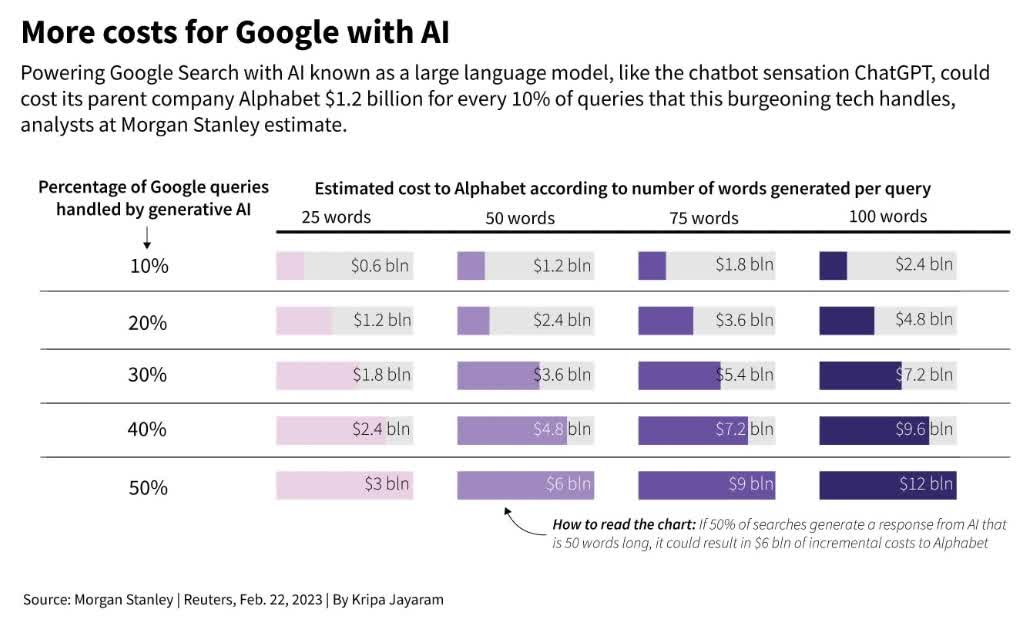
If GOOG’s BARD chatbot were to replace the existing search empire, it would cost the company $24 billion per year.
That’s a 40% hit to the bottom line, created by GOOG doing too good a job with its amazing AI chatbot.
The only other major risk is government regulation. This is the big one. GOOG is so rich and powerful the government is attempting to break them up.
How do we quantify, monitor, and track such a complex risk profile? By doing what big institutions do.
Long-Term Risk Management Analysis: How Large Institutions Measure Total Risk
We use S&P Global’s global long-term risk-management ratings for our risk rating.
- S&P has spent over 20 years perfecting its risk model
- , which is based on over 30 major risk categories, over 130 subcategories, and 1,000 individual metrics
- 50% of metrics are industry-specific
- this risk rating has been included in every credit rating for decades.
Our risk rating is based on the global percentile of how a company’s risk management compares to 8,000 S&P-rated companies covering 90% of the world’s market cap.
GOOG Scores 97th Percentile On Global Long-Term Risk Management And GOOG Scores 93rd
S&P’s risk management scores factor in things like:
- supply chain management
- crisis management
- cyber-security
- privacy protection
- efficiency
- R&D efficiency
- innovation management
- labor relations
- talent retention
- worker training/skills improvement
- occupational health & safety
- customer relationship management
- business ethics
- climate strategy adaptation
- sustainable agricultural practices
- corporate governance
- brand management.
| Classification | S&P LT Risk-Management Global Percentile |
Risk-Management Interpretation |
Risk-Management Rating |
| BTI, ILMN, SIEGY, SPGI, WM, CI, CSCO, WMB, SAP, CL | 100 | Exceptional (Top 80 companies in the world) | Very Low Risk |
| Alphabet | 93 |
Exceptional |
Very Low Risk |
| Strong ESG Stocks | 86 |
Very Good |
Very Low Risk |
| Foreign Dividend Stocks | 77 |
Good, Bordering On Very Good |
Low Risk |
| Ultra SWANs | 74 | Good | Low Risk |
| Dividend Aristocrats | 67 | Above-Average (Bordering On Good) | Low Risk |
| Low Volatility Stocks | 65 | Above-Average | Low Risk |
| Master List average | 61 | Above-Average | Low Risk |
| Dividend Kings | 60 | Above-Average | Low Risk |
| Hyper-Growth stocks | 59 | Average, Bordering On Above-Average | Medium Risk |
| Dividend Champions | 55 | Average | Medium Risk |
| Monthly Dividend Stocks | 41 | Average | Medium Risk |
(Source: DK Research Terminal.)
No risk-free companies exist, but GOOG is one of the lowest-risk ways to earn double-digit market-beating returns in the future, according to S&P.
How We Monitor GOOG’s Risk Profile
- 53 analysts
- two credit rating agencies
- 55 experts who collectively know this business better than anyone other than management.
When the facts change, I change my mind. What do you do, sir?” – John Maynard Keynes
There are no sacred cows here. Wherever the fundamentals lead, we always follow. That’s the essence of disciplined financial science, the math behind retiring rich and staying rich in retirement.
Bottom Line: Buy Alphabet Today And You Won’t Regret It
Let me repeat the most important summary sentence you’ll ever read about Alphabet.
Analysts expect that in 2028 GOOG will be spending $100 billion per year on growth and still generating almost $200 billion in free cash flow and sitting on a $504 billion mountain of cash after spending nearly $500 billion on buybacks over the previous six years.
I can’t tell you if GOOG will be up a week from now, a month from now, or even a year from now.
I can tell you that if you buy it today, I can say with 80% “I’ll die on this hill” confidence that you will be thrilled you did in 5+ years.
GOOG isn’t broken; it wasn’t overvalued when it fell 10% in a single day after it reported cloud sales were “only” growing 22%.
The selloff was 100% unjustified by fundamentals, and here is one final reminder about why you should seriously consider buying GOOG right now.
GOOG Is A Wonderful Company At A Wonderful Price
FAST Graphs, FactSet
Analyst’s Disclosure: I/we have no stock, option or similar derivative position in any of the companies mentioned, and no plans to initiate any such positions within the next 72 hours. I wrote this article myself, and it expresses my own opinions. I am not receiving compensation for it (other than from Seeking Alpha). I have no business relationship with any company whose stock is mentioned in this article.
Seeking Alpha’s Disclosure: Past performance is no guarantee of future results. No recommendation or advice is being given as to whether any investment is suitable for a particular investor. Any views or opinions expressed above may not reflect those of Seeking Alpha as a whole. Seeking Alpha is not a licensed securities dealer, broker or US investment adviser or investment bank. Our analysts are third party authors that include both professional investors and individual investors who may not be licensed or certified by any institute or regulatory body.
—————————————————————————————-

Dividend Kings helps you determine the best safe dividend stocks to buy via our Automated Investment Decision Tool, Zen Research Terminal, Correction Planning Tool, and more.
Membership also includes
-
Access to our 13 model portfolios (all of which are beating the market in this correction)
-
my $2.5 million charity hedge fund
-
50% discount to iREIT (our REIT-focused sister service)
-
real-time chatroom support
-
real-time email notifications of all my retirement portfolio buys
-
numerous valuable investing tools
Click here for a two-week free trial, so we can help you achieve better long-term total returns and your financial dreams.