Summary:
- Of the nine companies (an ETF is on the list) on our Terrific Ten list, eight are rated as narrow or wide moat by Morningstar.
- All of the Terrific Ten notched total returns that beat the S&P 500 Index over the last five years.
- In fact, excluding dividends, the Terrific Ten more than doubled the return for the S&P 500 over the last five years.
Bluberries
This article was published at iREIT on Alpha on Tuesday May 23, 2023. This article was coproduced with Chuck Walston.
Although I am invested in roughly 125 companies, the Terrific Ten comprise nearly a quarter of my portfolio. I suspect that over time these ten will constitute a growing percentage of my investments.
The average 5-year dividend growth rate for the ten is 17.52%. Coincidentally, the average yield for the Terrific Ten is now roughly 17.5% higher than the 4-year average dividend yield for these stocks.
One could make a reasonable assertion that the Terrific Ten are trading for reasonable valuations: the average 5-year PEG ratio for the ten is 1.69x.
Each company has strong competitive advantages within its industry. The two companies highlighted in this article, The Home Depot, Inc.(NYSE:HD) and Taiwan Semiconductor Manufacturing Company Limited (NYSE:TSM), are prime examples of how the Terrific Ten dominate rivals.
A Quick Review Of Home Depot’s Recent Results
Home Depot provided Q1 results last week. Following the earnings call, the shares dropped about 4%. As I write these words, the stock has recovered and now trades a bit above last week’s valuation.
The home improvement retailer reported EPS of $3.82, beating consensus by $0.03. However, investors focused on a big revenue miss: Analysts’ forecast was for $38.3 billion, but the company only brought in $37.26 billion. That is a 4.2% year-over-year drop and the biggest revenue miss since 2002.
A second negative stems from management’s guidance. Sales are projected to drop 2% to 5% in FY23, and EPS is expected to fall between 7% and 13%. Previously sales were expected to be flat.
The company also forecasts an operating margin in the range of 14% to 14.3%, well below the target of around 14.5%.
Average spending per customer was flat, but declines in customer traffic improved to 5% from 6% in the prior quarter. Management noted that consumers pulled back on big-ticket and discretionary purchases. Furthermore, some of the declines in revenue are related to unseasonable weather and falling lumber prices.
One should take into account that Home Depot grew sales by over $47 billion over the last three years. Therefore, an argument can be made that the company is doing well by simply increasing EPS over difficult comps and an environment marked by a slowdown in home sales and robust inflation.
How HD Reigns Over Rivals
As the largest home-improvement retailer in the world, Home Depot possesses a significant scale advantage. That scale advantage provides negotiating leverage with suppliers and advertisers. In turn, savings from scale are used to buttress the bottom line and to provide consumers with lower prices. This places smaller competitors at a distinct disadvantage. To compete with Home Depot’s prices, they must settle for lower profit margins.
To understand the difference in scale, note that HD has roughly seven times as many stores as Menard’s, the third largest home improvement retailer in the U.S.
Home Depot also owns approximately 90% of its stores, including those on leased ground. Once again, this aids in lowering costs to consumers and increases the firm’s bottom line.
Furthermore, 90% of the U.S. population lives within ten miles of a Home Depot store.
This is of particular importance in terms of meeting the demands of professional customers. A Pro operating in a large metropolitan area can generally travel a relatively short distance to obtain the supplies needed to complete their customer’s projects.
The importance of Pro customers cannot be overstated. For example, Home Depot’s pro sales are roughly equal to 80% of rival Lowe’s Companies, Inc. (LOW) total revenue. This is true even though only 4% of store visits are by pro customers. While about a quarter of Lowe’s sales are derived from Pros, about half of Home Depot’s sales are from professional customers.
Home Depot fares better than most retailers during periods of macroeconomic malaise. Consider this: in 2008, shares of HD beat the S&P 500 by 23.9% and in 2020 by 5.3%. This is largely due to the fact that roughly two-thirds of Home Depot’s sales are for non-discretionary items. If your water heater, dishwasher, stove or commode cease to work, a trip to a home improvement store is a near necessity.
While HD is experiencing a rough patch, I would argue that it simply pushes demand for its products down the road. There are a number of factors that support this contention.
Homes in the U.S. are aging. U.S. housing stock is now the oldest on record. In 2001, the median age of an owner-occupied home was 31 years. Fast forward to 2021, and that figure stood at 41 years. Older homes require more repairs and upgrades. For example, owners of homes built prior to 1940 spent almost twice the sum on energy-efficiency projects as owners of homes built after the year 2000.
There is also a growing trend for homeowners to age in place. This is resulting in a surge in modifications designed to increase accessibility. In 2020 and 2021, 1.1 million homes underwent one of more projects designed to improve accessibility for people with limited mobility.
Once the economy returns to normal and the housing market fires back up, I believe sales and revenue for HD will surge.
Taiwan Semiconductor
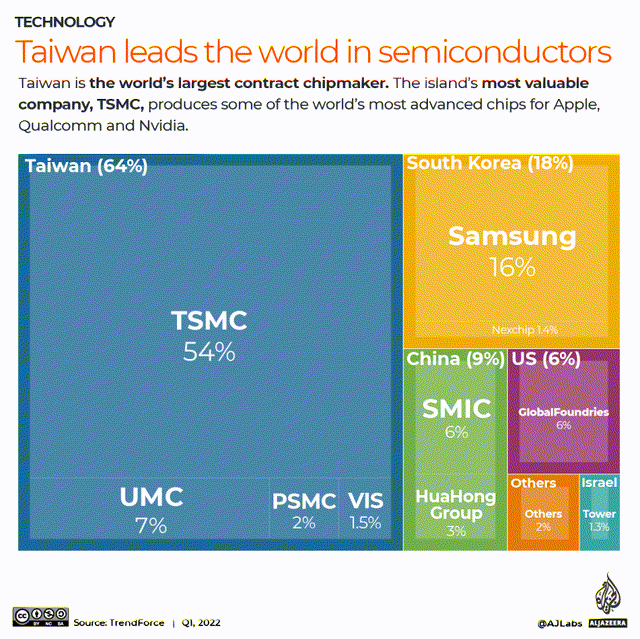
While Home Depot overpowers rivals, it cannot hold a candle to the dominance displayed by TSM. The following chart provides an insight into the lead the firm holds over rivals.
TrendForce
However, as strong as the above metrics may appear, they only provide a partial picture of the sway TSM holds over the chip industry. While TSM commands over half the semiconductor market, the company’s share of advanced processors constitutes approximately 90% of global sales.
One must understand that TSM’s products are absolutely essential to a variety of industries. For example, for most of 2021 automakers cut production, to the tune of over 7 million vehicles, due to a chip shortage.
A recent article in The Wall Street Journal revealed that the company supplies automakers with roughly 60% of that industry’s semiconductor needs. TSM also produces the lion’s share of the world’s 1.4 billion smartphone processors.
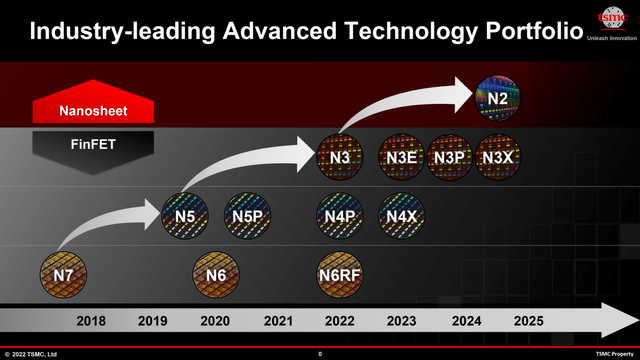
Since the early 2000s, TSM has led the industry in node development. Due to its position as the globe’s technological leader, the company harvests gross and operating margins at least twice that of its closest rivals.
Now consider that the production of semiconductors is incredibly complex. Manufacturing a chip requires about 1,500 steps, each with 100 to 500 variables. Furthermore, the production of advanced chips requires a great deal of capex. To manufacture advanced chips, TSM employs as many as 20 ultraviolet lithography machines costing $175 million each in the company’s larger fabrication plants.
Combine all of the above factors, and you have: a) a technology leader b) that is generating industry-leading profit margins and that c) funnels prodigious levels of capex back into production facilities and R&D.
TSMC – Investor Relations
This results in a large, resilient and expanding moat.
An example lies in TSM’s new fabrication plant in southern Taiwan. The size of 22 football fields, the facility will produce 3nm chips that will operate at higher speeds with lower energy consumption than rivals’ products.
HD & TSM: Debt, And Dividend
HD has a current yield of 2.87%. The payout ratio is a bit below 36%, and the 5-year dividend growth rate is 16.06%.
TSM yields 1.94%. The payout ratio is 28.51%, and the 5-year dividend growth rate is 9.26%.
HD has an A rated credit.
TSM’s debt is rated AA-/stable by S&P and Aa3/stable by Moody’s.
HD And TSM: Buy, Sell, Or Hold?
A retailer that’s immune to recessions? No such animal exists. The same holds true of chip manufacturers.
Nonetheless, Home Depot’s current 5-year PEG is 1.74x, well below the stock’s average PEG ratio over the last five years of 2.26x. HD’s current yield of 2.87% beats the highest annual yield over the last decade, with the single exception of when COVID drove the stock down to the point that the yield hit 3.67%.
I contend that higher mortgage rates and a recession will only serve to push the need for home improvement down the road. That means demand will eventually surge. Consequently, I believe HD represents a reasonable investment at this juncture.
I rate The Home Depot, Inc. stock as a BUY.
My sole caveat is that there is a good chance we will see a more attractive price on the stock before year’s end. Nonetheless, I added marginally to my position in HD today.
A slowdown in demand for smartphones and personal computers, combined with ever present talks of a recession are weighing on chip stocks. However, that has TSM’s shares valued at a forward P/E that is more than three points below the stock’s 5-year average for that metric.
There is no company that dominates its industry as does TSM; and the firm’s products are absolutely essential to modern life.
Like HD, I consider TSM to be a reasonable investment at this point in time.
I rate Taiwan Semiconductor Manufacturing Company Limited shares as a BUY.
And just like HD, I would limit the number of shares I would invest in due to the likelihood that a recession lies on the horizon.
Analyst’s Disclosure: I/we have a beneficial long position in the shares of HD, TSM either through stock ownership, options, or other derivatives. I wrote this article myself, and it expresses my own opinions. I am not receiving compensation for it (other than from Seeking Alpha). I have no business relationship with any company whose stock is mentioned in this article.
Author's note: Brad Thomas is a Wall Street writer, which means he's not always right with his predictions or recommendations. Since that also applies to his grammar, please excuse any typos you may find. Also, this article is free: Written and distributed only to assist in research while providing a forum for second-level thinking.
Seeking Alpha’s Disclosure: Past performance is no guarantee of future results. No recommendation or advice is being given as to whether any investment is suitable for a particular investor. Any views or opinions expressed above may not reflect those of Seeking Alpha as a whole. Seeking Alpha is not a licensed securities dealer, broker or US investment adviser or investment bank. Our analysts are third party authors that include both professional investors and individual investors who may not be licensed or certified by any institute or regulatory body.
Get My New Book For Free!
Join iREIT on Alpha today to get the most in-depth research that includes REITs, mREIT, Preferreds, BDCs, MLPs, ETFs, and we recently added Prop Tech SPACs to the lineup. Nothing to lose with our FREE 2-week trial.

And this offer includes a 2-Week FREE TRIAL plus my FREE book.
