Summary:
- Procter & Gamble is a global consumer products giant operating within an attractive segment of the consumer products industry.
- Given its valuation, the upside potential resulting from the multiple expansion remains limited.
- The Company expects to deliver even higher shareholder rewards in 2025, and there’s no reason to doubt their estimates given the business’s profitability, stability, and cash generation.
- Its long track record of dividend growth, combined with meaningful share repurchases and high, above-its-peers profitability, make the Company a worth-holding part of a well-structured portfolio.

amgun/iStock via Getty Images
Procter & Gamble (NYSE:PG) is a global consumer products giant operating within an attractive segment of the consumer products industry. ‘Why attractive?’ one may ask. In the long term, its products are for everyday use and are not accompanied by negative trends. Unlike Coca-Cola (KO) products (non-critical articles), PG offers a broad portfolio of products that are and will be a part of our lives. The most we can do is switch a producer, but I assume nobody will let go of laundry powders or dish soap soon.
I own a certain stake of shares in PG, and the Company has served my portfolio well due to capital appreciation and meaningful shareholder rewards resulting from its Dividend King status. After its FY 2024 results were published, I decided to take another look at the Company and verify my previous ‘hold’ rating.
Previous and Updated Investment Thesis
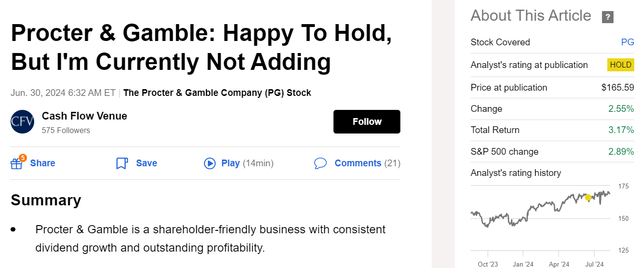
The last time I covered PG, I assigned it a ‘hold’ rating. Since then, the Company’s stock price increased by ~2.6%, constituting a total return of ~3.2%, while the S&P 500 rose 2.9%. Should you be willing to get a better grasp of the development of my views on PG, please refer to the link below:
- Procter & Gamble: Happy To Hold, But I’m Currently Not Adding
With decent FY 2024 performance, reaffirming PG’s leadership position in numerous market segments, high profitability, meaningful shareholder returns, and upheld ability to grow the scale of its business, I am satisfied with the business update.
On the valuation front, while its stock price has increased slightly, the EV/EBITDA multiple remains below my previously announced target of 18-19x. PG’s reaching 18.0x EV/EBITDA is a conservative scenario, as this level would be well-deserved for such a high-quality industry leader. Although the upside resulting from the multiple expansion is insignificant, it is still present and can serve as a margin of safety. Nevertheless, I am not adding to my PG position, as my yield-on-cost or average price per share is noticeably lower than the current point and I would enjoy a higher margin of safety to involve more resources into PG.
To put it briefly, I am happy to hold, but I recognize better opportunities in the market.
Valuation Outlook
The stock price is one thing; the valuation is another
The Company’s stock price has been increasing dynamically for a couple of months, which may lead some investors to question whether PG is overvalued.
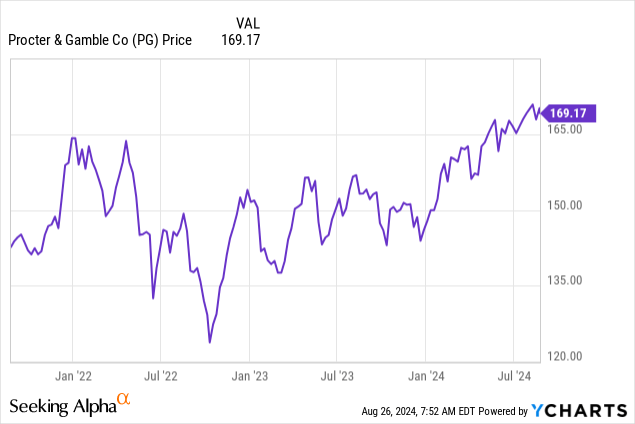
The multiple valuation method comes to our safety, as utilizing so-called ‘multiples’ facilitates the determination of whether a given stock price is justified, as these multiples are a combination of a given ‘value’ metric and a given ‘financial results’ metric.
As an M&A advisor, I usually rely on the multiple valuation method, a leading tool in transactional processes. This method allows for accessible and market-driven benchmarking. Using EV/EBITDA multiple is generally a rule of thumb for most sectors, especially mature ones.
Procter & Gamble’s historical valuation
That said, let’s analyze PG’s Enterprise Value and EBITDA for the last three years, as depicted in the charts below.
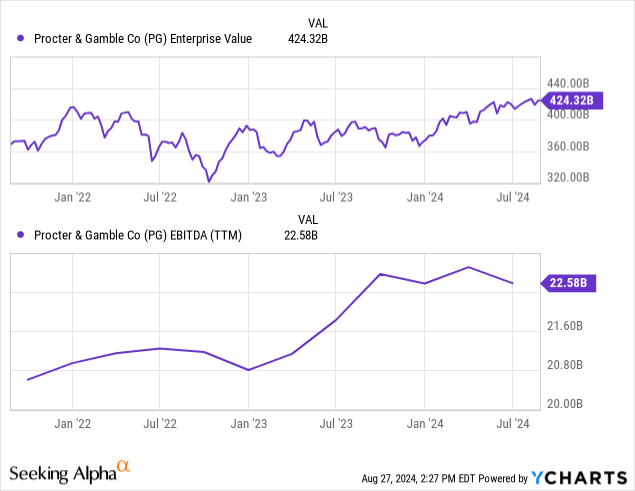
Combining the above metrics leads us to the forward-looking EV/EBITDA multiple. One also has to be aware that the multiple valuation method allows us to properly include stock issues or repurchases, which also impact the stock price and can lead to misconceptions regarding the ‘over’ or ‘under’ valuation.
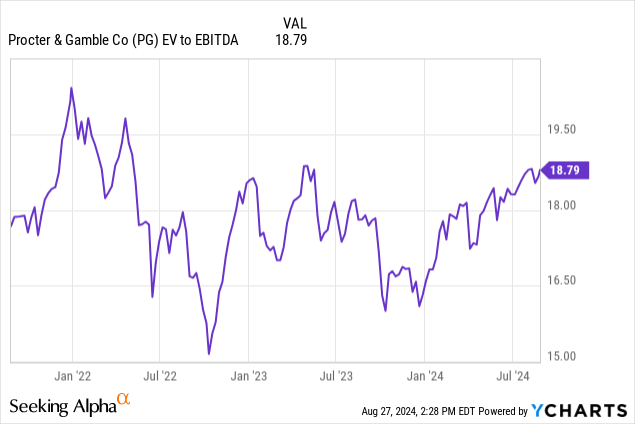
Moving beyond Procter & Gamble – let’s factor in some of its peers
Regardless of the above charts, let’s take a look at the forward-looking EV/EBITDA, which stood at:
As we can observe, PG trades with a discount to CL and a substantial premium to KMB. I believe the premium to KMB is justified by a better product portfolio, significantly higher profitability, and better sales growth decomposition. On the other hand, CL trades at a premium despite slightly lower profitability due to the higher net sales growth, driving shareholders’ expectations. I believe that PG is fairly valued, and while the upside potential from the multiple expansion is still there, it remains limited.
Procter & Gamble: FY 2024 Overview
The business keeps on growing
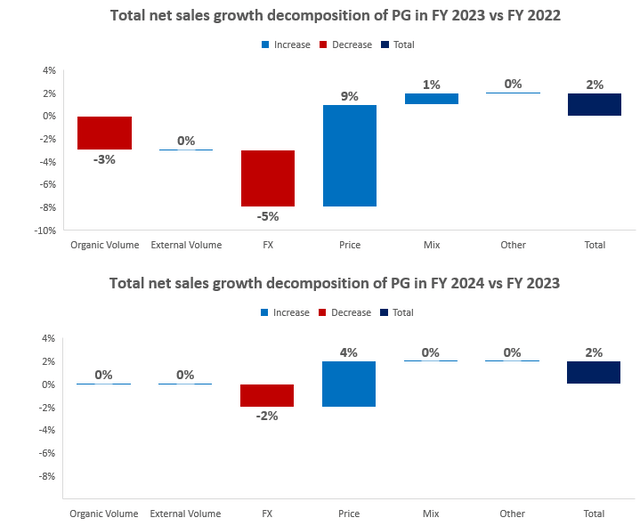
Firstly, let’s compare the net sales growth PG recorded in FY 2024 vs. FY 2023 to that recorded in FY 2023 vs. FY 2022. While the result was the same, with 2% net sales growth in each case, the growth drivers differed.
In FY 2024, the growth was accomplished through:
- 4% positive pricing effect
- somewhat offset by a negative 2% foreign exchange effect
However, in FY 2023, the growth was realized through:
- 9% positive pricing effect
- supported by a 1% positive mix effect
- somewhat offset (potentially through increased pricing) negative 3% volume effect
- followed by a negative 5% FX effect
Please review the charts below for details.
Ideally, I’d like to observe a positive organic volume effect; however, I still consider FY 2024 as an improvement compared to FY 2023, as the FX effect wasn’t as extensive, the Company didn’t have to utilize its pricing power so much, and the volume was steady instead of declining.
Please review the table below for more details regarding the growth decomposition of PG’s specific business segments.
Frankly speaking, PG delivered a strong performance during FY 2024, likely the main driver of its EV/EBITDA expansion. To quote from its latest Earnings Call:
Fiscal ’24 was another very strong year. Execution of our integrated strategies enabled the company to meet or exceed going-in guidance ranges for organic sales growth, core EPS growth, cash productivity and cash return to share owners, all this despite significant market level headwinds that were largely unknown when we gave our initial outlook for the year.
(…)
Focus markets grew 4% for the year with North America up 5% and Europe focus markets up 8%. (…) Enterprise markets were up 6%, led by Latin America with 15% organic sales growth. Ecommerce sales increased 9%, now representing 18% of the total company.
However, the Company didn’t operate without being accompanied by significant market headwinds, which took its toll in, inter alia, Greater China:
Greater China organic sales were down 9% versus the prior year, driven by soft market conditions and brand-specific headwinds on SK-II.
High profitability reflects PG’s competitive edge
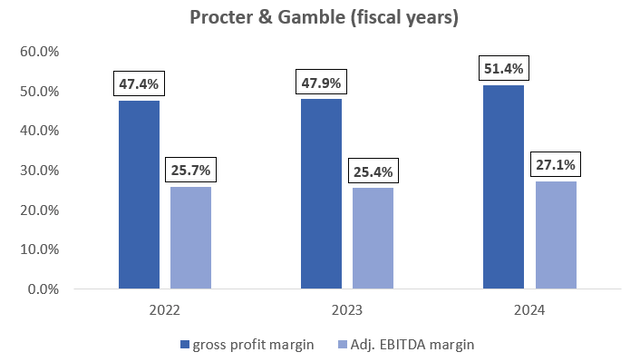
During the last three fiscal years, PG generated gross profit margins ranging from 47.4% to 51.4%, and adj. EBITDA margin ranging from 25.4% to 27.1%. Please note that I included Net sales, Cost of goods sold, SG&A expenses, and other expenses in the Operating Income calculation, then adjusted for depreciation and amortization costs to get EBITDA. I also adjusted the EBITDA margin for impairment charges for intangible assets. Please review the chart below for details.
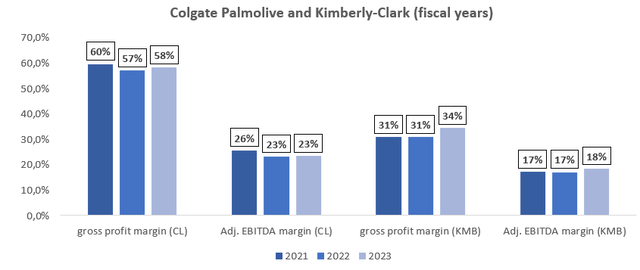
When it comes to Colgate-Palmolive and Kimberly-Clark:
- CL typically generates a higher gross profit margin but a slightly lower adj. EBITDA margin
- KMB typically generates substantially lower gross profit and adj. EBITDA margins
Please review the charts below for details. Remember that these are big-picture comparisons for fiscal years, as PG’s fiscal year differs from CL’s and KMB’s.
Author based on CL and KMB
High margins directly translate into cash-generative business and substantial shareholder rewards
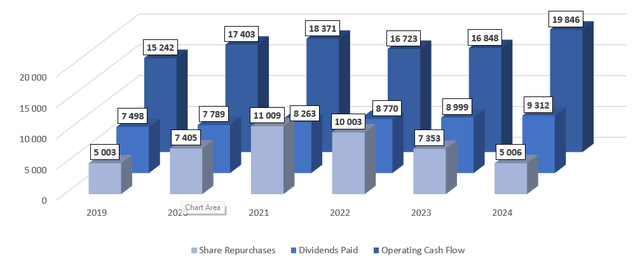
Thanks to the relatively high profitability that PG showcases, it generates substantial cash from operating activities, which totaled $104.4B during the 2019–2024 period. Such a cash-generative business supports PG’s shareholder rewards policy and allows the Company to record:
- $50.6B of dividends paid in the abovementioned period
- $45.8B of share repurchases in the abovementioned period
Please review the chart below for details.
The Company expects to deliver even higher shareholder rewards in 2025, and there’s no reason to doubt their estimates given the business’s profitability, stability, and cash generation.
We expect adjusted free cash flow productivity of 90% for the year. This includes an increase in capital spending as we add capacity in several categories. We expect to pay around $10 billion in dividends and to repurchase $6 billion to $7 billion of common stock, combined a plan to return $16 billion to $17 billion of cash to share owners this fiscal year.
The Bottom Line
Naturally, there are some risk factors to consider while analyzing PG, inter alia:
- exposure to foreign exchange fluctuations
- exposure to the geopolitical risks accompanying each region due to global operations
- the market is highly competitive
- potential recession may weaken consumers
Nevertheless, PG is a top-tier business with a reliable and sustainable business model that is not going anywhere. Its long track record of 134 consecutive years of dividend payments and 68 consecutive years of dividend growth, combined with meaningful share repurchases and high, above-its-peers profitability, make the Company a worth-holding part of a well-structured portfolio.
Given its valuation, the upside potential resulting from the multiple expansion remains limited. I uphold my ‘hold’ rating on PG and will happily collect dividends and potentially add during a pullback. Thank you!
Analyst’s Disclosure: I/we have a beneficial long position in the shares of PG, CL either through stock ownership, options, or other derivatives. I wrote this article myself, and it expresses my own opinions. I am not receiving compensation for it (other than from Seeking Alpha). I have no business relationship with any company whose stock is mentioned in this article.
The information, opinions, and thoughts included in this article do not constitute an investment recommendation or any form of investment advice.
Seeking Alpha’s Disclosure: Past performance is no guarantee of future results. No recommendation or advice is being given as to whether any investment is suitable for a particular investor. Any views or opinions expressed above may not reflect those of Seeking Alpha as a whole. Seeking Alpha is not a licensed securities dealer, broker or US investment adviser or investment bank. Our analysts are third party authors that include both professional investors and individual investors who may not be licensed or certified by any institute or regulatory body.

