Summary:
- Extreme bullish sentiment in Cisco suggests a price correction; target $62 for current holders, with better buying opportunities below $56 in the coming months.
- Parallel trend channels and Bollinger Bands indicate a potential price consolidation, signaling a prudent time to lighten positions at $62.
- Long-term RSI shows Cisco’s rally isn’t over, supporting a $62 target before a possible intermediate-term correction.
- Technical analysis highlights the importance of timing; wait for a Green Zone reading to buy when investor sentiment turns bearish.
hapabapa
Cisco (CSCO) posted adjusted earnings of $0.91 per share for the October quarter, compared to $1.11 per share in the same period of 2024. Revenue was also down somewhat. The indicators we follow suggest caution over the intermediate term as there are already “too many” CSCO bulls. This level of bullish sentiment almost always precedes a price correction and better buying opportunities over the next few months. We have an upward price target of $62 for CSCO for those who already own it.
Remember, technical analysis can’t tell you “what” to buy and sell, but it can help you determine “when” to buy and sell it.
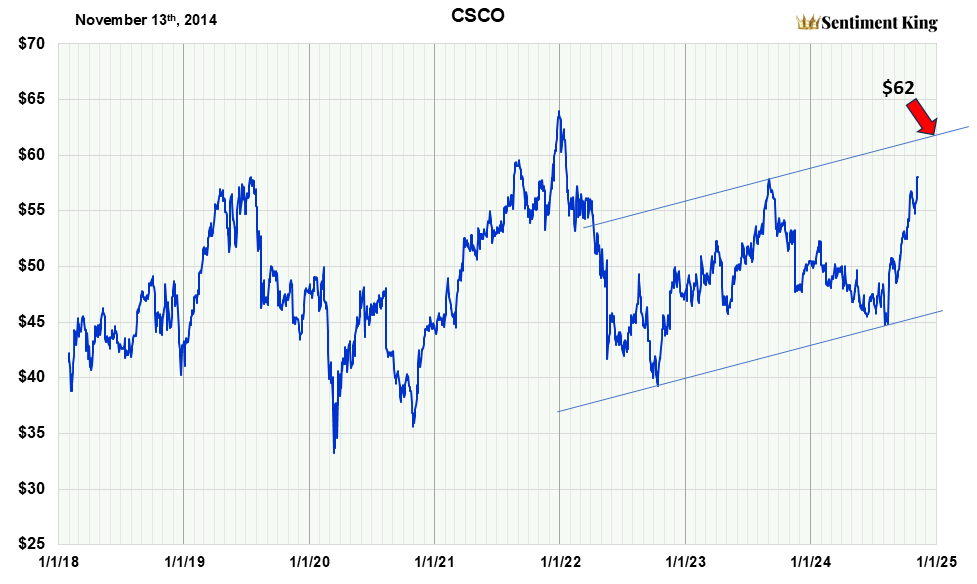
Parallel Trend Channels For Cisco
The chart below shows the closing value of CSCO since 2018. The situation has progressed to the point where we can draw two parallel trend lines since there are now two well defined lows that form the lower line. From that we form a parallel upper line from the top made in September of 2023. This trend channel is not something made in stone but provides reference points to orient around.
We believe the extreme level of bullish expectations for CSCO, which you’ll see in the next chart, gives this upper trend line a high probability of being correct. The combination makes $62 a reasonable price target.
Fan Formation and Parallel Trend Channels As Explained In “Technical Analysis of Price Trends” by Edwards and McGee (The Sentiment King)
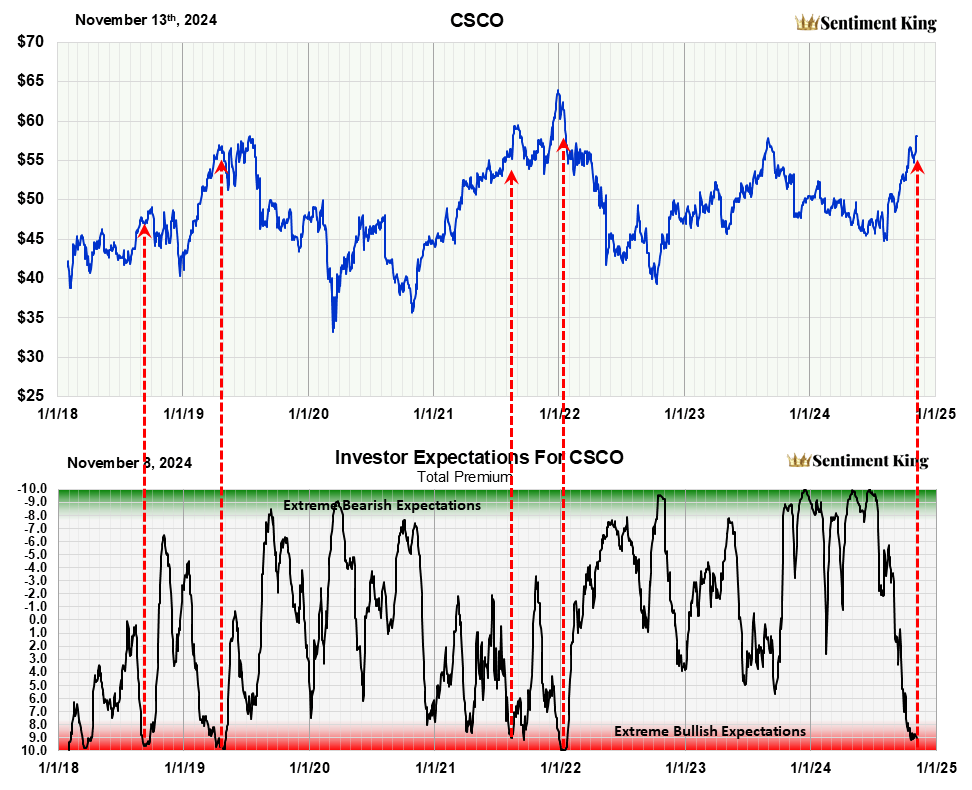
Investor Expectations For Cisco Are “Too Bullish”
The forecast of $62 for CISCO is based on the previous chart and the fact that “too many” investors are bullish on CSCO. Our framework of understanding does not allow a major advance to start, or continue far, when “too many” investors are already bullish. There must first be a price or time correction to reduce the level of optimism.
It’s a truism that you want to avoid a stock when “too many” investors believe it’s headed higher and buy the stock when “too many” think it’s headed lower. The chart below is the technical tool we use to help investors do this. Red zone readings are when “too many” investors expect higher prices and the Green Zone when “too many” expect lower prices.
Measuring investor expectations is the missing ingredient in most technical analysis and is what sets us apart. When “too many” investors have the same expectation, the opposite usually happens. The term “indicators of investor expectations” was coined by Marty Zweig in the 1970s. To discover what investors expect he compared their buying of “put” and “call” option contracts. At the Sentiment King we compare how much “money” is going into put options, expecting the price to decline, versus how much is going into call options, expecting a rise. This is not a short-term indicator. Ratios are calculated over 20 days to obtain long-term expectations. The Green Zone represents extreme bearish expectations, while the Red Zone represents extreme bullish expectations. (The Sentiment King)
In the last 6 1/2 years there’s have been five strong Red Zone readings in Cisco. We’ve indicated them with red arrows. Notice they occurred at either a major price peak or before a sideways consolidation.
The current Red Zone reading shows “too many” investors are bullish on Cisco. To us this is a signal for either a major top or at least a period price consolidation that will give investors an opportunity to purchase CSCO at a lower price.
For those who already own it, we think it prudent to lighten positions if it hits $62 a share.
Bollinger Bands Show Cisco Is Ready For a Long Term Price and/or Time Correction
Another way to look at price excesses in Cisco stock is by using Bollinger bands. They show how far prices have advanced above and below the norm.
It’s clear from the chart at the price of Cisco has been rising against the top Bollinger band line. This is a sign of a very strong price trend. It also can’t last, and it would be reasonable to expect the price of Cisco to digest and correct the recent three month price surge. This fits with the indicator of investor expectations also signaling a price correction.
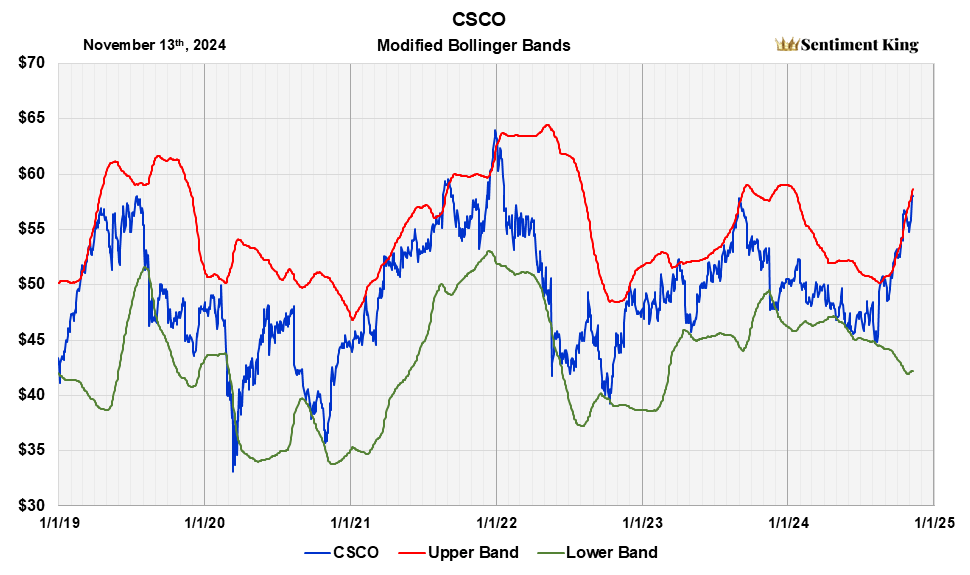
Bollinger Bands are a popular technical tool used by traders and investors to assess if a stock is overpriced or undervalued. They were created in the 1980s by financial expert John Bollinger. A simple moving average is calculated that represents the trend of interest; in our case we use a 100 day average. Then the standard deviation over the same period is calculated and upper and lower bands are placed above and below this moving average that represent a specific number of standard deviations. In our case we use two. Because the distance of the bands is based on standard deviation over 100 days, they expand and contract with price volatility. This means that, in volatile markets, support and resistance occurs at higher or lower levels than in less volatile markets. (The Sentiment King)
Long-Term Relative Strength of Cisco Is Neutral
The next chart shows the long-term RSI relative strength index for Cisco. We calculate our RSI indicator to measure relative strength over the long-term; this is not a short-term view.
It shows that the three month stock surge has pushed the relative strength line over 50 but not disproportionately so. To us this implies that this rally is not over and a $62 price target more than reasonable. We believe we will see the price of Cisco continue to advance to $62 over the next month, possibly backing and filling once it reaches the target. During that time the long term relative strength might increase to over 55 laying the foundation for an intermediate term price or time correction.
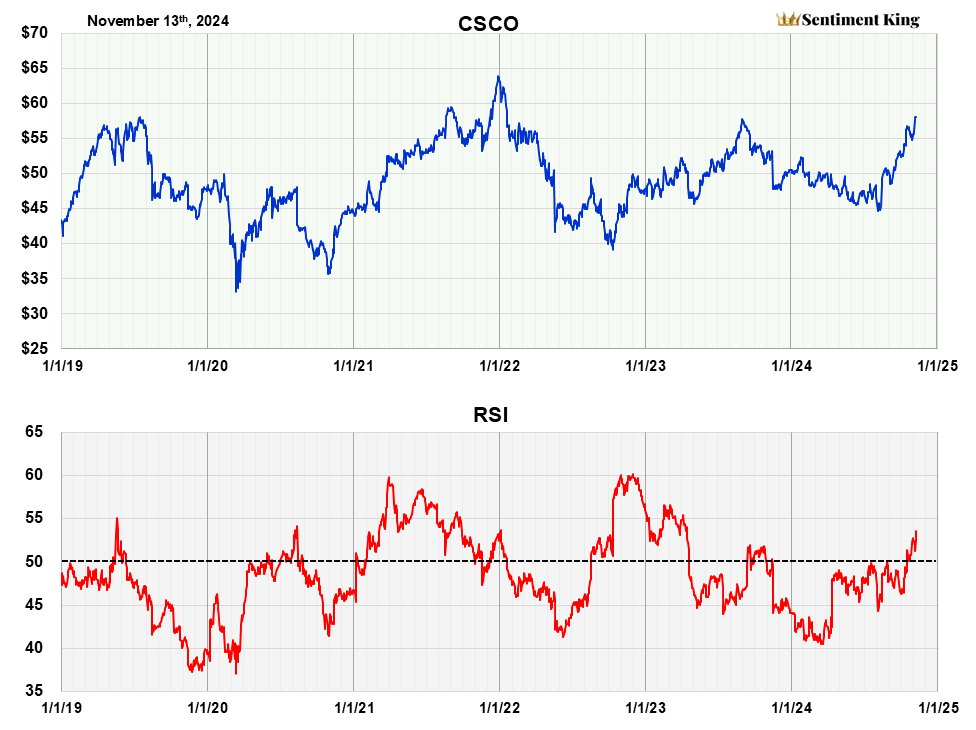
The relative strength index (RSI) was developed by J. Welles Wilder Jr. and introduced in his 1978 book, “New Concepts in Technical Trading Systems.” It is probably the most popular momentum indicator used in technical analysis. The RSI measures the speed and magnitude of recent price changes in a stock to evaluate if it’s been oversold or overbought. It has adjustable parameters that allow you to measure these conditions for either the short or long term. We’ve adjusted the RSI parameter in our graph to show the long-term picture. (The Sentiment King)
Conclusion
It’s our opinion current investors in Cisco should lighten their positions once it hits a price target of $62. New investors should wait for CSCO to hit its price target of $62, then look for lower price entries under $56 once investor expectations become more bearish (Green Zone Reading).
Analyst’s Disclosure: I/we have no stock, option or similar derivative position in any of the companies mentioned, and no plans to initiate any such positions within the next 72 hours. I wrote this article myself, and it expresses my own opinions. I am not receiving compensation for it (other than from Seeking Alpha). I have no business relationship with any company whose stock is mentioned in this article.
Seeking Alpha’s Disclosure: Past performance is no guarantee of future results. No recommendation or advice is being given as to whether any investment is suitable for a particular investor. Any views or opinions expressed above may not reflect those of Seeking Alpha as a whole. Seeking Alpha is not a licensed securities dealer, broker or US investment adviser or investment bank. Our analysts are third party authors that include both professional investors and individual investors who may not be licensed or certified by any institute or regulatory body.