Summary:
- The shareholders of Transocean have enjoyed a higher share price as the company had several contract wins worth billions of dollars.
- Despite sounding positive, alas their guidance for 2023 actually forecasts their operating cash flow to continue deteriorating.
- It also indicates the year will once again see negative free cash flow and therefore, it will make their overleverage slightly worse.
- Whilst debt refinancing buys time, if they ever want to escape the curse of their debt, they need to actually start repaying debt, which requires generating free cash flow.
- Since I expect this very disappointing outlook to weigh on their share price going forwards once their results are released for 2023, I believe that maintaining my sell rating is appropriate.
bunhill
Introduction
When last discussing the troubled Transocean (NYSE:RIG), my previous article suggested leaving this cigar butt to burn out, thereby borrowing a metaphor from the investing legend, Warren Buffett. In the subsequent months, they had several contract wins collectively worth billions of dollars that have seemingly helped drive their share price higher. Whilst these appear to be generating hope for a recovery, alas not much else is being generated given their very disappointing cash flow guidance for 2023 that actually forecasts their operating cash flow to continue deteriorating.
Coverage Summary & Ratings
Since many readers are likely short on time, the table below provides a brief summary and ratings for the primary criteria assessed. If interested, this Google Document provides information regarding my rating system and importantly, links to my library of equivalent analyses that share a comparable approach to enhance cross-investment comparability.
Author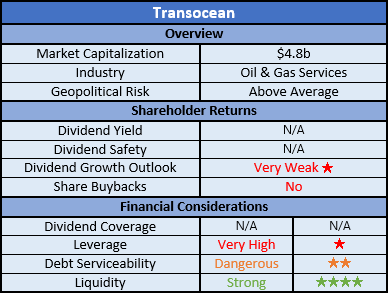
Detailed Analysis
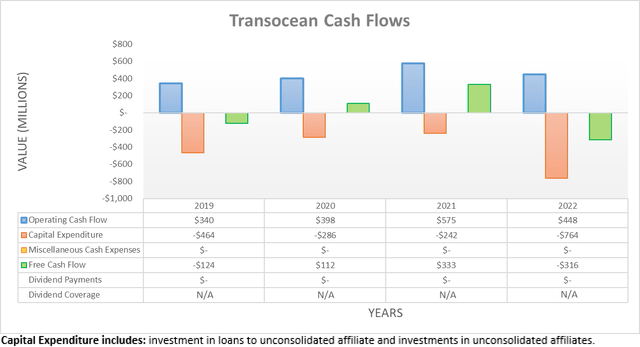
When conducting the previous analysis following the first half of 2022, the year had only seen minimal operating cash flow of $40m, whereas following the second half, their operating cash flow climbed to $448m for the full year. Despite accelerating at a brisk pace, it nevertheless remains down a material circa 22% year-on-year versus their previous result of $575m during 2021. Plus, due to their capital expenditure climbing to a sizeable $764m during 2022, they were left with negative free cash flow of $316m.
If looking at their operating cash flow on a quarterly basis, it does not paint a good picture, especially for the fourth quarter of 2022. Whilst their reported result of $178m was decent based upon their recent historical performance since at least the beginning of 2021, alas the same cannot be said for their underlying result that excludes working capital movements. If not for their sizeable $102m working capital draw, their underlying result was only a meager $76m. That is down significantly, both sequentially versus the third quarter and year-on-year versus the fourth quarter of 2022 that saw equivalent results of $207m and $117m, respectively. In fact, it is actually their second lowest result since the beginning of 2021 and thus created weak momentum heading into 2023 that itself, looks even worse given their guidance.
Transocean Investor Presentation February 2023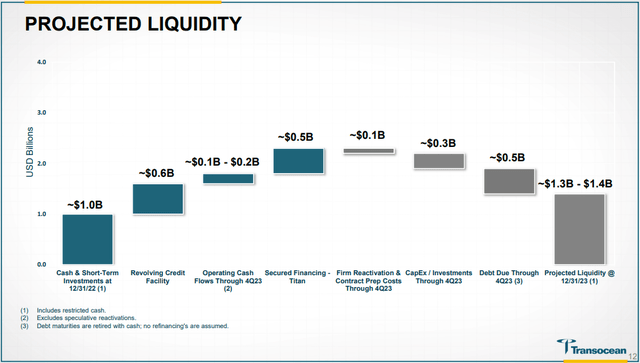
Whilst they present this information as projected liquidity, which is apt, it also serves as guidance for 2023 given it includes their forecast operating cash flow and accompanying capital expenditure. In the case of the former, it is very disappointing to see a forecast of only circa $100m to $200m, which indicates their already weak end to 2022 is poised to continue deteriorating going forwards into the remainder of 2023. To make matters even worse, the notes beneath the above graph indicate their operating cash flow guidance does not include their reactivation and contract prep costs, which are forecast to amount to circa $100m. If these are also included as they would be their GAAP financial statements, their forecast result is actually circa $100m at best and even as low as zero. They also forecast capital expenditure of circa $300m and thus regardless of where their operating cash flow lands, they will once again endure negative free cash flow of between circa $200m and $300m, despite desperately needing to generate free cash flow to aid with deleveraging.
It is particularly concerning to see their guidance for negative free cash flow does not necessarily arise from dramatically higher capital expenditure. Since their forecast of circa $300m is down materially versus their average spending of $439m during 2019-2022, it highlights how this is actually due to their very disappointing operating cash flow, despite their recent contract wins. When conducting the previous analysis, their twelve-month forward guidance for operating cash flow was between circa $400m and $600m and thus further confirms their ability to generate cash appears to actually be deteriorating and therefore, it casts serious doubts about their ability to escape the curse of their debt.
It is now three years since the severe Covid-19 downturn that sent oil prices negative at one point and despite having since seen a global energy shortage following the Russian invasion of Ukraine, their recovery remains elusive. In my opinion, if this cannot provide the boost required to start generating strong free cash flow or at least, see their operating cash flow heading in a positive direction, I am skeptical that it will ever be forthcoming. To make matters worse, following the recent mini-banking crisis during early 2023, the outlook for economic conditions worsened and thus, I suspect that oil companies are likely to be even more cautious about offshore drilling. Even during the best of times, these ventures are generally more speculative, high cost and even if successful, they require large long-term investments that are particularly risky as the oil industry faces its peak given the clean energy transition.
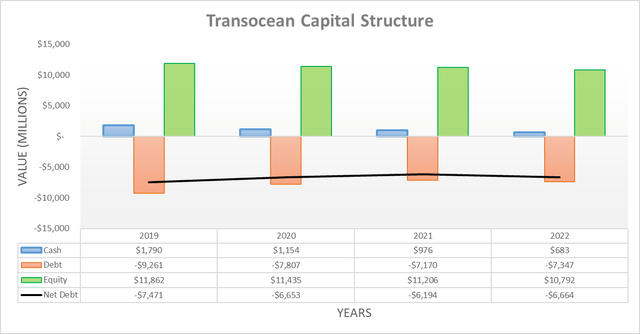
After seeing their free cash flow sink further into the negatives during the second half of 2022 since conducting the previous analysis, it was not surprising to see their net debt increase to $6.664b versus its previous level of $6.494b following the second quarter. This is the exact opposite of what this overleveraged company needs but alas, as their aforementioned guidance for 2023 shows, this is not going to change direction in the foreseeable future, as they forecast generating negative free cash flow once again in the year ahead. Even though their forecast negative free cash flow of circa $200m to $300m is relatively small versus their formidable net debt, adding more only makes their overleverage slightly worse.
I would normally now expand into a detailed assessment of their leverage and debt serviceability but in this situation, it should suffice to say the former is very high whilst the latter is dangerous given their guidance for operating cash flow during 2023. To this point, even the upper end of their guidance that forecasts a result of $200m would see a net debt-to-operating cash flow of more than 30 given their latest net debt, whilst a comparison against their most recent interest expense of $561m during 2022 leaves dangerous interest coverage of only 0.36. Since their overleverage is a well-accepted fact about the company, it would be redundant to assess either of these considerations in detail.
Similar to when conducting the previous analysis, their liquidity once again appears surprisingly good on the surface with their current ratio at 1.29 following the second half of 2022 and thus in the same ballpark as their previous result of 1.49 following the second quarter. Likewise, the same can be also said regarding their cash ratio that sees respective results of 0.44 and 0.48 across the same two points in time.
Whilst their strong liquidity is undoubtedly the one bright spot for the company that buys time, it cannot last forever unless they start generating free cash flow, which thus far remains elusive. To my surprise, they recently priced $1.175b of senior secured notes that do not mature until 2030, which will be utilized to repay their upcoming debt maturities.
Transocean 2022 10-K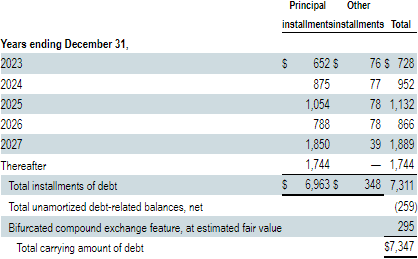
When combined with their aforementioned guidance for 2023 that shows the year ending with circa $1.35b of liquidity at the midpoint, this recent debt issuance effectively gives a combined circa $2.5b to deal with debt maturities after 2023. Whilst sufficient to deal with the $952m during 2024 and the $1.132b during 2025, alas it is insufficient to also handle the $866m that comes due during 2026, let alone the $1.889b that subsequently comes due during 2027. Admittedly, future debt refinancing may also take care of these two years but fundamentally, it would still not resolve their overleverage as they are merely kicking the proverbial can down the road. This may be a viable strategy for many companies but given they are offering services to what is often a high-cost area of an industry that is facing a secular decline in the long-term, I am skeptical this proverbial road is necessarily going to get significantly better in the medium to long-term.
Conclusion
Like it or not, I believe that one day they need to start actually repaying debt if they are ever going to escape its curse and create value for shareholders. Thus far, I have serious doubts this will be forthcoming given their operating cash flow guidance for 2023 forecasts it will continue deteriorating, despite their recent contract wins that appear to be generating hope and driving their share price higher. Unless this unexpectedly changes, I feel this very disappointing outlook will begin sinking into their share price when their upcoming results for the first quarter are released in a few weeks and in theory, starts reflecting their aforementioned guidance. Following this analysis, it should not be surprising to see that I continue to believe maintaining my sell rating is appropriate.
Notes: Unless specified otherwise, all figures in this article were taken from Transocean’s SEC Filings, all calculated figures were performed by the author.
Analyst’s Disclosure: I/we have no stock, option or similar derivative position in any of the companies mentioned, and no plans to initiate any such positions within the next 72 hours. I wrote this article myself, and it expresses my own opinions. I am not receiving compensation for it (other than from Seeking Alpha). I have no business relationship with any company whose stock is mentioned in this article.
Seeking Alpha’s Disclosure: Past performance is no guarantee of future results. No recommendation or advice is being given as to whether any investment is suitable for a particular investor. Any views or opinions expressed above may not reflect those of Seeking Alpha as a whole. Seeking Alpha is not a licensed securities dealer, broker or US investment adviser or investment bank. Our analysts are third party authors that include both professional investors and individual investors who may not be licensed or certified by any institute or regulatory body.

