Summary:
- TSMC’s stock rose by 37.13% since my previous article, now it stands at $140.45, near the lower end of my fair price estimate range of $146.4- $220.1.
- TSMC expands fabs and innovates to maintain market dominance, holding 61% share. This last one represents pricing advantages.
- TSMC remains undervalued with a fair price estimate of $238.47, suggesting 33% annual returns throughout 2029, offering opportunity even with consensus projections.
BING-JHEN HONG
Thesis
In my previous article about Taiwan Semiconductor Manufacturing Company Limited (NYSE:TSM), I updated my models and got a fair price estimate ranging from $146.4 to $220.1.
That article was published after Q3 2023 (which was released on October 19, 2023. At that time the stock was trading at $104, which prompted a rating upgrade from “Hold” to “Strong Buy”. Since then the stock price has increased by 37.13%, and now the stock price stands at $140.45, therefore being close to the lower end of the fair price estimate range.
TSMC released Q4 2023 earnings on January 18. For that quarter, TSMC beat top EPS estimates by $0.05 and revenue by 50M. The company also disclosed that 3nm and 5nm accounted for 15% and 35% respectively, 50% in total.
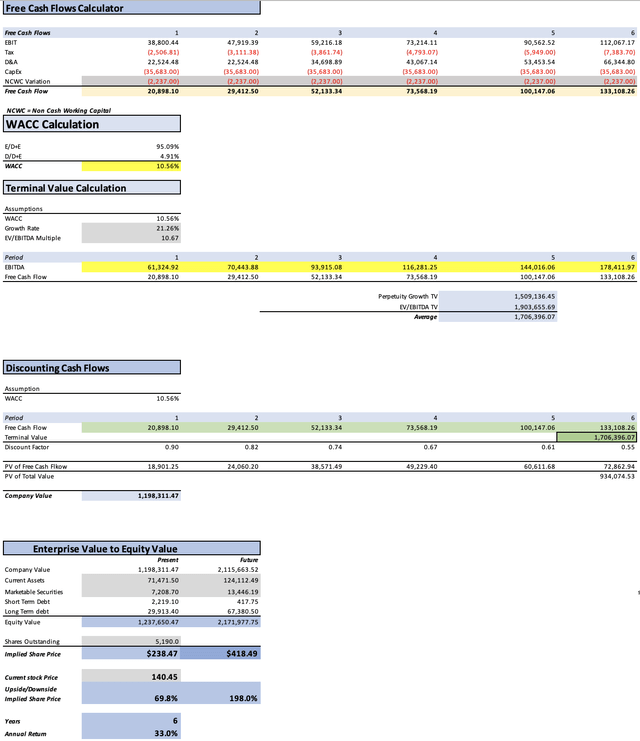
After updating my models again, I arrived at a fair price estimate of $238.47 and a future price estimate for 2029 of $418.49. Both of these targets mean an upside of 69.8% and annual returns of 33% throughout 2029.
Seeking Alpha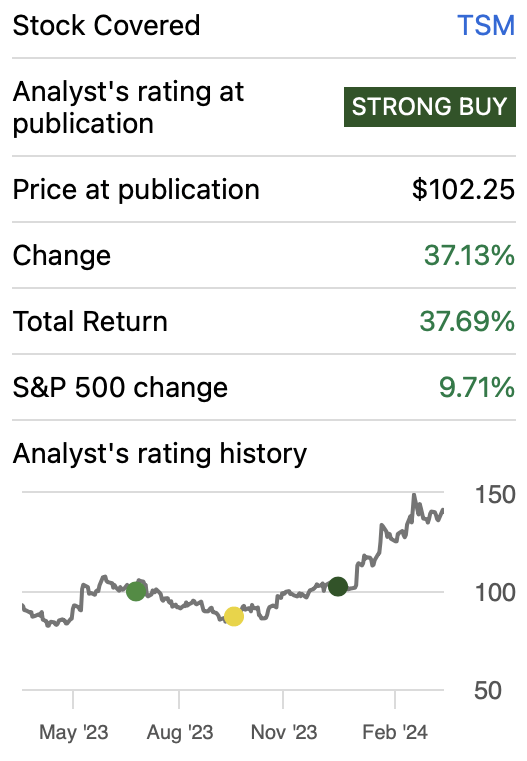
Overview
TSMC’s Growth Plan
TSMC’s business is manufacturing, therefore its growth plan is essentially expanding its existing fabs and building new ones. Aside from that, they are very focused on innovation, which is one of the reasons why they have managed to keep their dominance.
How does TSMC compare against Peers?
TSMC is the largest semiconductor manufacturing company by capacity and market share. This last one stands at around 61%, which is far superior to the second place, Samsung Electronics Co., Ltd. (OTCPK:SSNLF) which holds 11.3% of the market. The third and fourth places are GLOBALFOUNDRIES Inc. (GFS), and United Microelectronics Corporation (UMC) with 5.8% and 5.4% respectively.
TSMC’s size is, in my opinion, a moat by itself since with a higher volume, TSMC can offer reduced pricing per unit as well as preferential pricing for lithography machines and fab equipment.
Statista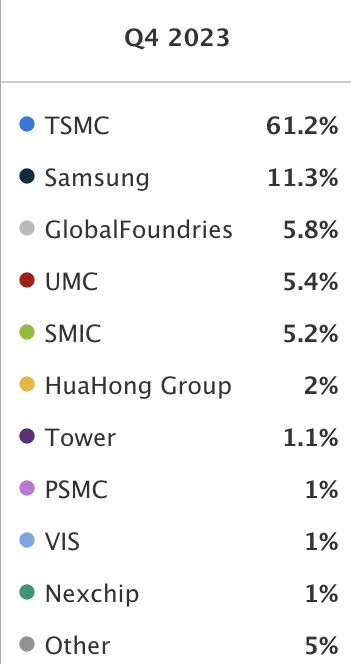
Industry Outlook
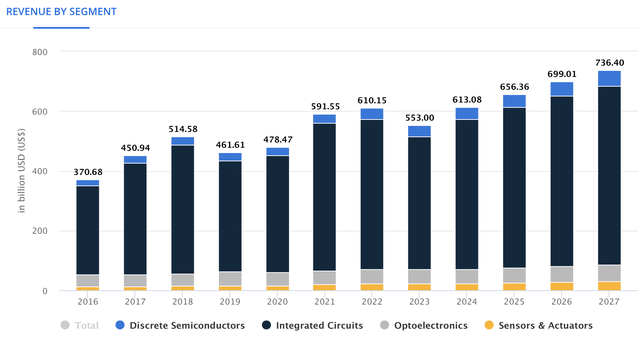
The worldwide semiconductor market is expected to grow at a CAGR of 6.30% throughout 2027. At the end of 2023, the market generated revenues of $553B, and it’s expected to reach $736.4B by 2027.
However, that is taking all semiconductors sales which is beyond foundry services. This last one was valued at $106.9B in 2022 and is expected to reach $231.5B by 2032, which is an 8.1% annual growth rate throughout that period.
Valuation
To value TSMC I will employ a DCF model. Below you can see the list of financial figures that will be needed to build the model. The equity market price is the market cap of TSMC at the time I started writing the article.
The WACC will be calculated with the already-known formula. In this case, it came out at 10.50%. If you want to see a more detailed procedure, you can see the section labeled “WACC Calculation” in the DCF model.
Lastly, CapEx will be left fixed at $35.68B, which is around $5B higher than the FY2023 CapEx of $ 30.94 B. Interest expenses will grow at a 9% rate at pace with the 2021-2023 average growth of total debt, which was 9%. Then, D&A will be calculated with a margin tied to revenue, which is 24.37%.
| TABLE OF ASSUMPTIONS | |
| (Current data) | |
| Assumptions Part 1 | |
| Equity Market Price | 622,940.00 |
| Debt Value | 32,132.50 |
| Cost of Debt | 4.90% |
| Tax Rate | 7.22% |
| 10y Treasury | 4.365% |
| Beta | 1.06 |
| Market Return | 10.50% |
| Cost of Equity | 10.87% |
| Assumptions Part 2 | |
| CapEx | 30,940.70 |
| Capex Margin | 43.94% |
| Net Income | 27,314.40 |
| Interest | 1,573.20 |
| Tax | 4,606.30 |
| D&A | 17,163.40 |
| Ebitda | 50,657.30 |
| D&A Margin | 24.37% |
| Interest Expense Margin | 2.23% |
| Revenue | 70,419.4 |
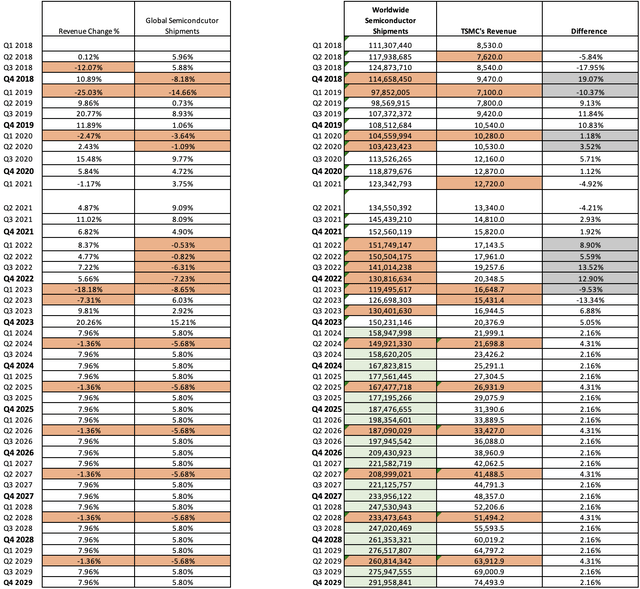
The first step to arrive at the fair value estimate is to calculate revenue. For doing this I will rely on historical data concerning Worldwide Semiconductor Shipments from WSTS and the historical quarterly revenue of TSMC since Q1 20218.
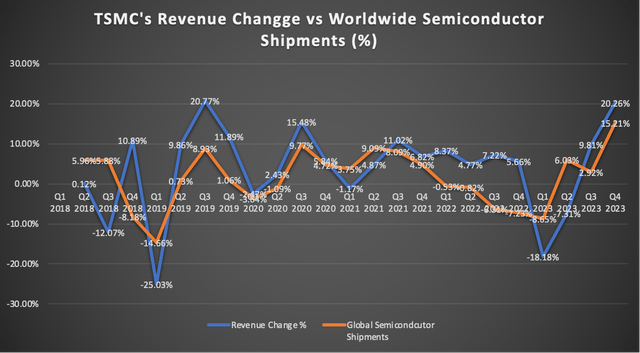
Analyzing the trend below, you can observe that the average quarterly growth of semiconductor shipments since 2018 has been 5.80% and the average contraction has been 5.68%. Meanwhile, TSMC has been growing 2.16% more and contracting 4.31% less than the overall market. These are the proportions I will keep for the overall projection of worldwide semiconductor shipments and TSMC’s quarterly revenue.
Furthermore, contractions in semiconductor shipments usually last 1 quarter. The only exception has been the period of Q1 2022-Q1 2023, which was later resolved thanks to the increased demand for AI-capable GPUs and CPUs. Then, periods of growth usually last three quarters.
In the table below you can see my projections for worldwide semiconductor shipments as well as for TSMC’s quarterly revenue throughout 2029. In red you can see the periods where both metrics contracted. You may observe that for some periods TSMC followed a distinct path from the market, however, for the protection (which is marked in green) I made that every three quarters there would be a quarterly contraction.
Finally, the model is also going to suggest which could be the stock price for 2029. To do this I will try to predict which could be the value of each of the elements that compose equity. To do this I will rely on the average evolution displayed by these elements in 2021-2023.
As you can see, the model yields a present fair price estimate of $238.47, which implies a 69.8% upside from the current stock price of $140.45. Then, the future price estimate of $418.49 translates into 33% annual returns throughout 2029.
How do my Estimates Compare with the Average Consensus?
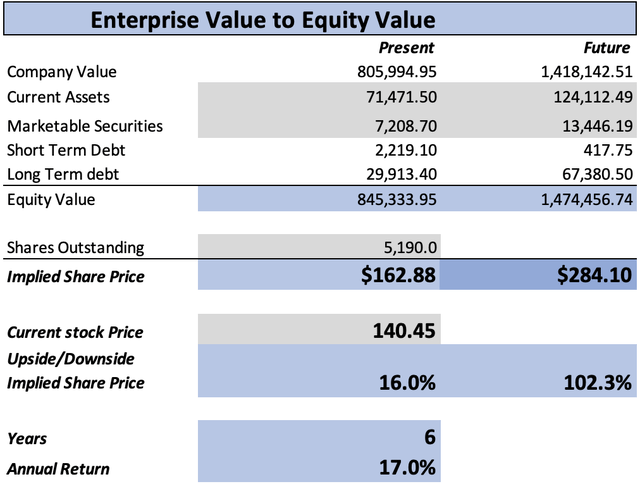
If I did a model completely based on average estimates, I would get a fair price per share of $162.88, which is a 16% upside from the current stock price of $140.45. Then, the future price yielded by this hypothetical model would be $284.10, which translates into 17% annual returns throughout 2029.
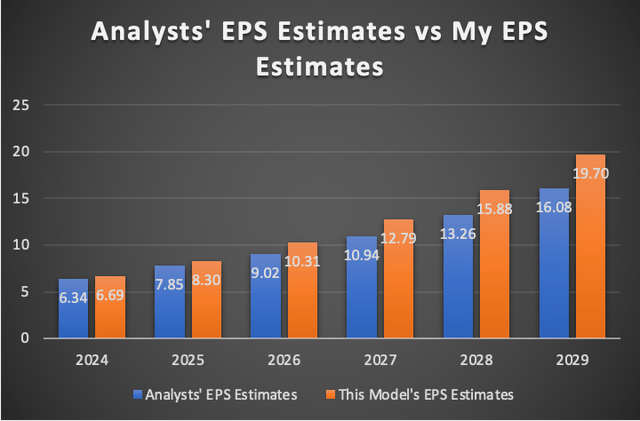
As you may observe in the graph below, average EPS estimates are more optimistic for every single year of the projection. Nevertheless, for 2024 & 2025, the difference is not that big, since it stands at 5.23% and 5.46% respectively. However, for the following years, my estimates are 12.48%, 14.49%, 16.46%, and 18.38% higher.
Risks to Thesis
The main risk for my thesis is that TSMC cannot achieve my optimistic targets. Nevertheless, even if TSMC achieves the lower estimates from the average consensus, the stock would also be 16% undervalued and would still offer 17% annual returns throughout 2029.
Additionally, regarding competition, particularly from Intel Corporation (INTC), I don’t think this is a treat, even though Intel foundry revenue grew strongly, I don’t see Intel capable enough to grow its market share enough to catch up with TSMC. This is because when TSMC was created, IDMs such as Intel controlled manufacturing, however manufacturing with an IDM could lead to possible conflicts of interest. Therefore, a company that solely focused on manufacturing, was more appealing for designers.
Conclusion
In conclusion, TSMC is still undervalued. My new fair price estimate stands at $238.47, which is higher than my previous top-line estimate of $220.1. My New future price estimate stands at $418.49, which translates into 33% annual returns throughout 2029.
Furthermore, even if the stock goes in the direction of the average consensus, the suggested stock price still stands 16% above the current stock price of $140.45. For this reason, I think that the stock continues to offer enough opportunity approaching Q1 2024 and therefore I maintain my “strong buy” rating.
Analyst’s Disclosure: I/we have no stock, option or similar derivative position in any of the companies mentioned, but may initiate a beneficial Long position through a purchase of the stock, or the purchase of call options or similar derivatives in TSM over the next 72 hours. I wrote this article myself, and it expresses my own opinions. I am not receiving compensation for it (other than from Seeking Alpha). I have no business relationship with any company whose stock is mentioned in this article.
Seeking Alpha’s Disclosure: Past performance is no guarantee of future results. No recommendation or advice is being given as to whether any investment is suitable for a particular investor. Any views or opinions expressed above may not reflect those of Seeking Alpha as a whole. Seeking Alpha is not a licensed securities dealer, broker or US investment adviser or investment bank. Our analysts are third party authors that include both professional investors and individual investors who may not be licensed or certified by any institute or regulatory body.

