
Summary:
- TSMC experienced weakness in 2023 but is expected to recover in the second half with strong orders for its 3nm process technology, leading to robust growth in 2024.
- Foundry 2.0 expands TSMC’s market opportunity to $250 billion in 2023, including front-end foundry services, back-end services, and IDM opportunities.
- TSMC’s integration of foundry and OSAT services, along with strong process technology capabilities, customer partnerships, and AI factors, positions the company for continued growth and market share expansion.
BING-JHEN HONG/iStock Editorial via Getty Images
In our previous analysis, we highlighted Taiwan Semiconductor Manufacturing Company Limited’s (NYSE:TSM) (OTC:TSMWF) weakness in 2023 due to low utilization rates amid PC and smartphone market weakness but benefiting from a recovery in the second half with strong orders for its 3nm process technology. We anticipated robust positive growth for TSMC in 2024 supported by its competitive advantages in process technology, partnerships, and AI.
In this analysis, we covered the company following its latest earnings briefing, where management highlighted “Foundry 2.0” as its next foray. Thus, we examined how Foundry 2.0 will benefit the company. Firstly, we looked into what Foundry 2.0 is based on the definition of management, interpreted it, and determined how it expands the market opportunity for TSMC. Moreover, we examined TSMC’s market position in each of the foundry and OSAT markets based on Foundry 2.0. Finally, we determined whether the company’s OSAT and foundry provide it with any unique benefits.
Foundry 2.0 Market Opportunity
We first examined what is Foundry 2.0 and how to interpret it. Based on management in the latest earnings briefing, Foundry 2.0 includes “packaging, testing, mask making, and others and all IDM, excluding memory manufacturing”. Furthermore, the company claims that based on this definition, the total market size will increase significantly to $250 bln in 2023 compared to $115 bln.
We analyzed the company size of the foundry, OSAT (packaging and testing), and IDM (excluding memory) and explained which one applies to TSMC. Furthermore, we determined whether IDM should be included due to the company’s business model (not designing chips but only manufacturing them).
Foundry (Frontend)
|
Foundry Market Revenues ($ mln) |
2015 |
2016 |
2017 |
2018 |
2019 |
2020 |
2021 |
2022 |
2023 |
8Y Average |
|
Total |
53,227 |
61,407 |
68,098 |
65,493 |
68,567 |
83,995 |
109,944 |
140,914 |
117,409 |
|
|
Growth % |
15.4% |
10.9% |
-3.8% |
4.7% |
22.5% |
30.9% |
28.2% |
-16.7% |
11.5% |
Source: Company Data, TrendForce, Khaveen Investments
The first is the foundry, which we calculated totaled $117.4 bln in 2023 with an average growth rate of 11.5%. In 2023, the market contracted amid the semiconductor industry declined by 9% in 2023 as end markets, especially PC and smartphones, experienced demand weaknesses. In its annual report, the company’s “focus is on wafer fabrication.” The diagram below shows an overview of the fabrication process.
SIA, BCG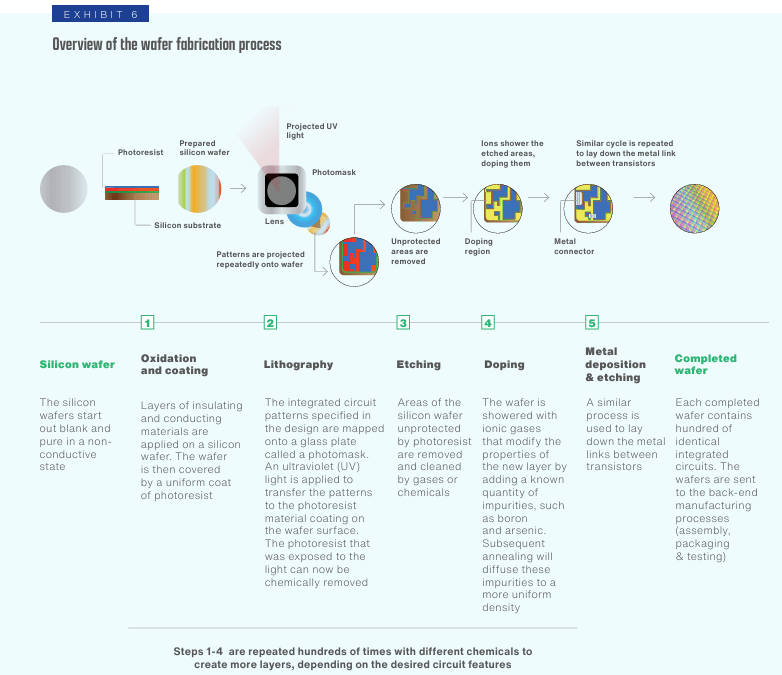
Based on the diagram above, the wafer fabrication process begins with applying layers of insulating and conducting materials. This is followed by lithography, where integrated circuit patterns from a photomask are transferred onto the wafer using UV light and photoresist. Next, the etching process removes unprotected areas, and the doping process introduces impurities to alter the electrical properties of specific regions. Metal deposition then creates connections between transistors. These steps are repeated to build complex circuitry. Finally, the completed wafer, containing intricate integrated circuits, undergoes a series of tests before being sent for assembly and packaging which is part of the backend process.
Additionally, TSMC’s Foundry 2.0 highlighted mask making, which is “a fabrication process where a computer-aided design (CAD) is transferred to a thin (80-100 nm) layer of metal in a glass or fused silica substrate, known as mask or photomask”. This photomask is involved in the lithography stage as seen above. TSMC has already been doing mask-making services and is mentioned in its annual report that its mask-making services are a differentiation compared to other foundries. However, other foundry competitors also provide mask-making services such as Samsung (OTCPK:SSNLF), GlobalFoundries (GFS), UMC (UMC), SMIC, and Intel Foundry Services (INTC). These companies include mask-making services that are accounted for in their foundry revenue, thus reflected in the foundry market size of $117.4 bln.
OSAT (Backend)
|
OSAT Market Share ($mln) |
2015 |
2016 |
2017 |
2018 |
2019 |
2020 |
2021 |
2022 |
2023 |
Average |
|
Total |
26,585 |
30,431 |
34,582 |
38,639 |
38,421 |
45,155 |
56,128 |
59,235 |
57,473 |
|
|
Growth % |
9.2% |
14.5% |
13.6% |
11.7% |
-0.6% |
17.5% |
24.3% |
5.5% |
-3.0% |
10.5% |
Source: Company Data, Yole, Khaveen Investments
The next part we discussed is the OSAT market which encompasses packaging and testing services as mentioned by management under Foundry 2.0. Based on our previous analysis, we compiled the top 34 companies that provide OSAT services and calculated a total market size of $57.5 bln in 2023 with an average of 10.5% over the period. Based on TSMC’s annual report, the company’s activities covering OSAT mainly involve TSMC 3DFabric advanced packaging and testing services. TSMC’s advanced packaging technologies include TSMC-SoIC, CoWoS, and InFO. TSMC SoIC stacks multiple chips in a 3D configuration to enhance performance and reduce power consumption, whereby CoWoS integrates multiple chips on a silicon interposer for high bandwidth and low latency interconnections and InFO offers a high-density, low-cost solution by directly connecting the die to the package without a substrate.
IDM
Furthermore, the final component of Foundry 2.0 as mentioned by management is IDM excluding memory. The semicon industry consists of 2 types of chip designer companies: fabless companies and IDMs. Fabless companies focus on chip design and outsource the manufacturing process to foundries, whereby the foundries only focus on manufacturing and do not design chips. On the other hand, IDMs encompass both the design and manufacturing stages and manage their production internally, including both the wafer fabrication and packaging and testing. Therefore, IDMs traditionally are not customers of foundries like TSMC. However, TSMC’s management decided to include IDMs excluding memory companies in the scope of Foundry 2.0. We believe this could be due to increasing collaboration between foundries (TSMC) and IDMs. For example, Intel uses TSMC for 3nm chips for computer processors. Additionally, STMicro (STM) has collaborated with TSMC to use TSMC’s leading technology in manufacturing its GaN products. NXP (NXPI) also partners with TSMC and uses TSMC’s 5-nm technology on its S32 series chips. Similarly, Infineon (OTCQX:IFNNY) also extended its partnership with TSMC to outsource manufacturing and to “engage in technology co-development for 65 nanometer and smaller process technology”. ADI (ADI) also highlighted in its annual report it relies on third-party manufacturers, including TSMC. Overall, we believe this indicates a potential shift between IDM internal production to external manufacturers.
We compiled IDMs including Intel, Samsung, TI, STMicroelectronics, Infineon, ON Semiconductor, NXP, Renesas, ADI, Microchip, Rohm, ams-OSRAM AG, Qorvo, and Microchip.
|
IDM Company (Revenue) |
2019 |
2020 |
2021 |
2022 |
2023 |
Average |
|
Intel Corporation |
71,965 |
77,867 |
79,024 |
63,054 |
54,228 |
|
|
Samsung Electronics |
23,900 |
25,710 |
24,760 |
25,040 |
25,960 |
|
|
Texas Instruments (TXN) |
14,383 |
14,461 |
18,344 |
20,028 |
17,519 |
|
|
STMicroelectronics |
9,529 |
10,181 |
12,729 |
16,083 |
17,239 |
|
|
Infineon Technologies |
8,752 |
10,046 |
13,932 |
17,242 |
17,242 |
|
|
ON Semiconductor (ON) |
5,518 |
5,255 |
6,740 |
8,326 |
8,253 |
|
|
NXP Semiconductors |
8,877 |
8,612 |
11,063 |
13,205 |
13,276 |
|
|
Renesas Electronics (OTCPK:RNECF) |
6,610 |
6,931 |
8,635 |
11,434 |
10,423 |
|
|
Analog Devices |
5,991 |
5,603 |
7,318 |
12,014 |
12,306 |
|
|
Microchip Technology (MCHP) |
5,274 |
5,438 |
6,821 |
8,439 |
7,634 |
|
|
ROHM Co. (OTCPK:ROHCF) |
3,375 |
3,250 |
3,714 |
3,825 |
3,091 |
|
|
ams-OSRAM AG (OTCPK:AMSSY) |
2,114 |
4,281 |
5,734 |
5,160 |
3,963 |
|
|
Qorvo (QRVO) |
3,239 |
4,015 |
4,646 |
3,569 |
3,770 |
|
|
IDM Sales ($ mln) |
169,527 |
181,650 |
203,460 |
207,419 |
194,904 |
|
|
Growth % |
7.0% |
12.4% |
2.7% |
-6.2% |
4.0% |
Source: Company Data, Khaveen Investments
Based on the table, we calculated the total revenues of the IDMs is $195 bln with an average of 4%. Intel is the largest IDM with $54.2 bln in revenue. However, we believe this figure does not accurately reflect the market opportunity for TSMC’s Foundry 2.0, as IDMs cover IP and chip design which is fundamentally different from the business model of a foundry which only focuses on manufacturing. Moreover, TSMC reiterated that it does not compete with its customers, unlike Samsung and Intel which both develop their chips. In terms of the cost of sales breakdown for IDMs, we used Micron Technology (MU) as an example where it consists of “depreciation, labor, material, and overhead costs, including product and process technology costs” as IDMs manufacture their chips in-house and manufacturing expenses of their fabs. In comparison, for fabless companies, it primarily consists of foundry, OSAT, and other expenses. For example, Nvidia’s cost of revenue mainly includes “wafer fabrication, assembly, testing, packaging, board and device costs, manufacturing support costs” and other expenses such as shipping costs, stock-based compensation, etc. Similarly, for Silicon Labs, the company’s cost of revenue consists of “cost associated with assembly, test, and shipping”, and so does SiTime which includes “assembly, packaging, and test costs”.
|
Fabless |
% of TSMC Revenue (2023) |
Fabless Payment to TSMC ($ mln) |
% Fabless Company Revenue |
|
AMD |
7% |
4,929 |
21.7% |
|
Broadcom (AVGO) |
5% |
3,521 |
9.8% |
|
MediaTek (OTCPK:MDTTF) |
5% |
3,521 |
24.9% |
|
NVIDIA (NVDA) |
11% |
7,746 |
12.7% |
|
QUALCOMM (QCOM) |
7% |
4,929 |
13.8% |
|
Average |
16.60% |
Source: Company Data, Khaveen Investments
Furthermore, to derive an estimate for the opportunity for TSMC specifically, we compiled TSMC’s % of total revenue from major fabless companies based on TweakTown, then we calculated the fabless companies’ respective payment to TSMC by multiplying it with the companies’ 2023 revenue and derived the % of their revenue towards TSMC, which shows an average of 16.6%. Furthermore, we calculated TSMC’s weighted average foundry and OSAT market share of 41%. Dividing our TSMC % of fabless revenue (16.6%) by TSMC weighted average share, we derived a total foundry and OSAT % of fabless revenue estimate of 40.4%.
|
IDM Company (Revenue) |
2019 |
2020 |
2021 |
2022 |
2023 |
Average |
|
IDM Sales ($ mln) |
169,527 |
181,650 |
203,461 |
207,420 |
194,903 |
|
|
Total Foundry and OSAT % of Fabless Revenue Estimate |
40.4% |
40.4% |
40.4% |
40.4% |
40.4% |
|
|
IDM (Foundry/OSAT) Market Opportunity |
68,423 |
73,316 |
82,119 |
83,717 |
78,665 |
|
|
Growth % |
7.2% |
12.0% |
1.9% |
-6.0% |
3.8% |
Source: Company Data, Khaveen Investments
Applying our assumption for the total foundry and OSAT % of fabless revenues with the total IDMs excluding memory revenues of $194.9 bln, we derived a total market opportunity of $78.7 bln related to IDMs shifting production to foundries and OSATs, at an average growth of 3.8%.
Conclusion
|
IDM Company (Revenue) |
2019 |
2020 |
2021 |
2022 |
2023 |
Average |
|
IDM Sales ($ mln) |
169,527 |
181,650 |
203,461 |
207,420 |
194,903 |
|
|
Total Foundry and OSAT % of Fabless Revenue Estimate |
40.4% |
40.4% |
40.4% |
40.4% |
40.4% |
|
|
IDM (Foundry/OSAT) Market Opportunity |
68,423 |
73,316 |
82,119 |
83,717 |
78,665 |
|
|
Foundry |
68,567 |
83,995 |
109,944 |
140,914 |
117,409 |
|
|
OSAT |
38,421 |
45,155 |
56,128 |
59,235 |
57,473 |
|
|
Total Market Opportunity |
175,412 |
202,465 |
248,191 |
283,865 |
253,547 |
|
|
Growth % |
15.7% |
23.0% |
14.8% |
-10.8% |
10.7% |
Source: Company Data, Khaveen Investments
In total, we calculated a maximum market opportunity of $253.5 bln based on our interpretation of the scope of Foundry 2.0, which consists of 3 main components which are front-end related foundry services that encompass both wafer fabrication and masking, back-end related services that include packaging and testing (OSAT), as well as the IDM (excluding memory) opportunity related to the shift of production to third parties including TSMC. Our figure aligns with TSMC’s assessment in 2023, that its total market opportunity of $250 bln. However, it is important to note that this represents the entire market opportunity and not what TSMC could realistically capture.
OSAT and Foundry Integration
Finally, we examined how its OSAT and Foundry business could benefit and complement each other.
We determine the strength of the integration between the foundry and OSAT and explain the benefit provided to customers using both the foundry and OSAT by TSMC. We also compile the top 5 foundries on whether they offer advanced packaging.
Company Data, Khaveen Investments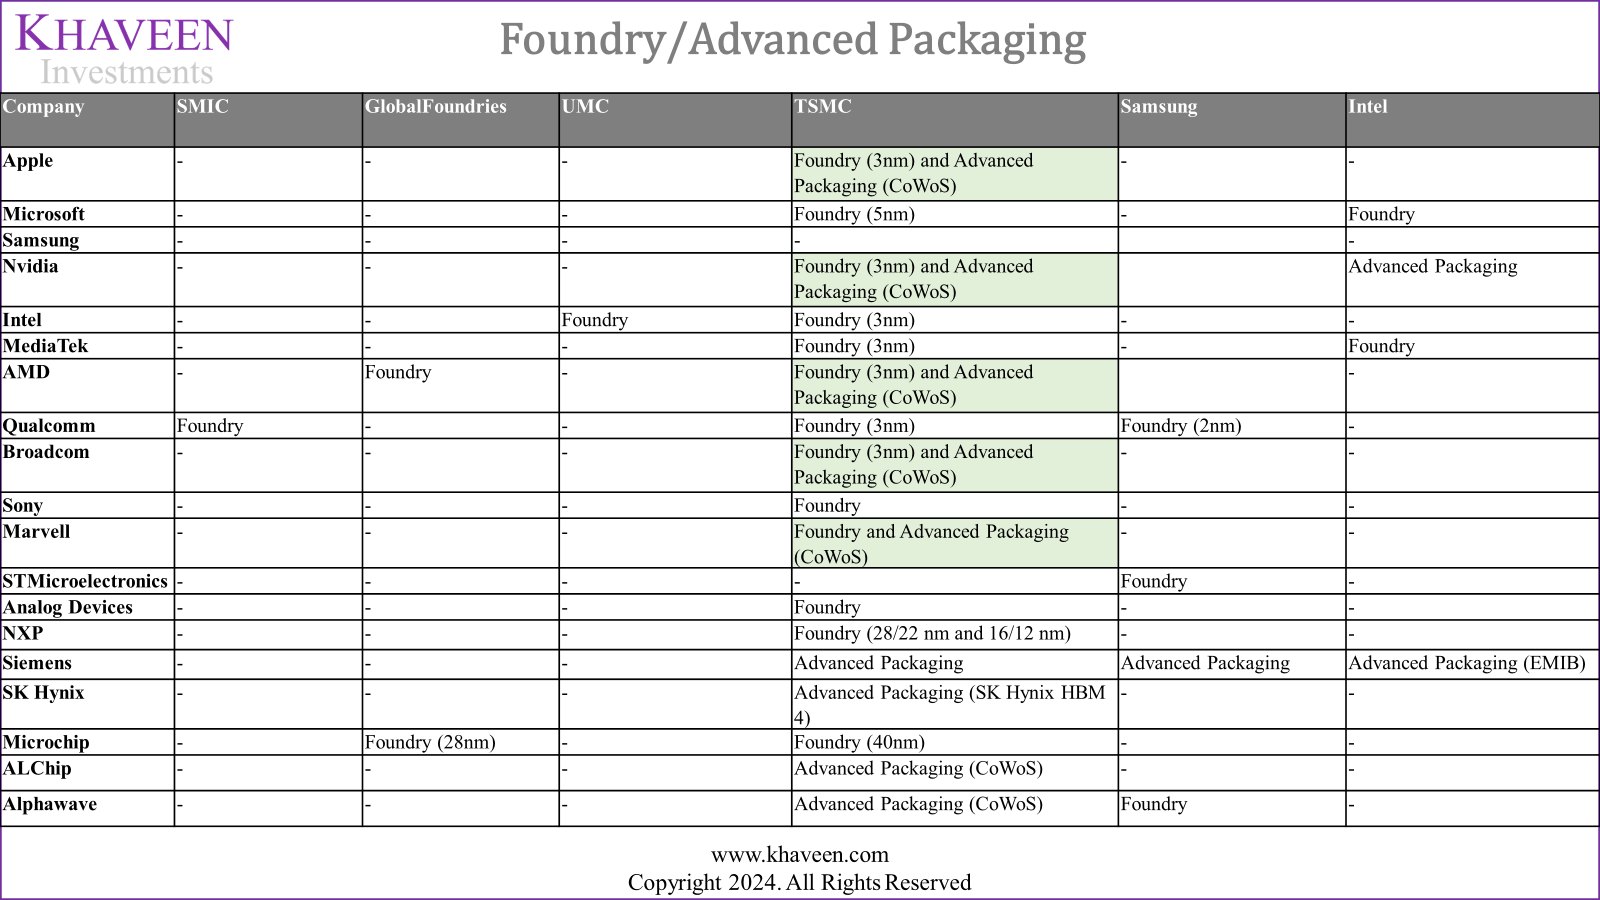
The chart above shows the list of customers that we compiled in our previous analysis. We compiled data on advanced packaging customers as well by these companies. Notably, TSMC is the only company that offers foundry services at advanced nodes like 3nm and 5nm, and advanced packaging services such as CoWoS. Several companies, including Apple, Nvidia, AMD, Broadcom, Marvell, Alchip, and Alphawave utilize both TSMC’s foundry and advanced packaging services.
Based on TSMC’s website, one of the advantages of the company’s 3DFabric Alliance, a collaboration between TSMC and other companies within the semicon value chain for advanced packaging includes “integrating advanced logic with 3DFabric technologies to provide a full spectrum of best-in-class solutions and services for semiconductor design, memory modules, substrate technology, testing, manufacturing, and packaging”.
TSMC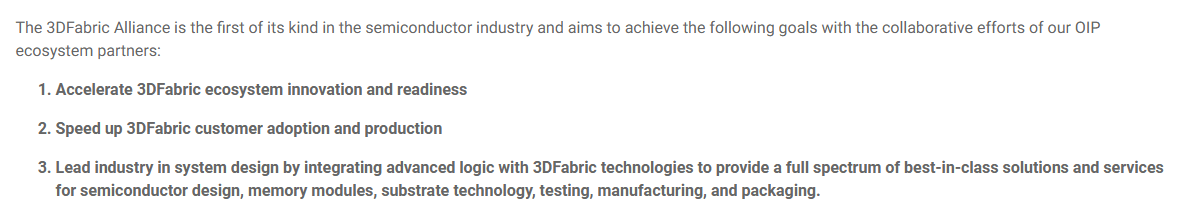
We then compared the company with other foundries such as SMIC, GlobalFoundries, UMC, Samsung, and Intel, to determine whether the company has an advantage in having both front-end and back-end processes. We compiled the front-end processes which include Oxidation and Coating, Lithography, Etching, Doping, and Metal Deposition, and back-end processes which include Wafer Bumping, Wafer Sort, Assembly, and Testing.
|
Front End and Back End |
SMIC |
GlobalFoundries |
UMC |
TSMC |
Samsung |
Intel |
|
Oxidation and Coating (Front End) |
Yes |
Yes |
Yes |
Yes |
Yes |
Yes |
|
Lithography (Front End) |
Yes |
Yes |
Yes |
Yes |
Yes |
Yes |
|
Etching (Front End) |
Yes |
Yes |
Yes |
Yes |
Yes |
Yes |
|
Doping (Front End) |
Yes |
Yes |
Yes |
Yes |
Yes |
Yes |
|
Metal Deposition (Front End) |
Yes |
Yes |
Yes |
Yes |
Yes |
Yes |
|
Wafer Bumping (Back End) |
No |
No |
No |
Yes |
Yes |
Yes |
|
Wafer Sort (Back End) |
No |
No |
No |
Yes |
Yes |
Yes |
|
Assembly (Back End) |
No |
No |
No |
Yes |
Yes |
Yes |
|
Testing (Back End) |
No |
No |
No |
Yes |
Yes |
Yes |
|
Frontend Score |
1 (4/5) |
1 (5/5) |
1 (5/5) |
1 (5/5) |
1 (5/5) |
1 (5/5) |
|
Backend Score |
0 (0/4) |
0 (0/4) |
0 (0/4) |
1 (4/4) |
1 (4/4) |
1 (4/4) |
|
Integration Scaling Factor Score |
0.00 |
0.00 |
0.00 |
1.50 |
1.50 |
1.50 |
Source: Company Data, Khaveen Investments
Based on the above, all companies listed possess full capabilities in the front-end fabrication processes. In terms of back-end processes, companies including SMIC, GlobalFoundries, and UMC do not possess any back-end fabrication capabilities; hence these companies have established partnerships with other third-party OSAT companies to outsource the back-end processes. On the other hand, companies such as TSMC, Samsung, and Intel are capable of the complete fabrication process including internal OSAT capabilities that cater to external customers. For example, Intel has partnerships with NVIDIA to provide advanced packaging technology and produce about “5,000 Foveros wafers monthly” for NVIDIA. Additionally, Samsung also has a partnership with NVIDIA to provide interposer and 2.5D advanced packaging technology for NVIDIA’s GPU. Thus, we calculated a front-end and back-end score for each of the companies and further derived an integrating scaling factor score by multiplying the front-end and back-end score with a scaling factor of 1.5.
Overall, we believe TSMC’s integration between foundry and OSAT provides it with benefits as several of its top customers such as Apple, Nvidia, AMD, Broadcom, and Qualcomm (55% of TSMC revenue) utilize both its foundry and OSAT capabilities. Moreover, we identified TSMC as one of the few foundries that have complete front-end and back-end fabrication process capabilities besides Intel and Samsung Foundry; thus, we derived an integration scaling factor score of 1.5 for TSMC.
Khaveen Investments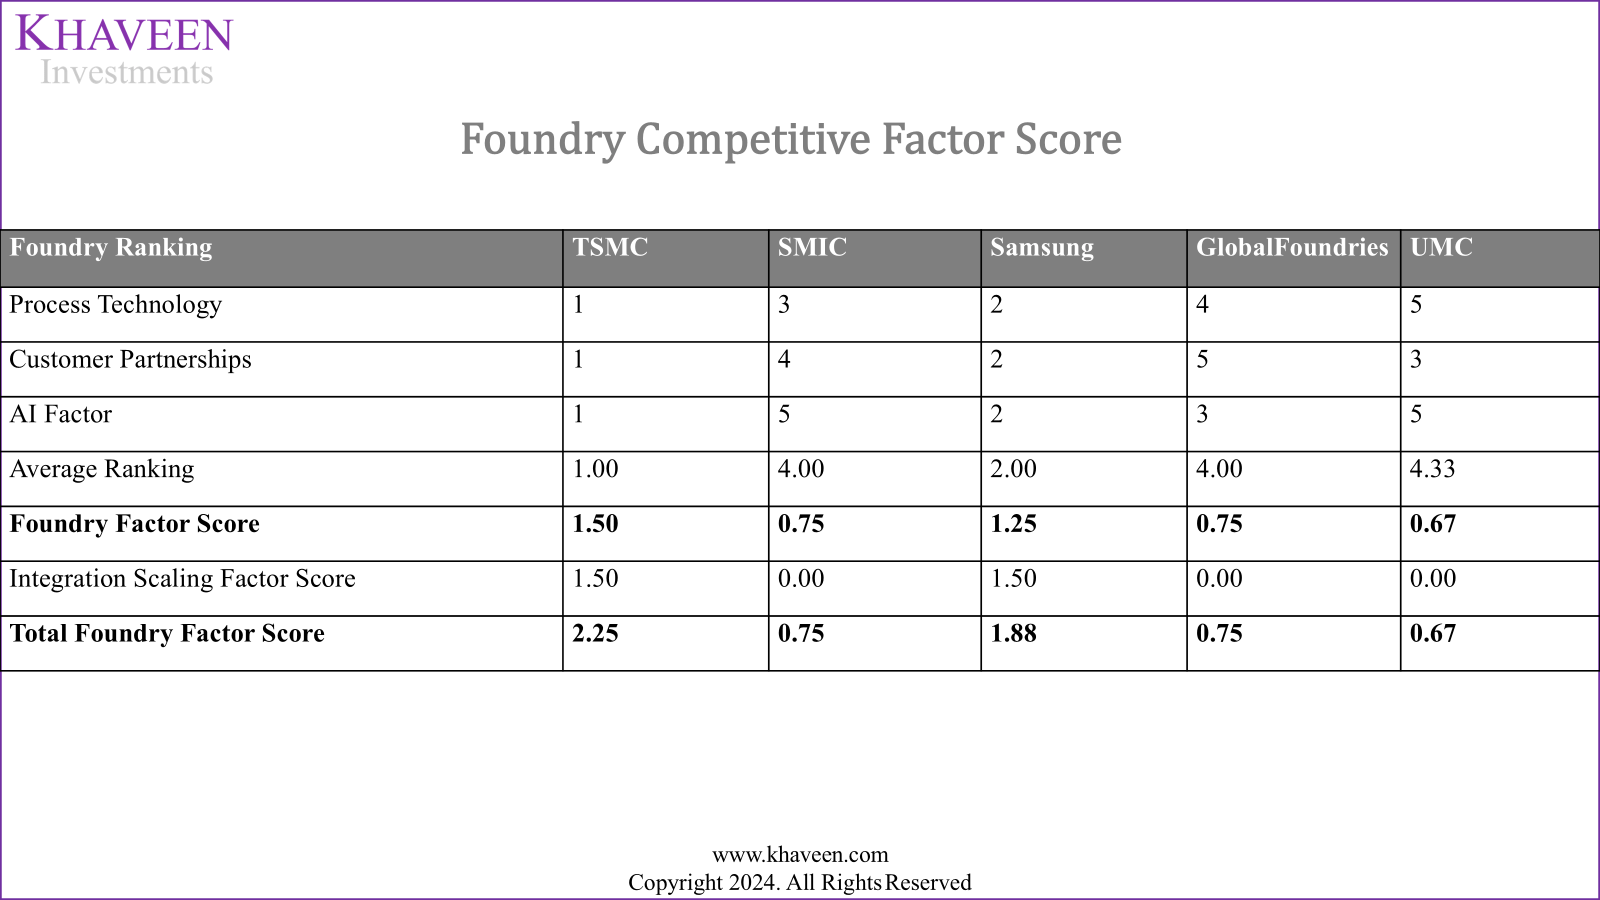
We applied our integration factor score of 1.5x in our previous foundry competitive factor score analysis of TSMC as we expect the integration of its foundry and OSAT to benefit its foundry growth. Based on a foundry competitive factor score of 1.5x multiplied by our integration scaling factor score of 1.5x, we derived a total foundry factor score of 2.25x for TSMC’s foundry growth.
Khaveen Investment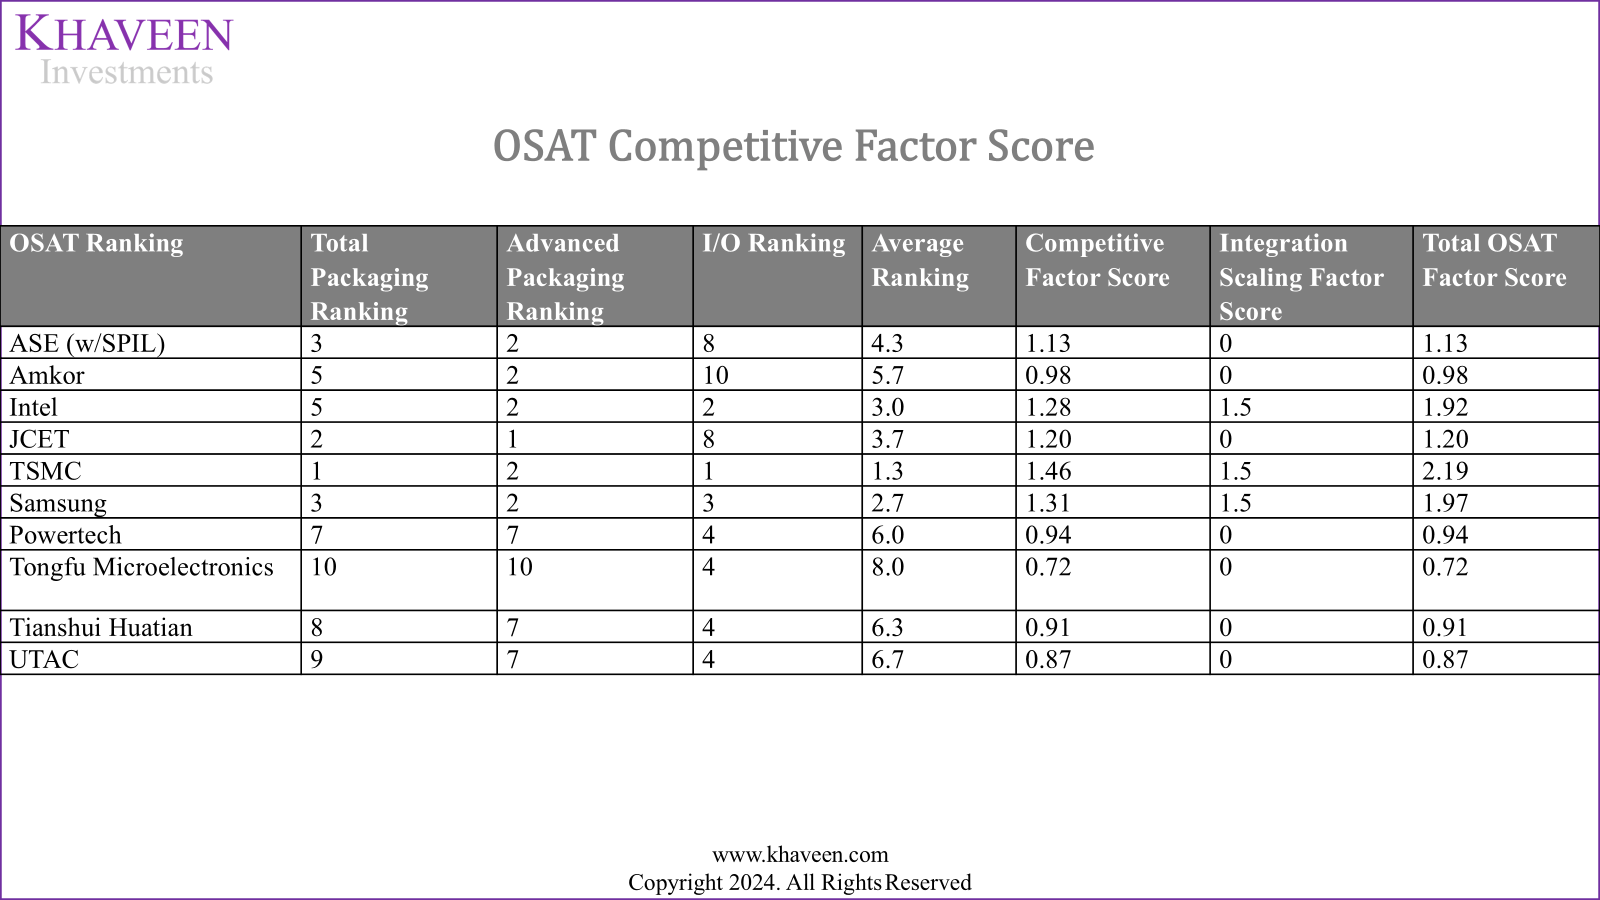
Furthermore, we also applied our integration factor score of 1.5x in our previous OSAT competitive factor score analysis as we expect TSMC, Samsung, and Intel’s OSAT growth to benefit from the integration with their foundry. For TSMC, we calculated a total factor score of 2.19x, the highest among competitors, by multiplying our OSAT competitive factor score for the company of 1.46x by our integration scaling factor score of 1.5x. Previously, we had ranked TSMC as the highest in both foundry and OSAT, however, our revised factor score is even higher. Furthermore, our factor score for both Intel and Samsung is also higher; therefore, we see these companies widening the gap with the rest of the competitors in the foundry and OSAT markets, where we see TSMC as the best among the rest.
Rising Market Positioning
In the next section, we examined the company’s market positioning in the foundry and OSAT market. This is as management highlighted that the company’s market share based on Foundry 2.0 “was 28% in 2023” and also stated its expectations for it to increase.
We compiled the market share of the foundry and OSAT with TSMC and explained the trend in the company’s market share in each market. In the first section, we calculated the Foundry 2.0 total market estimates, including the IDM opportunity for TSMC. We derive 3 scenarios as the bear, base, and bull case to estimate the total IDM opportunity based on the likelihood of the IDMs switching to external foundries and OSATs:
- Bear Case: Assuming 0% of the existing IDMs switch to third-party foundries and OSATs. However, this is unlikely as we explained in the first section that IDMs such as Intel, NXP, STMicro, Infineon, and ADI have been outsourcing production to TSMC.
- Base Case: Assuming 40% of the existing IDMs switch to third-party foundries and OSATs. We calculated this based on the IDM share of semicon sales of 67% subtracted by our calculated government subsidies of the total IDM capex of 27%, based on annual estimates of government incentives in the US, China, Korea, EU, Taiwan, Japan of $20.7 bln per year and total top IDMs capex of 2023 of $75.7 bln in 2023 ((67% x $ $253 bln) – (27% x $253 bln) = $169 bln – $69 bln = $100 bln)
- Bull Case: Assuming 100% of the existing IDMs switch to third-party foundries and OSATs. However, we believe this is unlikely, as some IDMs still want to maintain some overproduction. Additionally, IDMs have also incurred sunk costs due to high investments in fabs, but they also benefit from substantial government subsidies.
We believe the base case is the most likely, as we highlighted examples of IDMs that already outsource some production to foundries such as TSMC. We also believe the bull case is unlikely as it would result in an increased concentration risk of semicon manufacturing to other third parties and limit the control over production by companies, which might spur government intervention to keep some semicon manufacturing within their countries.
Foundry Market Share
TrendForce, Company Data, Khaveen Investments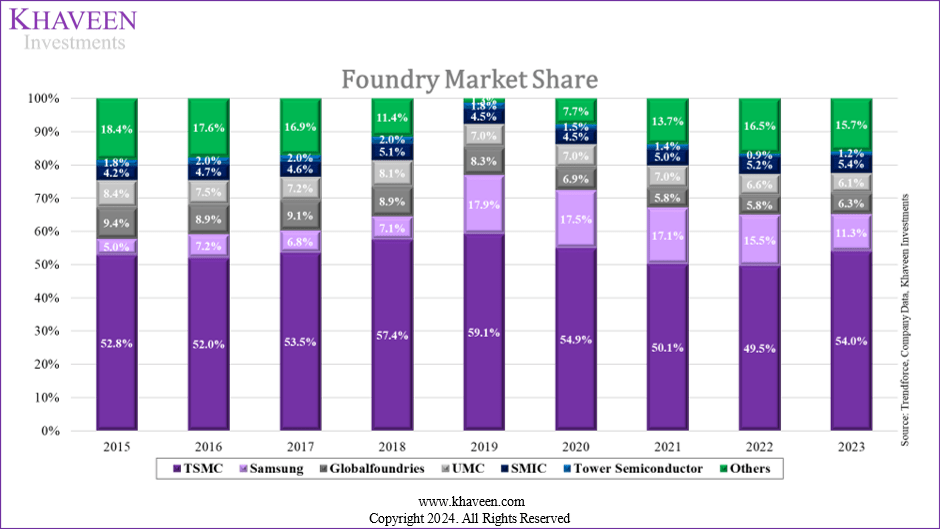
In the foundry market, TSMC’s market share had hovering at above 50% over the period except in 2022. Between 2019 to 2022, the company’s market share decreased slightly but recovered strongly in 2023. In our previous analysis of TSMC, we highlighted the company’s competitive advantages in the foundry market with its largest customer partnerships, foundry process capabilities, and AI Factor. Specifically, we highlighted the company has the greatest number of customer partnerships with 12 top semicon firms. We also highlighted its 3nm process technology, which had grown to 15% of revenues in Q2 2024, and has a positive roadmap as it is expected to launch 2nm in 2025 followed by 1.4 nm in 2027. Additionally, we ranked highly in the AI factor due to the company’s partnerships with key companies to produce their AI chips such as Nvidia, AMD, Qualcomm, Marvell, Apple, and Microsoft.
OSAT Market Share
Yole, Company Data, Khaveen Investments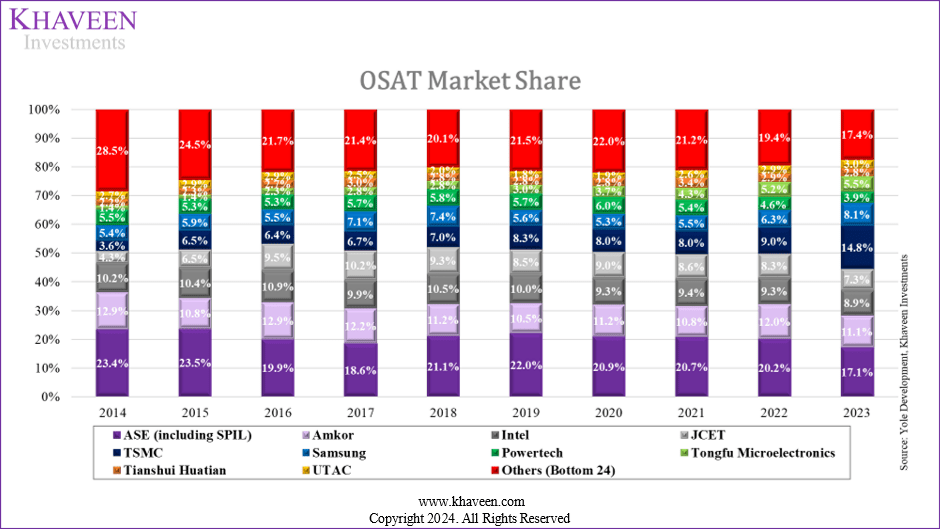
In the OSAT market, the market share chart above shows TSMC’s robust growth, rising from 3.6% in 2014 to 14.8% in 2023. One of the competitive advantages of TSMC we determined was its advanced packaging capabilities. For example, the company’s CoWos packaging is used by key companies such as Nvidia and AMD for their data center GPUs including Hopper, Blackwell, and MI300. Furthermore, the company highlighted in its earnings briefing, that it expects the advanced packaging growth outlook to remain positive, citing that its capacity is tight until 2025 and affirmed continued plans for expansion of CoWoS capacity through 2026.
Outlook
Overall, we highlighted TSMC’s increasing market position in both the foundry and OSAT markets which we expect the company to continue to maintain its strong market positions in due to its strong process technology capabilities, customers, and AI factor in the foundry market where it dominates with 54% market share, as well as its strong advanced packaging capabilities and continued planned expansions of CoWoS capacity in the OSAT market where it has been gaining share.
|
TSMC Revenue Projections ($ mln) |
2023 |
2024F |
2025F |
2026F |
|
Wafer Revenue |
60,438 |
76,892 |
97,826 |
124,459 |
|
Growth % |
27.2% |
27.2% |
27.2% |
|
|
OSAT Revenue |
8,529 |
9,817 |
11,301 |
13,009 |
|
Growth % |
15.1% |
15.1% |
15.1% |
|
|
Others |
1,453 |
1,449 |
1,445 |
1,441 |
|
Growth % |
-0.3% |
-0.3% |
-0.3% |
|
|
Total Revenues |
70,419 |
88,158 |
110,571 |
138,908 |
|
Total Growth % |
-4.4% |
25.2% |
25.4% |
25.6% |
Source: Company Data, Khaveen Investments
Based on our previous analysis, we forecasted the company’s revenues by wafer, OSAT, and other revenues. For wafer revenues, we based it on our foundry market CAGR of 12.1% multiplied by a factor score of 1.5 which we determined based on criteria factors such as process capabilities, customer partnerships, and AI factors. Moreover, we updated our forecasts for the OSAT revenue growth from our recent analysis of ASE, where we derived a factor score of 1.46x for TSMC based on its advanced packaging capabilities. Now, we further applied the Integration Scaling Factor Score for the wafer revenue and OSAT revenue of 1.5x, resulting in a segment revenue growth rate of 27.2% and 15.1%, respectively. For the Others revenue, we based it on the company’s 10-year average growth % at -0.3%. With the three segments together, we projected TSMC’s forward growth to be at 25.2% in 2024, which is in line with management’s latest guidance “slightly above mid-20s percent in US dollar terms” for 2024.
|
TSMC Market Share |
2023 |
2024F |
2025F |
2026F |
2027F |
2028F |
|
IDM (Foundry/OSAT) Opportunity (Base Case) |
100,251 |
109,074 |
118,672 |
129,115 |
140,477 |
152,839 |
|
Foundry |
117,409 |
131,616 |
147,542 |
165,394 |
185,407 |
207,841 |
|
OSAT |
57,473 |
61,381 |
65,555 |
70,012 |
74,773 |
79,858 |
|
Total Opportunity (Base Case) |
100,251 |
109,074 |
118,672 |
129,115 |
140,477 |
152,839 |
|
Growth % |
8.8% |
8.8% |
8.8% |
8.8% |
8.8% |
|
|
TSMC Revenue |
70,419 |
88,158 |
110,571 |
138,908 |
167,387 |
194,841 |
|
Growth % |
-4.4% |
25.2% |
25.4% |
25.6% |
-4.4% |
25.2% |
|
TSMC Market Share (Foundry 2.0) |
26% |
29% |
33% |
38% |
42% |
44% |
Source: Company Data, Khaveen Investments
Additionally, we calculated TSMC’s market share to be 26% based on our total opportunity for TSMC estimate in 2024, which is lower compared to TSMC’s market share in the foundry market of 54%, which is also in line with management’s market share of “28% in 2023”, which, we believe, is based on its total Foundry 2.0 market opportunity calculation of $250 bln. Going forward, we see TSMC’s market share rising based on our revenue projections to 44% by 2028, due to its strengths in foundry and OSAT markets as mentioned.
Risk: Geopolitical Tensions
We believe one of the risks for TSMC is geopolitical tensions with the US-China trade war. Previously, TSMC had been subjected to US sanctions on doing business with Chinese customers such as Huawei, which it has since stopped. The US had provided TSMC with government subsidies to expand production in the US. However, the conditions for government subsidies included limitations on production expansion in China, however, the company received temporary waivers to continue procuring US equipment for its expansion in the country. If the US government decides to impose more sanctions on TSMC, we believe it could impact its growth outlook. Additionally, Taiwan, which accounts for around 60% of the foundry market share, could spur more initiatives for the US to promote domestic semiconductor production and competitors of TSMC.
Valuation
The main difference in our forecasts is the increase in revenue growth we expect for the company. If TSMC can execute its Foundry 2.0 plans even on a moderate basis, we forecast revenue projections at a 5-year forward average of 21.2%, higher than the 15.4% we previously expected.
Khaveen Investments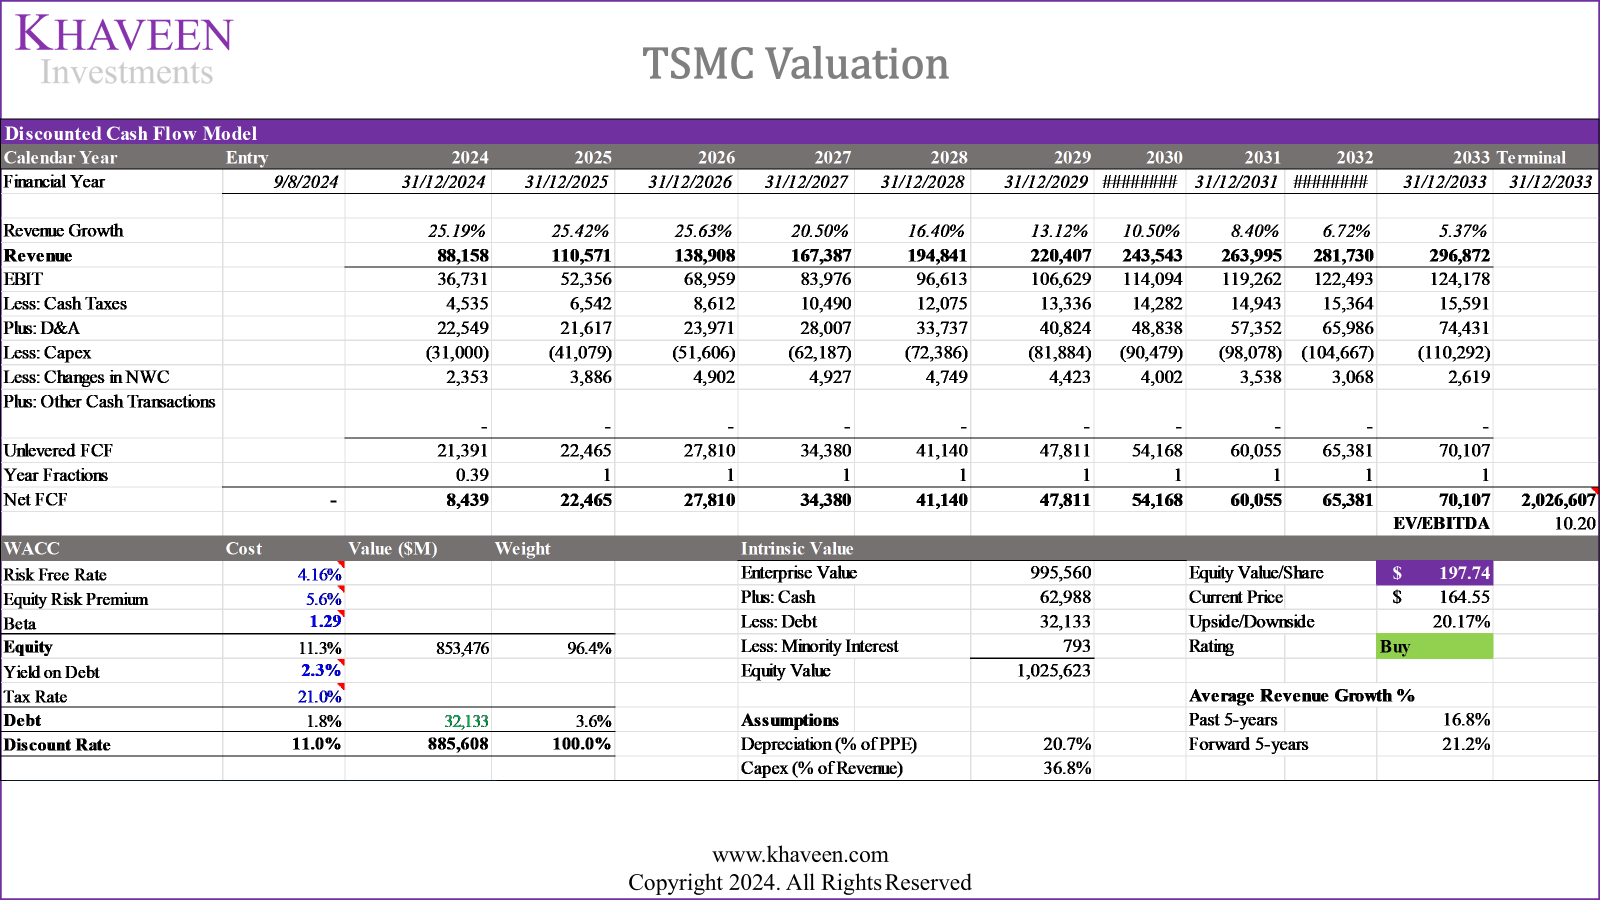
We updated our DCF valuation with these new growth forecasts. Based on a discount rate of 11%, which is derived from our calculation of the company’s WACC with a risk-free rate of 4.16% (US 10-year yield), equity risk premium of 5.6% (expected return of US equity) given the company’s dependence on the US market with North America accounting for 68% of revenues, and the company’s 5-year average beta of 1.29x, as well as a yield on debt of 2.3% (company’s bond yield). Furthermore, using the 5-year average top semicon foundry companies’ EV/EBITDA of 10.20x, our model shows an upside of 20.17%.
Verdict
All in all, we calculated a massive total market opportunity of $253.5 bln for Foundry 2.0, which includes front-end foundry services (wafer fabrication and masking), back-end services (packaging and testing, OSAT), and IDM opportunities related to the shift of production to third parties like TSMC, in line with management’s estimates of $250 bln. We believe TSMC benefits from its integration of foundry and OSAT services, especially with top customers, offering complete front-end and back-end fabrication capabilities. Applying the integration scaling factor score, we projected segment revenue growth rates of 27.2% for wafer and 15.1% for OSAT.
In total, we revised our revenue projections for the company higher, at 25.2% in 2024 and a 5-year forward of 21.2%. This represents a higher growth forecast than we previously projected (15.4%), highlighting a robust growth outlook for the company in the long term. Additionally, we see TSMC’s market share rising to 44% by 2028 from 26% in 2023. Overall, we rate the company as a Buy with a higher price target of $197.74, compared to $169.11 previously, mainly due to the stronger growth outlook at a 5-year forward average of 21.2% vs 15.4%.
Editor’s Note: This article was submitted as part of Seeking Alpha’s Best Growth Idea investment competition, which runs through August 9. With cash prizes, this competition — open to all analysts — is one you don’t want to miss. If you are interested in becoming an analyst and taking part in the competition, click here to find out more and submit your article today!
Analyst’s Disclosure: I/we have a beneficial long position in the shares of TSM either through stock ownership, options, or other derivatives. I wrote this article myself, and it expresses my own opinions. I am not receiving compensation for it (other than from Seeking Alpha). I have no business relationship with any company whose stock is mentioned in this article.
No information in this publication is intended as investment, tax, accounting, or legal advice, or as an offer/solicitation to sell or buy. Material provided in this publication is for educational purposes only, and was prepared from sources and data believed to be reliable, but we do not guarantee its accuracy or completeness.
Seeking Alpha’s Disclosure: Past performance is no guarantee of future results. No recommendation or advice is being given as to whether any investment is suitable for a particular investor. Any views or opinions expressed above may not reflect those of Seeking Alpha as a whole. Seeking Alpha is not a licensed securities dealer, broker or US investment adviser or investment bank. Our analysts are third party authors that include both professional investors and individual investors who may not be licensed or certified by any institute or regulatory body.