Summary:
- KLA’s defect inspection and metrology equipment are essential for economically manufacturing advanced chips.
- The company returns value to investors through dividends and highly accretive share repurchases.
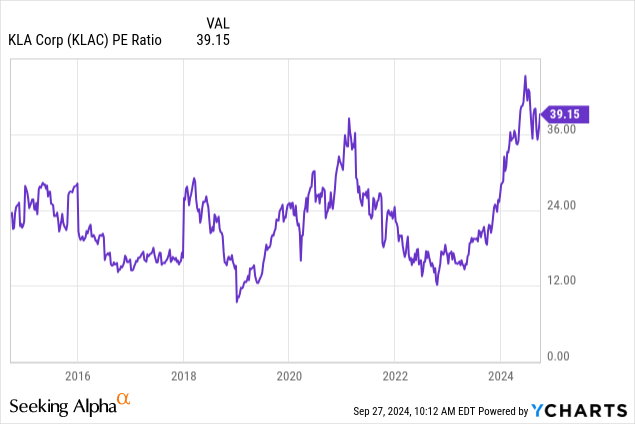
- KLA’s current P/E ratio of 39.15 is significantly above its historical median, indicating potential overvaluation.
- A rebounding semiconductor equipment market, product demand, and KLA’s leadership in its segment make it a buy.
PonyWang
KLA Corp (NASDAQ:KLAC) benefits from new technology that requires more powerful, power-efficient, and complex chips, driving increased demand for process control solutions. The company’s two most important products are defect inspection and review systems, which identify flaws in a chip early in the manufacturing process, and inspection and metrology machines, which precisely measure the physical properties of a chip, such as the size and shape of patterns, thickness and alignment of different layers, and electro-optical properties. These tools help improve chip yield, the percentage of working chips divided by the total number of possible chips. If a semiconductor manufacturer’s chip yield is too low, it can negatively impact its profitability — a reason KLA’s equipment is vital. The market knows KLA’s importance in the chip manufacturing industry; the stock has been up nearly 400% over the last five years.
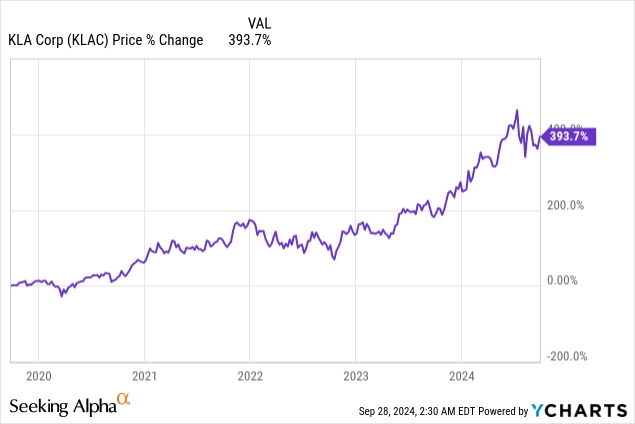
The company reported its fourth quarter fiscal year (“FY”) 2024 earnings on July 24. Despite delivering a beat-and-raise quarter and its potential upside in the generative artificial intelligence (“AI”) era, some worry about the company’s valuation, as the stock price has been lackluster post-earnings. KLA closed July 24 before earnings at $754.39; the stock’s closing price on September 27 is only up 3.7% to $782.40.
This article will discuss KLA’s growth drivers and business fundamentals. It will also review a few risks, the valuation, and why the stock is a buy despite valuation worries.
Growth drivers for KLA’s business
Chip manufacturers primarily use two wafer circumferences to make chips: 200 mm (~8 inches) and 300 mm (~12 inches). The move toward the 300 mm wafer started decades ago, motivated by lower costs and more chips per wafer. Still, 200 mm wafers may be more cost-effective for some components and applications that do not require the most advanced manufacturing processes. For instance, manufacturers make many power and analog chips, MEMS (Microelectromechanical Systems), IoT (Internet of Things) sensors, radio frequency (“RF”), and automotive devices on 200 mm wafers.
The increased electrification of autos and the proliferation of 5G, IoT, mobile, the cloud, and AI-powered devices have driven the need for more 200mm and 300mm wafer semiconductor manufacturing plants. Semi’s 200 mm Fab outlook forecasts the number of Fabs (semiconductor fabrication plants) rising from 236 at the end of 2024 to 254 at the end of 2027. All new Fabs will require equipment to manufacture the chips, benefitting semiconductor equipment manufacturers like KLA.
Generative AI, high-performance computing, cloud computing, and sophisticated AI-powered mobile devices have driven demand for advanced semiconductors. Semi’s 300 mm equipment spending outlook forecasts spending rising from 4% in 2024 to 24% in 2025. KLA’s process control equipment is vital for semiconductor companies to manufacture 300 mm wafers. Larger wafer sizes often mean more defects and potentially higher costs, driving the need for inspection equipment to find defects early and help prevent low-yield wafers. If Semi’s forecast is valid, demand for KLA’s process control should rise significantly in 2025.
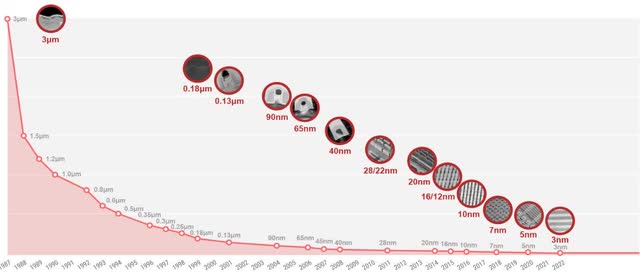
Additionally, chip manufacturers have moved to increasingly smaller process nodes (the size of features on a chip). Samsung has a 3-nanometer (“nm”) process node chip on the market. Taiwan Semiconductor (TSM) also introduced a 3-nm process node in 2022 and is currently working on a 2-nm process node chip due for a 2025 release.
KLA Semiconductor Process Control President Ahmad Khan said at the Goldman Sachs Communacopia + Technology Conference 2024 (emphasis added):
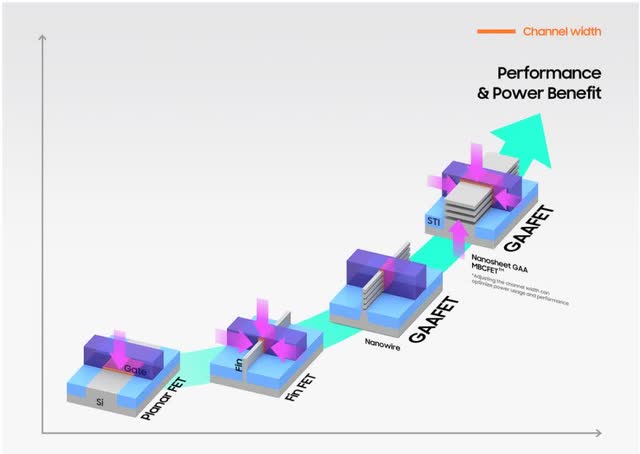
For N2 [2-nm chips], there’s a pretty large inflection in the transistor architecture change. You go from planar or FinFET to gate all around [GAA]. And these are very difficult transistors to make. Very, very few companies have been able to patent them and make them defect-free. It’s a stack of silicon, silicon germanium stack. And then after that, you have these recesses where you could have very, very small defects like 20 nanometers to 5-nanometer defects that can kill the entire device. So we worked about three to four years ago, seeing this inflection, we worked with imec, we worked with International Business Machines (IBM), we worked with TSMC [Taiwan Semiconductor] and everybody else to determine what is required, and we developed two new systems to characterize it.
As Ahmad Khan mentioned, smaller process nodes have driven semiconductor manufacturers toward different chip structures. The image below shows the evolution from planar FET (Field-Effect Transistor) to FinFET to Gate-All-Around (“GAA”) FET. Each move to a new structure raises the potential for creating defects on a wafer, driving the need for KLA’s defect inspection and metrology solutions.
Chief Financial Officer (“CFO”) Bren Higgins said on the company’s fourth quarter FY 2024 earnings call:
If you look back to the last local high and KLA share WFE, it was when the industry transitioned from planar to FinFet structures. So typically, architecture changes do drive [revenue growth] because of just the change that’s happening and the immaturity of the change, it does drive process control intensity to a higher level. So historically, it is proven. So Rick talked about not only inspection opportunities, but you are depositing a lot more layers, 20% to 30% more critical layers on the metrology side.
In less technical language, the above statement means that when chip architecture changes, demand for process control equipment goes up because new, immature technology often produces more defects. The CFO gave an example of the industry shift from planar to FinFet driving demand for defect inspection and metrology equipment. Since FinFET requires more thin film layers deposited on a wafer (20% to 30% more critical layers) and more layers drive the need for more precise measurement of the thickness and roughness of each layer, demand for KLA’s metrology tools rose during the evolution from planar to FinFET. The company expects a similar rise in demand as chip architecture moves from FinFET to GAAFET.
Last, the chip industry’s downturn in 2023 provided stiff headwinds to revenue growth industry-wide. The overall revenue of the top five semiconductor equipment (including KLA) slumped in 2023. Those headwinds have turned into tailwinds in 2024, and experts expect significant growth in 2025. Management is bullish on KLA’s prospects next year.
Company fundamentals
Semiconductor Process Control, which accounts for 90% of revenue and includes inspection, metrology, and software products, rose 10% year-over-year to $2.30 billion. Specialty Semiconductor Processes, accounting for 5% of revenue, consist of advanced vacuum deposition and etch process tools used by specialty semiconductor customers, such as manufacturers of MEMS, RF semiconductors, and power semiconductors. It declined 6% year-over-year to $121 million. The likely culprit for the segment’s decline in 2024 is that power semiconductors often wind up in Electrical Vehicles (“EVs”), which had slowing growth in 2024. Additionally, RF semiconductors end up in mobile and IoT devices, which have decelerated growth in recent years and are due for a rebound. Last, the PCB (printed circuit board), Display, and Component Inspection segment, accounting for 5% of revenue, consists of products and services for inspecting, testing, and measuring PCBs, IC (integrated circuits) substrates, FPDs (flat panel displays) and packaged ICs. The segment’s revenue rose 9% year-over-year to $140 million.
KLA Fourth Quarter FY 2024 Investor Presentation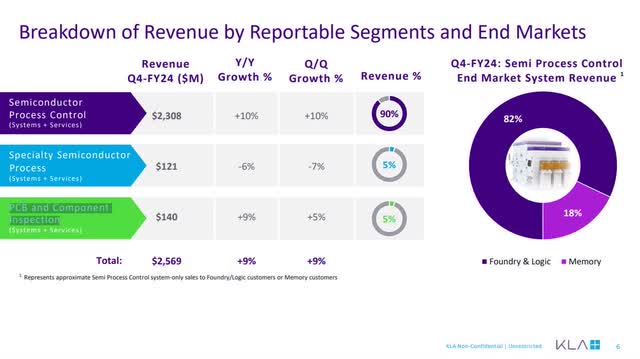
KLA’s second quarter 2024 revenue was up 9% year-over-year to $2.57 billion, beating analysts’ estimates by $54.93 million.
KLA’s June quarter GAAP (Generally Accepted Accounting Principles) gross margin is 60.65%, the highest among its WFE peers.
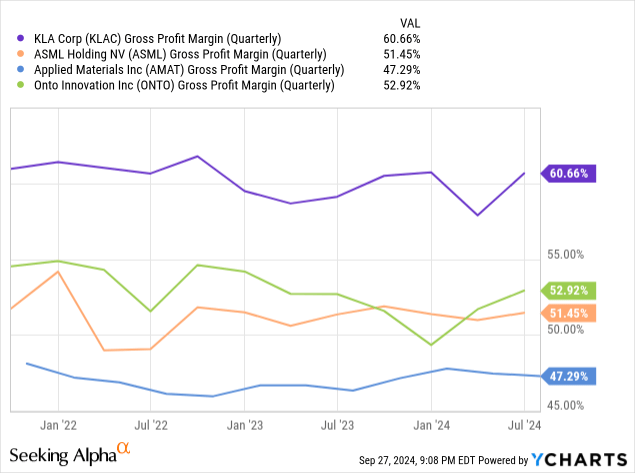
KLA’s investor presentation emphasizes non-GAAP (Generally Accepted Accounting Principles) metrics. Its non-GAAP gross margins rose 130 basis points (“bps”) to 62.5% over the previous year’s quarter, and its non-GAAP operating margins rose 290 bps to 41%.
KLA Fourth Quarter FY 2024 Investor Presentation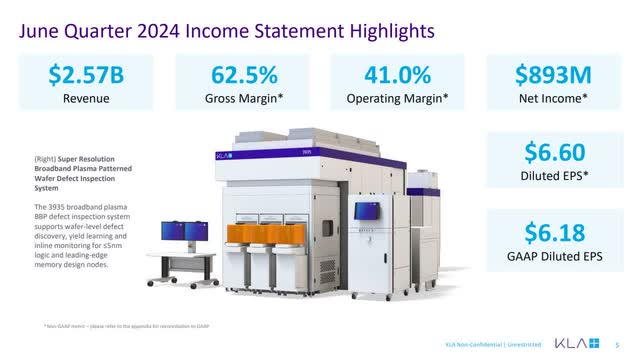
KLA’s fourth quarter FY 2024 non-GAAP net income grew $150 million year-over-year to $893 million. Non-GAAP diluted earnings-per-share (“EPS”) was $6.60, beating analysts’ expectations by $0.50. Its GAAP diluted EPS was $6.18, beating analysts’ expectations by $0.45.
The following table shows GAAP to non-GAAP reconciliation. Since KLA has many one-time and non-cash expenses, non-GAAP metrics give a clearer picture of its core profitability.
KLA Fourth Quarter 2024 Earnings Release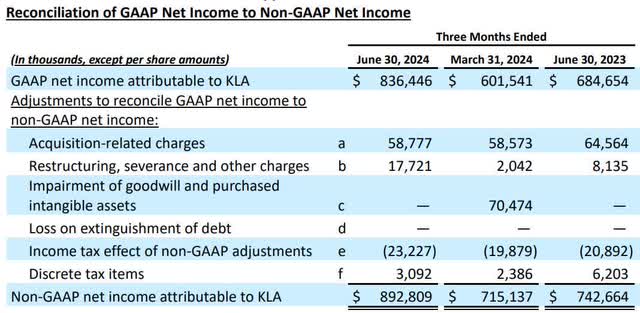
KLA’s TTM cash flow from operations (“CFO”) to sales is 33.71%, the highest among its semiconductor equipment peers. A higher percentage means a higher potential to turn sales into cash flow.
| Company name | TTM CFO-to-sales |
| KLA Corp | 33.71% |
| Lam Research (LRCX) | 31.21% |
| Applied Materials (AMAT) | 28.5% |
| Onto Innovation (ONTO) | 23.69% |
| ASML Holding (ASML) | 19.63% |
The following chart shows KLA’s annual and TTM free cash flow (“FCF”) and FCF margin.
KLA Fourth Quarter FY 2024 Investor Presentation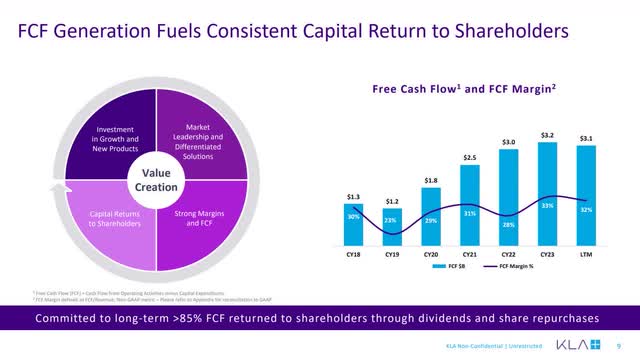
Please note at the bottom of the above investor slide that the company has committed to returning 85% of FCF to investors through dividends and share repurchases.
The company has an impressive history of dividend growth. The bar chart on the right in the image below shows a 15% compound annual growth rate (“CAGR”) over the last 17 years.
KLA Fourth Quarter FY 2024 Investor Presentation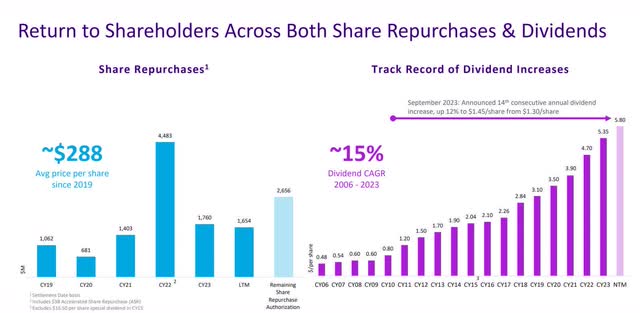
Notice that most buybacks occurred in 2022 when the stock price ranged from $250 to the low $400s throughout the year. The chart shows that the average price per share at which it bought back shares since 2019 was $288. Those share repurchases were highly accretive since the stock price ended September 27, 2024, at $782.40. The following chart shows the stock buybacks have reduced diluted shares outstanding from nearly 160 million at the beginning of 2020 to 135.46 million at the end of the June 2024 quarter.
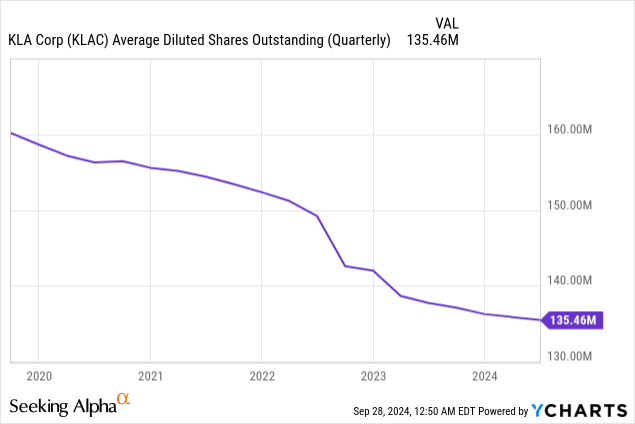
Investors can loosely use the buyback yield, the repurchase of outstanding shares over the company’s market cap, to determine a stock’s valuation. If a stock’s historical buyback yield is historically high, the market may undervalue it. If a stock’s buyback yield is lower than its historical mean, the market may overvalue it. The company’s buyback yield at the end of June 2024 is 1.88%, compared to its mean buyback yield of 2.42% over the last five years, suggesting the market overvalues the stock. KLA sold above its buyback yield mean between its March 2022 and December 2023 quarters, hitting a high over the last five years of 8.61% in its December 2022 quarter — an excellent time to purchase KLA. Remember this metric when we get to the valuation section.
KLA Fourth Quarter FY 2024 Investor Presentation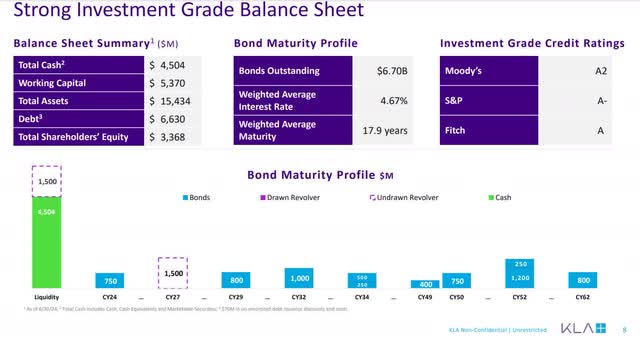
KLA’s debt-to-equity ratio is 2.03, which means it aggressively funds its growth with debt. Its debt-to-EBITDA (Earnings Before Interest, Taxes, Depreciation, and Amortization) ratio is 1.51, indicating moderate debt relative to its core operating profits. The company’s credit ratings are upper medium grade, meaning its debt has a moderate risk level.
KLA Fourth Quarter FY 2024 Investor Presentation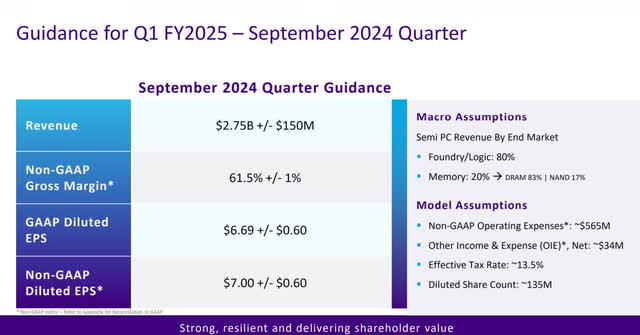
The midpoint of revenue guidance beat analysts’ estimates of $2.62 billion, and the midpoint of EPS guidance beat analysts’ estimates of $6.51 a share.
Risks
Competition is a significant long-term risk. Onto Innovation is a company in the inspection and metrology market that has the potential to challenge KLA. Over the last several years, Onto has taken market share in metrology and inspection for next-generation transistor architectures. Onto ended 2023 with 220 customers, with its two most significant clients being Samsung Semiconductor and Taiwan Semiconductor, each accounting for over 10% of its revenue.
The company has significant Chinese exposure, which is a major risk. China accounts for 44% of KLA’s revenue, and Taiwan accounts for an additional 20%. A severe conflict between China and Taiwan could disrupt 64% of its revenue. Even without an open conflict between China and Taiwan, all Chinese revenue is at risk due to political disagreements between the Chinese and the U.S. governments. The U.S. Bureau of Industry and Security has created complex export rules over the last several years that have hurt KLA’s Chinese business. Besides, the U.S. rules making it harder to do business in China, management risks misinterpreting the rules, which could result in significant civil and criminal penalties if it accidentally steps over the line. Last, if relations between the U.S. and China worsen, either country could create additional rules or restrictions that could significantly harm KLA’s business.
Valuation
KLA’s price-to-earnings (P/E) ratio is 39.15. Its five-year P/E median is 23.71, and its ten-year median is 21.02. Because the stock is trading well above its median, some might conclude that the market is overvaluing it.
KLAC’s one-year forward PEG ratio is 1.93 (one-year forward P/E of 23.99 divided by analysts’ EPS estimated growth rate of 12.42%). Typically, growth investors will allow a growth stock to reach a PEG ratio of 2.0 before considering it overvalued. Consequently, some may consider the stock on the high end of fairly valued.
Let’s look at KLA’s reverse discounted cash flow (“DCF”) to determine what the September 27 closing price implies about the stock’s cash flow growth rate over the next ten years. This DCF uses a terminal growth rate of 3% because the company should continue steadily growing its cash flow above the market average after the ten-year analysis period. I use a discount rate of 10%, which is the opportunity cost of investing in KLA, reflecting a moderate risk level. This reverse DCF uses a levered FCF for the following analysis.
Reverse DCF
|
The third quarter of FY 2024 reported Free Cash Flow TTM (Trailing 12 months in millions) |
$3031 |
| Terminal growth rate | 3% |
| Discount Rate | 10% |
| Years 1–10 growth rate | 14.7% |
| Current Stock Price (September 27, 2024 closing price) | $782.40 |
| Terminal FCF value | $9.054 billion |
| Discounted Terminal Value | $44.477 billion |
| FCF margin | 30.9% |
Considering that the proliferation of AI should create higher demand for KLA’s process control services over the long term, it should maintain a 31% FCF margin over the next ten years. Its median FCF margin over the last ten years was 28.51%, and its maximum was 32.63%. So, KLA would need to grow revenue at 14.7% annually for the next ten years at an average FCF margin of 30.9% to justify a September 27, 2024, closing stock price of $782.40 — a growth rate that may be a bit of a stretch. Over the last ten years, the company grew its annual revenue at a 12.85% compound annual growth rate (“CAGR”). It may not be able to replicate a similar double-digit rate over the next ten years.
KLA’s 2023 Annual Shareholder Letter states:
The latest 2022 Gartner market share analysis published in April 2023 shows Process Control was the fastest-growing WFE market segment in calendar 2022, growing 30% year-over-year to $13.5 billion. Within Process Control, KLA increased market leadership in most major segments, resulting in an overall market share gain of roughly 300 basis points in 2022 to over 57%, or greater than 4x the nearest competitor.
Global Market Trends estimated that the semiconductor process control market was $14.5 billion in 2023. At the end of its FY 2024 (June 30, 2024), the company generated $9.81 billion in annual revenue, capturing 67.65% market share. However, CSI Market claims KLA has an 89.39% market share in process control, with Onto Innovation as a distant second with a 7.74% market share. If those claims are valid, KLA’s total addressable market is only $10.97 billion. Regardless of which market size estimate is valid, KLA has already captured a significant chunk of the market, and it is hard to believe it will grow much faster than the overall process market. Two analysts’ reports on the internet estimate the growth rate of the process control market at around 6.6% to 7.6% annually to 2032. Since it’s unlikely that KLA will capture much more market share than it already has, it’s likely to grow around the rate of the process market. Assuming KLA and the semiconductor market grow at the same 7% growth rate over the next ten years, KLA will maintain its current market share, and the estimated intrinsic value of the stock is $447.03. Assuming the process market grows a very aggressive 10% annually over the next ten years, its estimated intrinsic value is $561.78. Investors that buy today make very aggressive revenue growth or FCF margin assumptions over the next ten years.
No one should assume that KLA will hit these exact numbers, as they are ballpark figures with many assumptions that may not pan out fully. The takeaway from this exercise is that the current stock price assumes aggressive revenue growth rates or that the company can average an FCF margin meaningfully above its median for the last ten years. If you factor in the fact that the company’s buyback yield is at the historically low end of its range, the market likely overvalues KLA in the long term. Only investors comfortable investing in an “overvalued” stock should consider buying it.
KLA is a buy
Aggressive investors who buy stocks with short-term time horizons may want to buy KLA and hold it over the next year or two. It has solid potential upside as the semiconductor equipment industry rebounds, new fabs come online, and chip manufacturers shift to new architectures. Industry experts expect a significant rebound in 2025 that may last into 2026. However, beyond 2026, downside risks rise substantially.
If you are an investor with a long-term mindset, you can still buy it. However, the ideal time to buy KLA was in 2022, when the buyback yield rose to well above its median. The company could potentially enter an industry downturn in 2027. The second quarter 2024 Market Data Pulse Newsletter states (emphasis added), “200mm fab equipment spending is expected to decline by 15% in 2024, recover in 2025 with 43%, and 21% in 2026. 2027 is expected to slow by -2% YoY, which may be due to a lack of visibility.” The following table shows that analysts expect KLA’s revenue growth to drop substantially in FY 2027 and FY 2028.
However, the secular demand for more efficient and powerful chips may help the industry and KLA grow well above analysts’ forecasts. There is also a possibility that the industry will become far less cyclical and may not dip in 2027. So, long-term investors who buy today count on revenue growth rates higher than analysts’ forecasts, while risking that those growth rates fail to come to fruition. I rate the stock as a buy for short-and long-term growth investors.
Analyst’s Disclosure: I/we have no stock, option or similar derivative position in any of the companies mentioned, and no plans to initiate any such positions within the next 72 hours. I wrote this article myself, and it expresses my own opinions. I am not receiving compensation for it (other than from Seeking Alpha). I have no business relationship with any company whose stock is mentioned in this article.
Seeking Alpha’s Disclosure: Past performance is no guarantee of future results. No recommendation or advice is being given as to whether any investment is suitable for a particular investor. Any views or opinions expressed above may not reflect those of Seeking Alpha as a whole. Seeking Alpha is not a licensed securities dealer, broker or US investment adviser or investment bank. Our analysts are third party authors that include both professional investors and individual investors who may not be licensed or certified by any institute or regulatory body.
