
Summary:
- UnitedHealth Group is the largest healthcare company in the world in terms of revenue.
- The company’s size is a result of the industry it operates in, rather than its unique business model, but it has established competitive advantages of its own.
- UnitedHealth has competitive advantages in value-based care, integration, and a diversified network, which contribute to its solid profitability and revenue growth outlook.
Wolterk
UnitedHealth Group Incorporated (NYSE:UNH) is a significant healthcare holding in our portfolio, playing a substantial role in the healthcare sector. It stands as the world’s largest healthcare company in terms of revenue, with $324.2 bln, and ranks 14th globally in terms of market capitalization. The only healthcare company with a larger market cap is Eli Lilly and Company (LLY), albeit with considerably lower revenue ($29.5 bln).
We examine UnitedHealth to gain insights into how its immense size impacts its success. Our analysis encompasses its business model, revenue structure, and the synergy among its various business segments. Additionally, we perform a competitive analysis to pinpoint distinctive advantages that differentiate UnitedHealth from its competitors.
Large Scale of Managed Care Industry
Given its size, it’s imperative to understand how its scale affects its business. There could be advantages to having a large scale, or disadvantages. To determine this, we first must understand if its size is attributed to the company’s business model, or due to the industry business model. We examine this by compiling financial metrics for a list of 60 Healthcare companies, consisting of the top 10 largest companies by revenue in each of the 6 Industries in the Healthcare Sector (Healthcare Equipment & Supplies, Healthcare Providers & Services, Healthcare Technology, Biotechnology, Pharmaceuticals, and Life Sciences Tools & Service). The average of these companies’ revenue, net income, and cash from operations of each Industry is presented below.
Company Data, Seeking Alpha, Khaveen Investments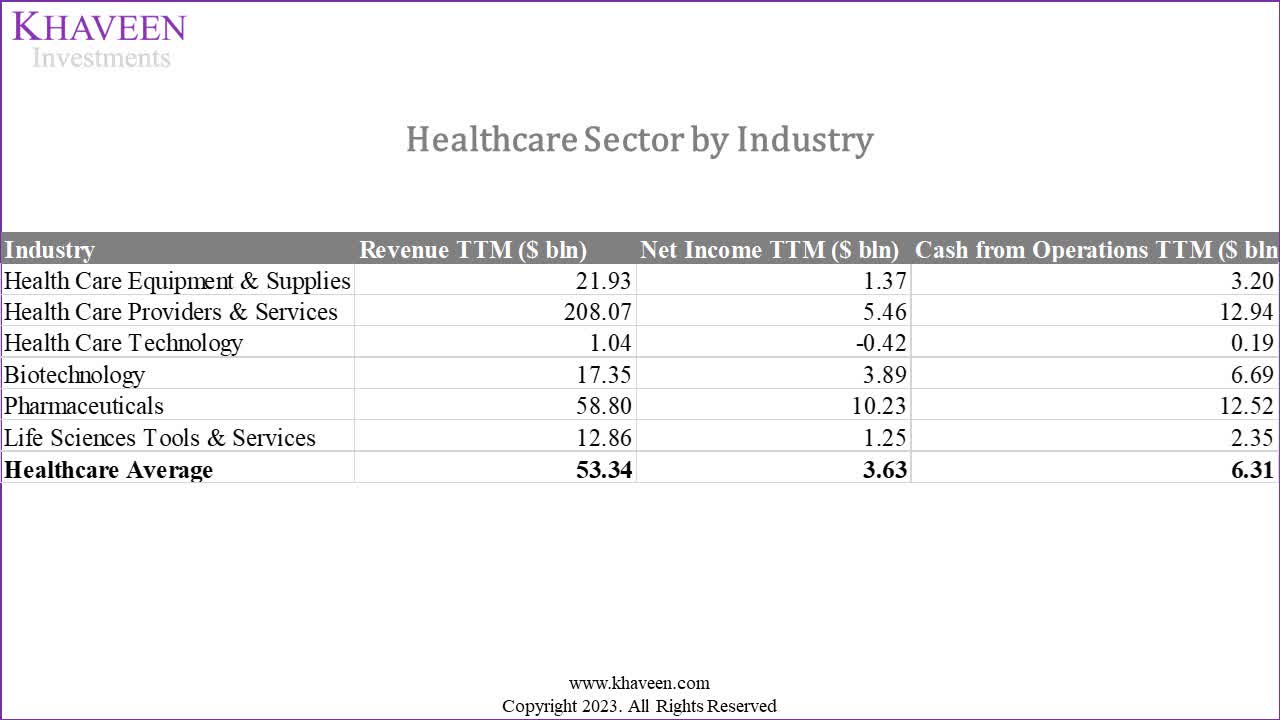
UnitedHealth operates in the Healthcare Providers & Services Industry, with the majority of its revenues coming from the Managed Healthcare sub-industry. Compiling the top 10 largest companies overall in the entire Healthcare Sector, it becomes more apparent the seemingly large revenues generated by companies in the Healthcare Providers & Services Industry, with the average company generating $208 bln in annual revenues, significantly higher than other industries (average of $53.34 bln).
Company Data, Seeking Alpha, Khaveen Investments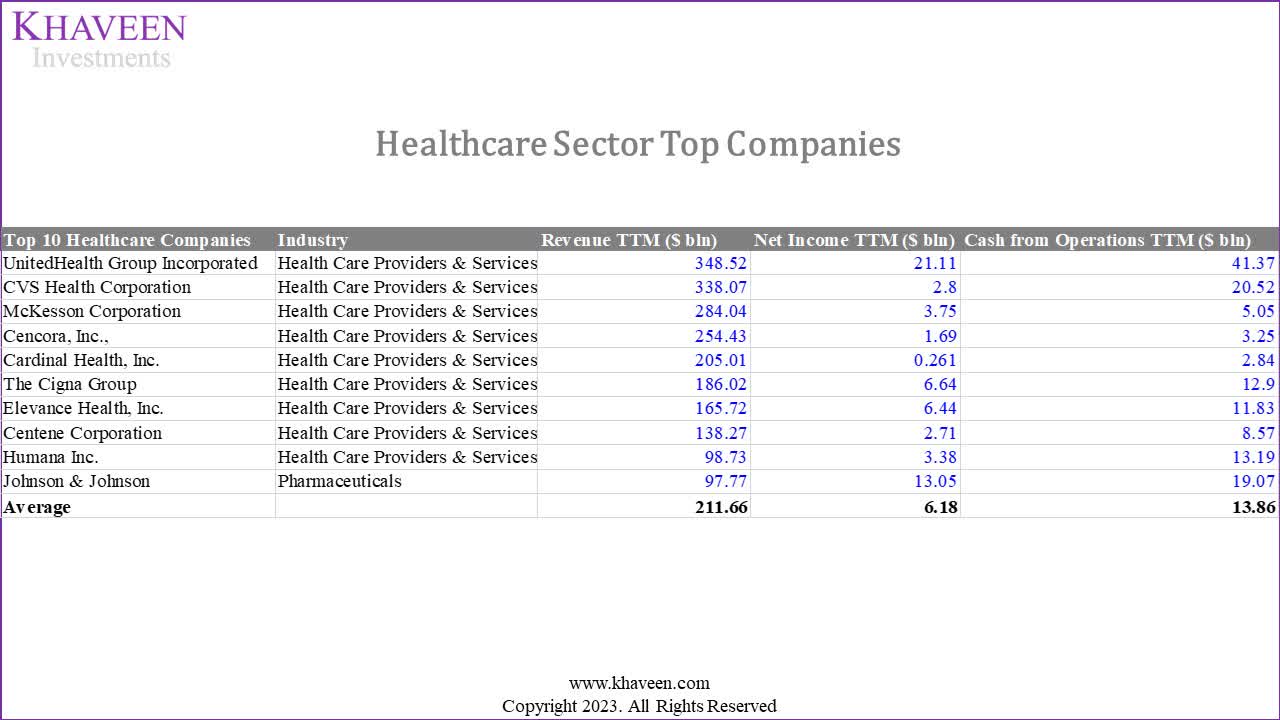
Additionally, the top 9 companies in the Healthcare Sector all operate within the Healthcare Providers & Services Industry. The 10th-place company, Johnson & Johnson (JNJ), operates in the Pharmaceuticals Industry. Eli Lilly, the healthcare company with the largest market cap in the world, is dwarfed in terms of revenue.
To understand the market breakdown overall, we obtained the Healthcare Sector breakdown by industry based on the top 10 companies in each industry and the breakdown based on all companies across the Sector.
Company Data, Khaveen Investments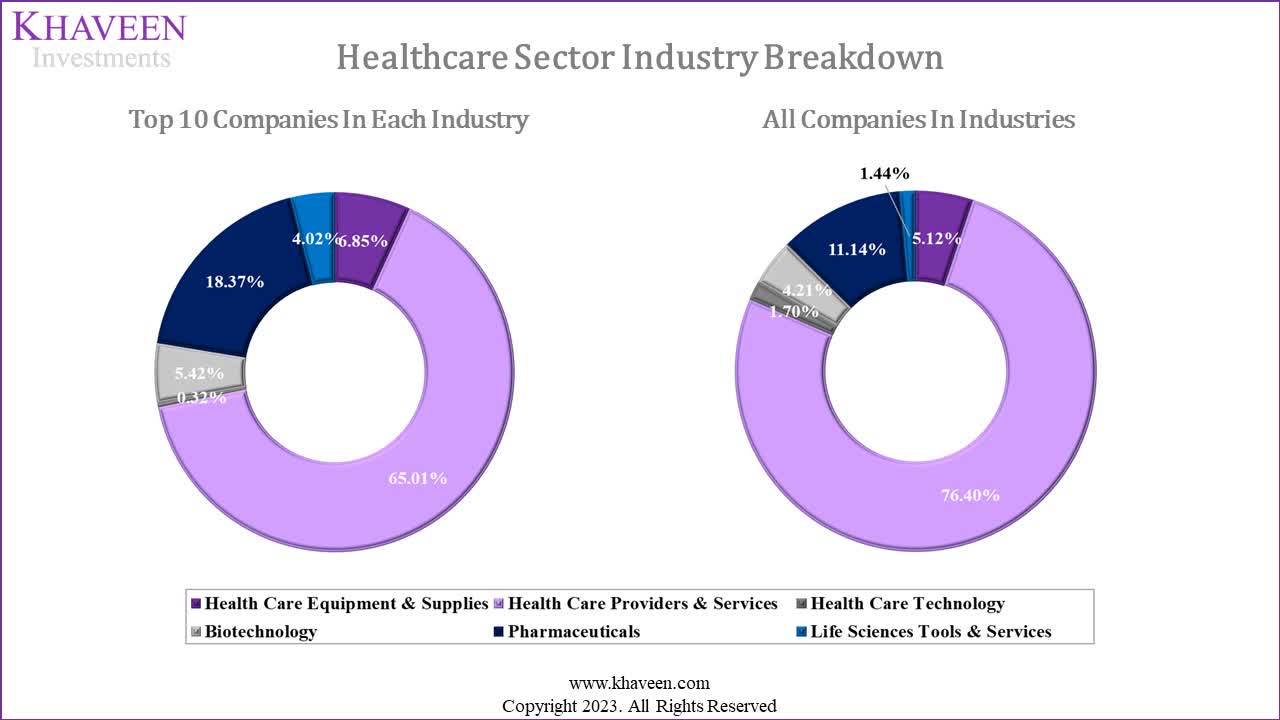
|
Industry |
Total Size ($ bln) |
Breakdown % |
|
Healthcare Equipment & Supplies |
512 |
5.12% |
|
Healthcare Providers & Services |
7,648 |
76.40% |
|
Healthcare Technology |
170 |
1.70% |
|
Biotechnology |
421 |
4.21% |
|
Pharmaceuticals |
1,115 |
11.14% |
|
Life Sciences Tools & Services |
144 |
1.44% |
|
Total Healthcare Sector |
10,011 |
100.00% |
Source: Fortune Business Insights, Statista, Grand View Research, Khaveen Investments
Looking at the breakdown when we include all companies in each industry and not just the Top 10 of each industry, the Healthcare Providers & Services Industry plays an even bigger role, taking up an even larger share. We look into the top 10 companies to understand more.
|
Top 10 Healthcare Providers & Services |
Sub-industries |
9-year Average Growth % |
|
UnitedHealth Group Incorporated |
Managed Healthcare |
11.5% |
|
CVS Health Corporation (CVS) |
Healthcare Services |
11.2% |
|
McKesson Corporation (MCK) |
Healthcare Distributors |
8.4% |
|
Cencora, Inc. (COR) |
Healthcare Distributors |
12.1% |
|
Cardinal Health, Inc. (CAH) |
Healthcare Distributors |
9.5% |
|
The Cigna Group (CI) |
Managed Healthcare |
30.6% |
|
Elevance Health, Inc. (ELV) |
Managed Healthcare |
9.3% |
|
Centene Corporation (CNC) |
Managed Healthcare |
34.2% |
|
Humana Inc. (HUM) |
Managed Healthcare |
9.6% |
|
HCA Healthcare, Inc. (HCA) |
Healthcare Facilities |
6.6% |
|
Average |
11.5% |
Source: Company Data, Khaveen Investments
As seen, there is only 1 Healthcare Facilities company in the top 10, but looking at the entire industry breakdown Healthcare Facilities make up 54.61%. We believe the lack of representation in the top 10 could be explained by the fact that Healthcare Facilities companies such as clinics and hospitals are largely private or government-owned instead of public-listed companies.
|
Healthcare Providers & Services |
Market Size ($ bln) |
Breakdown % |
|
Healthcare Distributors |
803 |
10.50% |
|
Managed Healthcare |
2,089 |
27.31% |
|
Healthcare Facilities |
4,176 |
54.61% |
|
Healthcare Services |
581 |
7.59% |
|
Total |
7,648 |
100.00% |
Source: Vantage Market Research, Fortune Business Insights, Statista, Grand View Research, Market Research Future, Khaveen Investments
Overall, it is clear from our analysis that UnitedHealth’s size is a function of the industry it operates within instead of its unique business model. As such, we now look into any industry-specific advantages the Healthcare Providers & Services Industry has over the other industries. We use the same dataset of the 60 companies we had (the top 10 largest companies by revenue in each of the 6 Industries in the Healthcare Sector). The financial metrics we examined were in terms of profitability (Gross Margins, EBIT Margins, Net Income Margins).
Company Data, Seeking Alpha, Khaveen Investments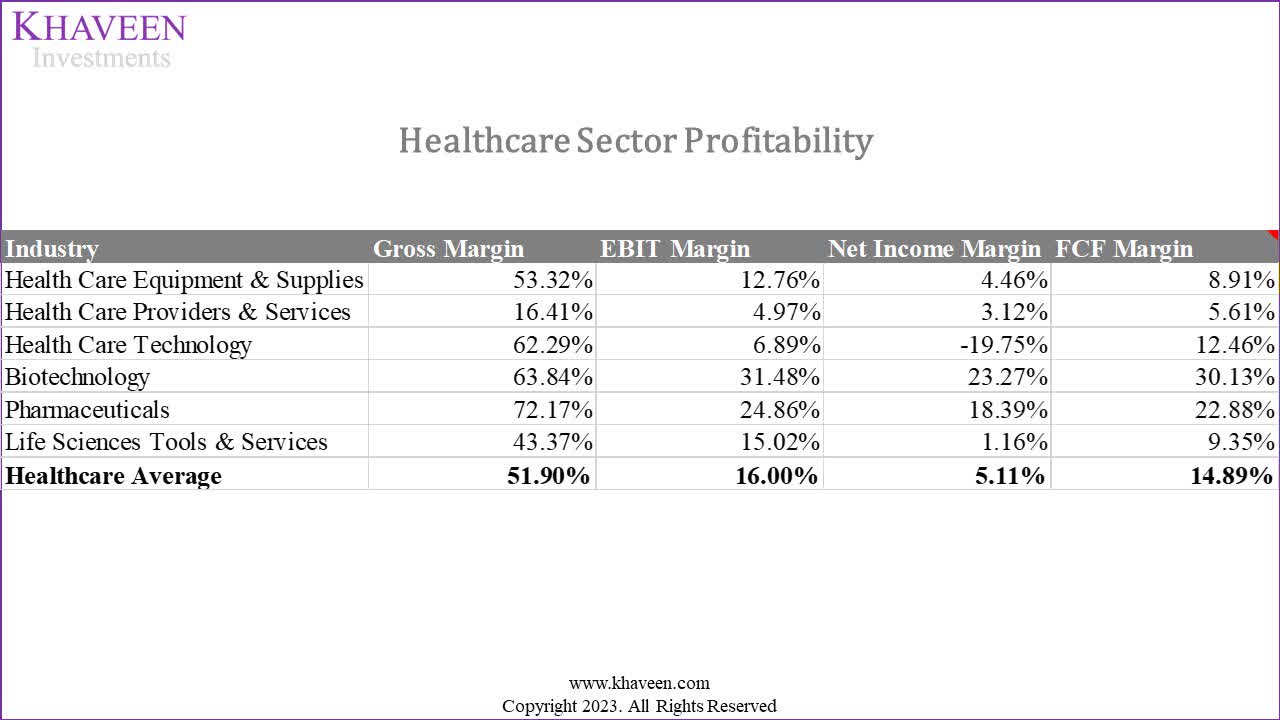
What stands out is the significantly lower gross margins in the Healthcare Providers & Services Industry, which of course flows to its EBIT and net margins as well. This may be related to the company’s revenue model, and to confirm that we looked to understand the revenue structure and sources for companies in this industry.
Revenue Model
The company generates revenue from insurance premiums. It has four revenue sources:
- Employer & Individual: Includes health insurance for individuals and employer-sponsored plans.
- Medicare and Retirement: Offers Medicare Advantage plans with various benefits such as hospital, outpatient and prescription drugs.
- Community and State: Focuses on state programs like Medicaid for economically disadvantaged individuals.
- Global segment: covers health insurance operations in international markets.
Company Data, Seeking Alpha, Khaveen Investments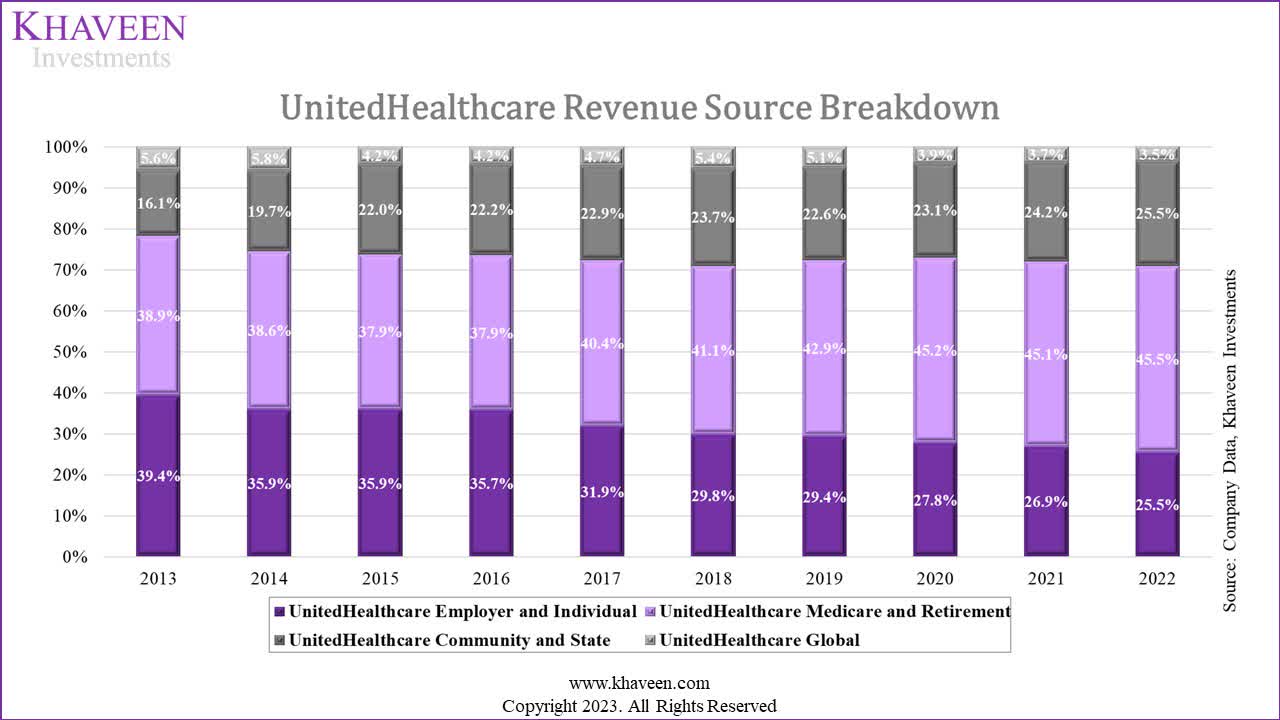
Looking at UnitedHealth’s revenue contributions by source, we see Medicare & Retirement, and Community & State contributing more and more, increasing their share of revenue significantly over the past 10 years, whereas Employer & Individual sources have seen their share contribution to total revenue decline significantly. We view this favorably as we consider government sources of income more stable compared to revenue from Employers & Individuals that could be affected by economic conditions.
Examining the reasons behind the low gross margins, we’ve identified that health insurance companies have a responsibility to cover the cost of medical care services for insured individuals, known as medical costs. These costs are estimated based on factors like historical medical costs per member (PMPM) trends. The Affordable Care Act mandates that a significant portion of premium revenues (80% to 85%) must be allocated to medical costs, resulting in low margins.
As seen below, 79% of UnitedHealth’s revenue in 2022 was derived from premiums. Assuming the minimum spending rule is applied to these premiums, margins would be reduced significantly.
Company Data, Seeking Alpha, Khaveen Investments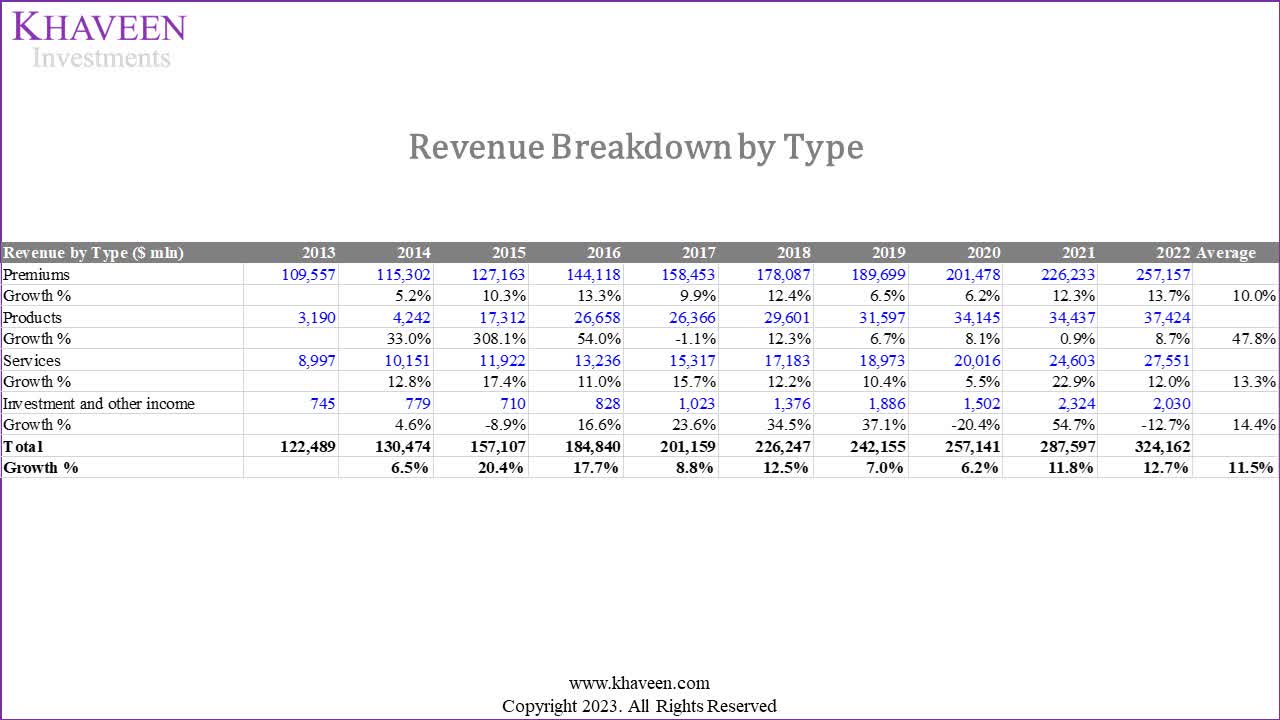
We see that the high revenue of these companies is a result of their revenue model that recognizes premiums paid as revenue, while their low margins are a result of spending requirements in the industry that suppress the gross margins. Hence, we look into the operating model of the company to identify any industry-specific advantages.
Operating Model
The next thing is to understand if this brings advantages in terms of ROE. To do this, we analyze the average ROE of each industry by conducting a DuPont analysis to understand how its components (Net Income Margin, Financial Leverage, Asset Turnover) affect their ROE. We also compare each industry’s ROA, ROTC, Capex % of Sales, and Debt-to-Equity ratios.
Company Data, Seeking Alpha, Khaveen Investments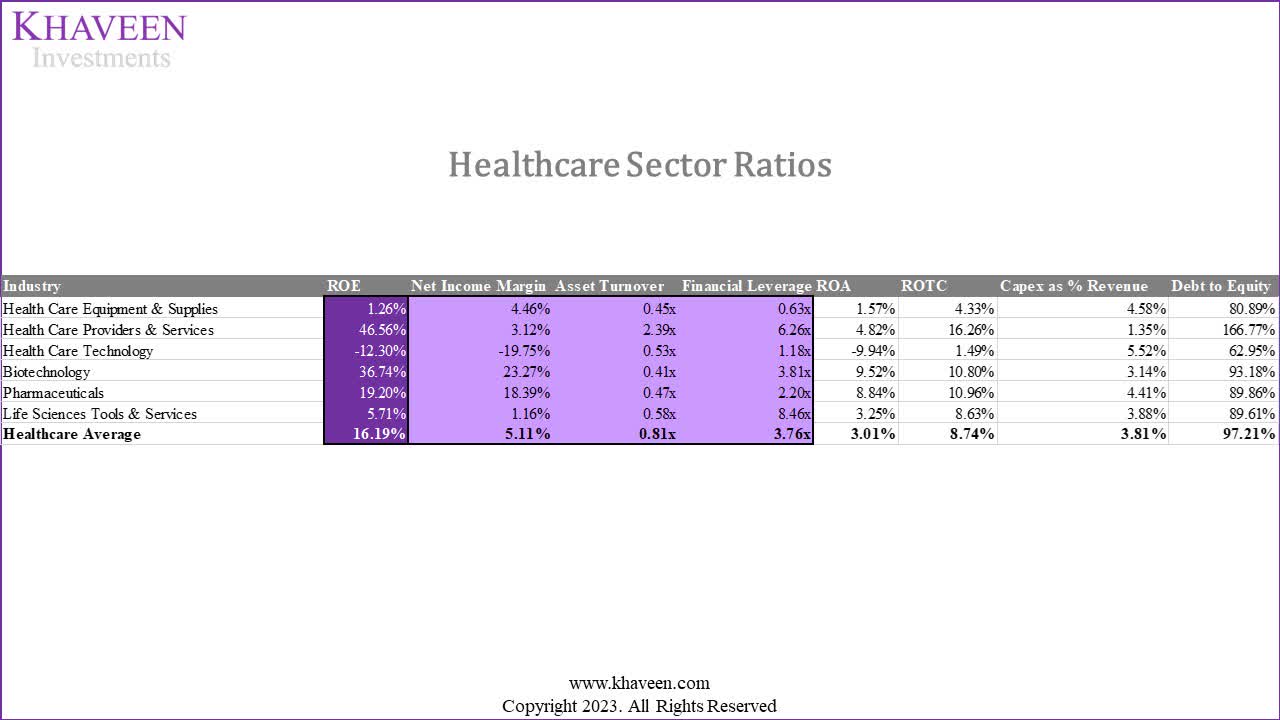
The Healthcare Providers & Services industry has the highest ROE (46.56%) higher than any of the other industries and significantly higher than the industry average (16.19%). With the second lowest net margins, this indicates it is not the reason for the high ROE. However, this industry has the highest Asset Turnover and second-highest financial leverage.
With regards to the high Asset/Turnover, Stout states that:
… insurance companies do not typically make material capital expenditures. They invest instead in human capital, marketing, and other operating expenses, which are included in their projected earnings.
Based on the table, we can see that this is true as it has the lowest average capex % of revenue (1.35%). With a lower asset base, this explains the high Asset Turnover. Its ROA though is relatively low given its low margins. With regard to the high Financial Leverage, we see that the industry does have the highest Debt-to-Equity ratio. We consider the ROTC the best measure to measure the efficiency in utilizing debt to grow the business, and with the highest ROTC, we believe the Healthcare Providers & Services industry is indeed operating efficiently.
Overall, we believe the business model of the industry is relatively advantageous to other industries, given its low capex expenditure and efficient use of leverage resulting in superior ROE compared to other industries in the Healthcare Sector
Outlook
As we identified that the industry’s business model is highly dependent on government healthcare spending, we look to identify all the growth drivers that propel higher government spending to derive our projections.
Some of the drivers are:
- Healthcare Spending Growth: The total healthcare spending in the US increased at an annual growth rate of 4.76%, rising from $2.7 tln in 2011 to $4.3 tln in 2021 according to KFF.
- Medicare Spending: According to CMS, the total spending of Medicare grew to $905.1 bln in 2022 at a CAGR of 4.5% in the past 10 years.
- Rising Number Of Insured Americans: The number of Americans with health insurance has grown at a CAGR of 1.3% in the past 10 years to 300.8 mln.
- Aging Population Supporting Demand For Aged Care: The number of people aged 65 years and above in the US grew at a CAGR of 3.3% until 2021 and is forecasted to increase by a CAGR of 3.5% through 2040 according to the Administration on Aging.
- Increasing Life Expectancy: The average US life expectancy has risen significantly over the years, going from 68 years in 1950 to 79.1 years in 2023 which is a CAGR of 0.2% and is forecasted to continue rising by a CAGR of 0.05% based on UN projections through 2032.
We forecast the total growth for the industry based on the growth drivers as stated above. Our growth rate forecast is based on the average growth rate of healthcare spending and Medicare (4.63%), growth in the number of Americans with health insurance (1.3%), older population growth (3.5%) and life expectancy growth (0.05%) at a total of 9.61%.
|
Top Managed Healthcare Companies |
Revenue Growth (3-year Average) |
Revenue Growth (5-year Average) |
|
Average |
25.91% |
24.81% |
Source: Company Data, Khaveen Investments
In comparison, the top Managed Healthcare companies grew at a much higher average growth rate in the past 3 and 5 years as seen above. We believe one of the factors for this is the industry consolidation where M&A activity has increased in the past 5 years.
|
Top 10 Healthcare Service & Providers |
Sub-industries |
Revenue (3-year Average) |
Revenue (5-year Average) |
|
UnitedHealth Group Incorporated |
Managed Healthcare |
12.04% |
10.28% |
|
CVS Health Corporation |
Healthcare Services |
8.73% |
12.58% |
|
McKesson Corporation |
Healthcare Distributors |
7.13% |
6.24% |
|
Cencora, Inc. |
Healthcare Distributors |
10.95% |
9.21% |
|
Cardinal Health, Inc. |
Healthcare Distributors |
10.26% |
8.43% |
|
The Cigna Group |
Managed Healthcare |
6.35% |
33.42% |
|
Elevance Health, Inc. |
Managed Healthcare |
13.62% |
12.84% |
|
Centene Corporation |
Managed Healthcare |
16.91% |
23.23% |
|
Humana Inc. |
Managed Healthcare |
11.85% |
12.41% |
|
HCA Healthcare, Inc. |
Healthcare Facilities |
7.28% |
6.49% |
|
Average |
10.51% |
13.51% |
Source: Company Data, Khaveen Investments
Given historical industry average revenue growths of 25.91% (3-year) and 24.81% (5-yr) are much higher than our 9.61% forecast, we do not think the past growth rates are sustainable and that these companies must depend on company-specific advantages to extract additional growth. Having said that, 9.61% growth is still quite high, and as mentioned we consider this revenue safer and more stable as it is derived from government expenditure.
Summary
Companies in the Healthcare Providers & Services Industry such as UnitedHealth have distinct revenue models in terms of their revenue being derived from mostly government sources. This enables much higher revenues reported by companies in the industry. Additionally, margins are suppressed due to minimum spending requirements on these government-sourced revenues. We believe this leads to higher revenues and lower margins, as company revenues consist of total premiums net of rebates but not medical costs.
Having said that, the industry’s asset-light operating model and efficient use of financial leverage make the overall model highly lucrative enabling the highest ROE among all industries in the sector. Hence, we believe that bigger here does not necessarily imply better. But instead, we believe the industry’s unique business model is what makes it better.
While we identified various drivers for continued government medical spending, we believe this can only contribute to 9.61% growth, requiring companies to compete on an individual level to extract additional growth. Therefore, we examine UnitedHealth’s unique competitive advantages compared to its industry competitors next.
UnitedHealth’s Competitive Advantages
We identified three key competitive factors in the industry: Value-based care, Integration, and Diversified Networks.
Value-based Care
Healthcare payment models include Fee-for-Service, where providers are paid per service, promoting high service volume but risk for insurers due to potential overutilization. Value-based care models involve shared risk, shared savings, bundled payments and capitation, prioritizing outcomes and cost-efficiency and aligning incentives for both providers and insurers.
- Shared Risk: Involves providers striving to meet set healthcare cost targets per patient, incentivizing cost reduction through efficient care practices. Providers repay insurers for cost overruns, sharing financial risk, benefiting both parties with cost control.
- Shared Savings: Similar to shared risk models, predetermined patient healthcare cost targets are set. If providers spend less than the target, the difference is considered savings or a bonus, which can be reinvested within the healthcare provider. This approach minimizes risk for insurers, as they cover only the predetermined target costs.
- Bundled Payments: Bundled payments entail a fixed payment to healthcare providers for a range of services related to specific health conditions. Insurers pay a set amount for episodes of care, such as joint replacements or chronic disease management. This reduces insurer risk by consolidating costs but raises the challenge for providers to manage care efficiently.
- Capitation: Healthcare providers are compensated with a fixed monthly fee for each patient under their care, regardless of the specific services provided. This incentivizes efficient and comprehensive patient care, as opposed to fee-for-service models where providers bill insurers for individual services at market rates.
One popular example of a capitated care plan is Medicare Advantage. The company has 50 mln members in total with 15 mln under value-based arrangements. Based on its annual report, there are 7 mln people enrolled in the company’s Medicare Advantage plan.
However, the company’s competitors also provide Medicare Advantage plans including Cigna, Humana, Blue Cross, Aetna, Centene and Kaiser Permanente.
We determined the factors to measure the success of value-based care plans include popularity, customer satisfaction, cost and value. For popularity, we based this on the percentage of Medicare Advantage enrollees as we believe this indicates how popular each company’s Medicare Advantage insurance plan offering is. We believe popularity could be a function of diversified coverage, convenience, and trust. We referred to KFF data based on CMS Medicare Advantage Enrollment which is the federal agency in charge of Medicare.
For customer satisfaction, we based this on the average Medicare star rating developed by CMS which rates Medicare Advantage and Prescription Drug plans from a scale of 1 to 5 encompassing member experience ratings, customer service, problem improvement, quality treatment and patient health monitoring factors. We referred to Nerd Wallet’s data of the average Medicare star rating of Medicare Advantage plans weighted by enrolment.
Furthermore, we derived the total monthly average cost, which includes out-of-pocket expenses and copayments for each company’s insurance plans based on data gathered from Nerd Wallet. Copayments encompass costs incurred for each visit to healthcare providers and prescription medications, comprising primary care and specialist fees, as well as prescription expenses. Notably, primary care does not involve copayments in all plans. To calculate the average specialist copayments, we assumed an average of 0.8 specialist visits (surgical and medical specialty) based on the CDC in 2022 and multiplied it by each company’s average specialist copayment. For prescription drug copayments, we multiplied each company’s average prescription cost by the average number of prescriptions per capita in 2022 (19.8).
|
Medicare Advantage Companies |
Popularity (Percentage of Medicare Advantage enrollees) |
Customer Satisfaction (Average Medicare Star Rating) |
Cost (Total Average Monthly Cost $) |
|
Kaiser Permanente |
6% |
4.81 |
375 |
|
United Healthcare |
29% |
4.28 |
363 |
|
Cigna |
2% |
4.15 |
328 |
|
Humana |
18% |
4.35 |
310 |
|
Blue Cross Blue Shield |
14% |
3.92 |
332 |
|
Aetna (‘CVS’) |
11% |
3.67 |
372 |
|
Wellcare (Centene) |
4% |
2.88 |
522 |
|
Average |
12% |
4.01 |
371.62 |
Source: Nerd Wallet, KFF, CMS, Khaveen Investments
United Healthcare is the clear choice among people in terms of popularity (29%), with its closest contender Humana with only 18% popularity. UnitedHealth has above average customer satisfaction but is only ranked third, with 1st place Kaiser much more customer-centric. According to Value Penguin, Kaiser Permanente has 76% fewer customer complaints than average with a complaint index of 0.24x based on NAIC and the most common complaint by customers for the company is handling delays while other larger companies have high claim denials. Finally, UnitedHealth’s position in terms of cost is average, being the 4th cheapest provider.
Integration
To understand the integration benefits of the various business segments, we first seek to understand them and their contribution to total revenue.
Company Data, Khaveen Investments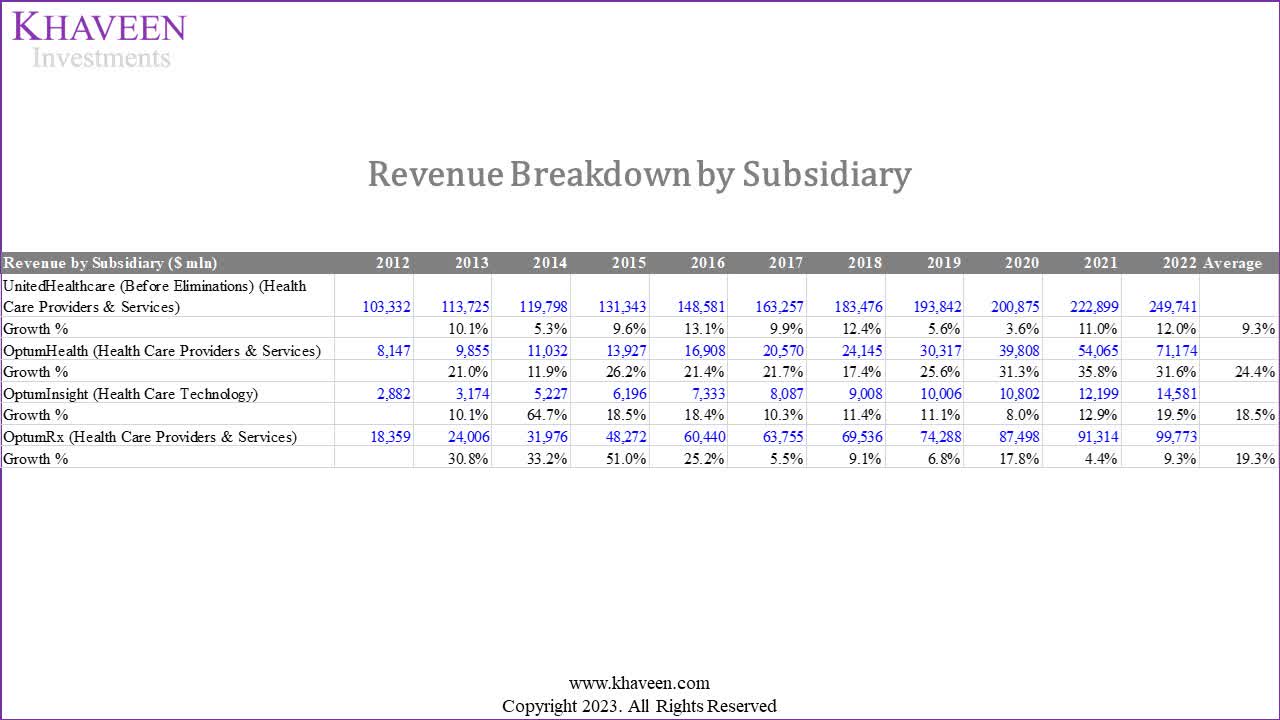
UnitedHealth Group comprises two subsidiaries which are United Healthcare and Optum. Its United Healthcare arm is related to its health insurance business. Optum operates 3 segments including Optum Health, Optum Insights and Optum RX. The overall four segments are:
- UnitedHealthcare (Managed Healthcare sub-industry): Offers various health insurance choices to individuals, employers and government programs.
- Optum Health (Healthcare Services sub-industry): Optum Health provides various care coordination and healthcare services and such as primary, specialty, urgent and surgical care to 103 mln people. The company operates a healthcare service network platform called Optum Care with 60,000 doctors in 2,000 locations.
- Optum Insight (Healthcare Technology sub-industry): This segment is a data and analytics business catering to a diverse client base including “hospitals, physicians, health plans, government bodies and life sciences companies”.
- Optum RX (Healthcare Services sub-industry): The segment operates a pharmacy benefit manager business that collaborates with health insurers to oversee prescription drug benefits. It partners with a network of retail pharmacies to provide and deliver prescriptions to insured individuals via mail or online channels.
The company’s financial statements feature intercompany eliminations, which involve shifting revenues between different segments, like from its insurance business to healthcare services. This avoids double-counting revenues since the company is essentially paying itself. For instance, money flows from UnitedHealth to Optum Health and Optum RX, with the revenue being removed from UnitedHealth’s segment. An example of this is United Healthcare policyholders paying premiums for drug prescriptions through Optum RX, where Optum RX acts as a pharmacy benefit manager. Another example is when policyholders access medical care from Optum Health. In 2019, the company introduced a health plan called Harmony which “aims to steer patients to physician practices owned by Optum”. Under the Harmony plan, policyholders are offered access to Optum doctors in addition to “a small number of outside providers, in exchange for lower premiums”. The company claimed the plan offered 20% savings compared to similar offerings under the company. We believe this integration increases the cross-selling of services UnitedHealth provides and keeps more customers within its ecosystem.
To understand the financial effects of these integration benefits, we calculate the revenue in terms of the company’s two main subsidiaries, UnitedHealthcare (insurance) and Optum (Non-insurance), by removing the eliminations from the insurance segment considering that as the non-organic contribution to the non-insurance segment.
Company Data, Khaveen Investments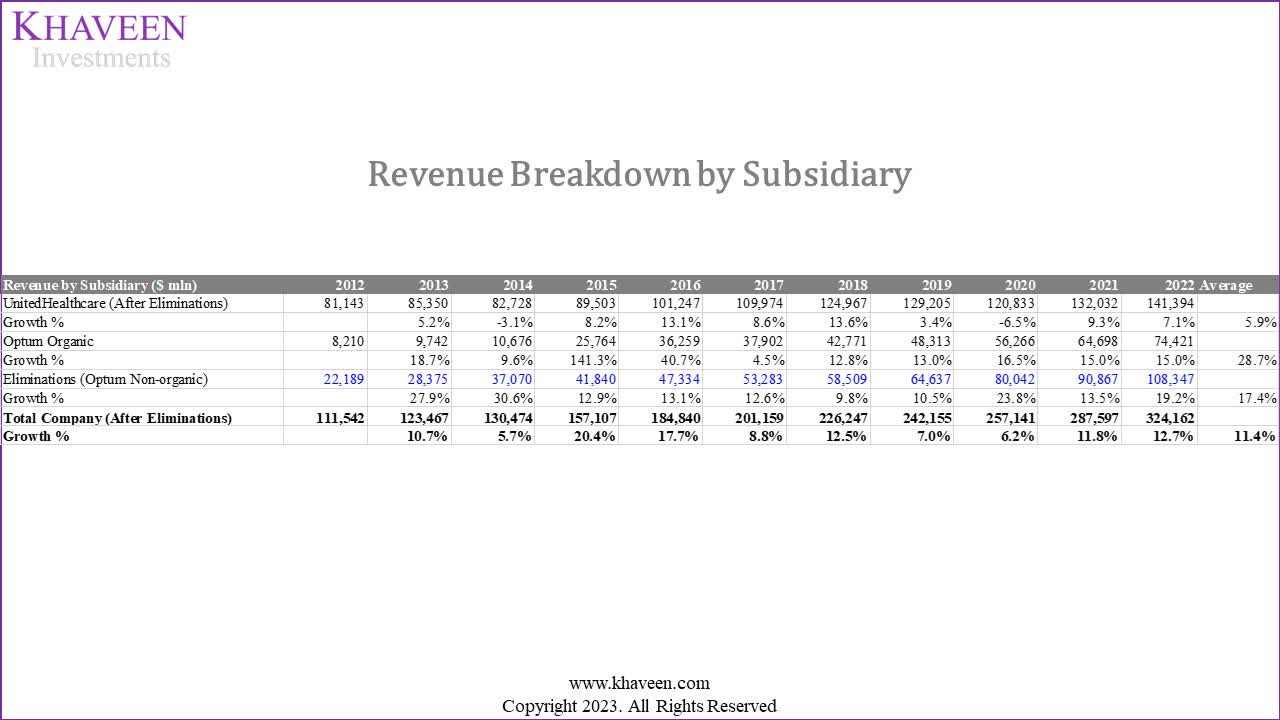
|
2022 Revenue Breakdown by Sub-industry ($ bln) |
United Healthcare |
Optum (Organic) |
Optum (Inorganic) |
|
UnitedHealth Group |
43.62% |
22.96% |
33.42% |
Source: Company Data, Khaveen InvestmentsAs seen, United Healthcare’s (Managed Healthcare) actual growth is only 5.9% on average. Optum’s (Healthcare Services) inorganic growth, which is contributions from United Healthcare grew at an average of 17.4%. Its organic growth is even more impressive with a 28.7% average growth. We believe this implies that the integration benefits have resulted in additional revenues of 33.42% which is equivalent to 0.77x of its insurance revenues.
To identify if its competitors can derive similar benefits, we look into their breakdown of UnitedHealth’s competitors.
|
Top Companies Revenue Breakdown by Sub-industry ($ bln) |
Managed Healthcare |
Healthcare Services |
Healthcare Technology |
Pharmaceuticals |
Total |
Healthcare Services / Managed Healthcare Ratio |
|
UnitedHealth Group |
57.4% |
39.3% |
3.3% |
0.0% |
100% |
0.68x |
|
CVS Health |
24.9% |
46.1% |
0.0% |
29.0% |
100% |
1.85x |
|
Cigna Group |
24.3% |
75.7% |
0.0% |
0.0% |
100% |
3.12x |
|
Elevance |
83.1% |
16.9% |
0.0% |
0.0% |
100% |
0.20x |
|
Centene Corporation |
85.6% |
14.4% |
0.0% |
0.0% |
100% |
0.17x |
|
Humana |
95.8% |
4.2% |
0.0% |
0.0% |
100% |
0.04x |
Source: Company Data, Khaveen Investments
Taking the 0.77x ratio as the most optimal for deriving integration benefits, we rank these companies based on the Healthcare Services / Managed Healthcare ratios that are the closest to 0.77x. UnitedHealth’s 0.68 ratio is the closest, which we consider the most optimal business model in this aspect.
Diversified Network
Health insurance companies maintain provider networks comprising hospitals, facilities, and healthcare providers. They negotiate with these network providers to reduce healthcare costs, potentially leading to lower premiums for their members. While policyholders can seek care outside the network, they are usually responsible for the full charges, except in emergencies. For example, UnitedHealth highlights its vast network of 1.7 mln healthcare professionals and 6,400 facilities in the US, accessible through UnitedHealthcare. Additionally, its Optum RX business boasts a network of over 67,000 retail pharmacies for pharmacy care services.
To compare the size of the company’s network, we compiled the number of states where their Medicare Advantage plans are available based on NerdWallet and the number of contracted physicians/doctors in their network.
|
Company |
Medicare Advantage Coverage (Number of States Available) |
Number of Physicians (‘mln’) |
|
Kaiser Permanente |
8 |
0.24 |
|
United Healthcare |
49 |
1.7 |
|
Cigna |
28 |
1.7 |
|
Humana |
49 |
0.56 |
|
Blue Cross Blue Shield (Elevance) |
47 |
1.7 |
|
Aetna (‘CVS’) |
46 |
1.2 |
|
Wellcare (Centene) |
36 |
0.238 |
Source: Company Data, Khaveen Investments
UnitedHealth is joint 1st with Humana in terms of states covered, and joint 1st with Cigna and Blue Cross Blue Shield in terms of the number of physicians.
Competitive Factor Scores
Based on the 3 competitive factors that we highlighted above, we derived a competitive factor score for the companies by ranking them based on each competitive factor.
Value-based Care Score
|
Ranking |
Popularity (Percentage of Medicare Advantage Enrollees) |
Customer Satisfaction (Average Medicare Star Rating) |
Cost (Total Average Monthly Cost $) |
Average |
Value Care Factor Score* |
|
Kaiser Permanente |
5 |
1 |
6 |
4.00 |
1.00 |
|
United Healthcare |
1 |
3 |
4 |
2.67 |
1.22 |
|
Cigna |
7 |
4 |
2 |
4.33 |
0.94 |
|
Humana |
2 |
2 |
1 |
1.67 |
1.39 |
|
Blue Cross Blue Shield (Elevance) |
3 |
5 |
3 |
3.67 |
1.06 |
|
Aetna (CVS) |
4 |
6 |
5 |
5.00 |
0.83 |
|
Wellcare (Centene) |
6 |
7 |
7 |
6.67 |
0.56 |
*Factor Score = [(7- Average Ranking)/6) +0.5
Source: Company Data, Khaveen Investments
For the Value-based Care factor, we ranked the companies based on Popularity, Customer Satisfaction and Cost. From the table, the company with the top average ranking is Humana at 1.67 with it ranking first in terms of Cost and second in both Popularity and Customer Satisfaction, giving it a factor score of 1.2x. This is followed by UnitedHealth with the second-best average of 2.67 with a factor score of 1.22x.
Integration Score
|
Ranking |
Actual Healthcare Services / Managed Healthcare Revenue Ratio |
Difference Between Optimum and Actual Ratio |
Ranking |
Integration Factor Score |
|
UnitedHealth Group |
0.68x |
0.09x |
1 |
1.5 |
|
CVS Health |
1.85x |
1.08x |
4 |
0.7 |
|
Cigna Group |
3.12x |
2.35x |
5 |
0.5 |
|
Elevance |
0.20x |
0.57x |
2 |
1.3 |
|
Centene Corporation |
0.17x |
0.60x |
3 |
1.1 |
*Factor Score = [(6- Average Ranking)/5) +0.5
Source: Company Data, Khaveen Investment
For the Integration factor, we ranked each company based on the difference between our derived optimum ratio of Healthcare Services to Managed Healthcare revenue to their actual ratio of Healthcare Services to Managed Healthcare revenues of their 2022 breakdown. From the table, we find that UnitedHealth has the lowest difference at only 0.09x whereas Cigna has the highest ratio of 2.35x. Therefore, we obtained an integration factor score of 1.5x for the company.
Diversified Network Score
|
Ranking |
Medicare Advantage Coverage (Number of States Available) |
Number of Physicians (‘mln’) |
Average |
Diversified Network Factor Score |
|
Kaiser Permanente |
7 |
6 |
6.5 |
0.58 |
|
United Healthcare |
1 |
1 |
1 |
1.50 |
|
Cigna |
6 |
1 |
3.5 |
1.08 |
|
Humana |
1 |
5 |
3 |
1.17 |
|
Blue Cross Blue Shield (Elevance) |
3 |
1 |
2 |
1.33 |
|
Aetna (CVS) |
4 |
4 |
4 |
1.00 |
|
Wellcare (Centene) |
5 |
7 |
6 |
0.67 |
*Factor Score = [(7- Average Ranking)/6) +0.5
Source: Company Data, Khaveen Investments
For the Diversified Network factor, we ranked each company based on their Medicare Advantage Coverage and Number of Physicians and obtained an average ranking for each company. We ranked UnitedHealth as the top in both criteria as it jointly with Humana has the greatest number of states available and is also jointly ranked with Cigna and Elegance with the greatest number of physicians in their network. Thus, we obtained an average ranking of 1 for UnitedHealth and a factor score of 1.5x.
Solid Profitability and Revenue Growth Outlook
Looking at market shares in terms of insurance companies, we computed the share based on direct premiums of health insurance companies in the market.
NAIC, Khaveen Investments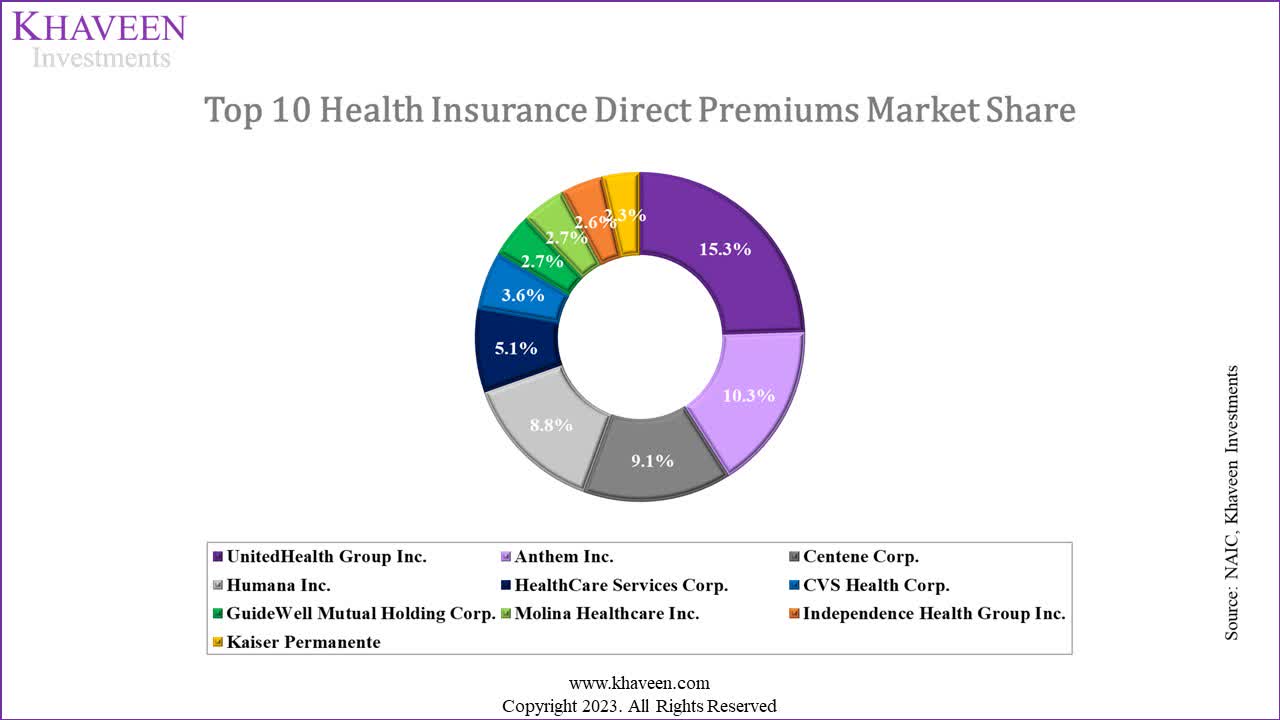
UnitedHealth is the clear market leader here, with the market fairly segmented with the top 10 companies here representing 62.5% of the market share.
Company Data, Khaveen Investments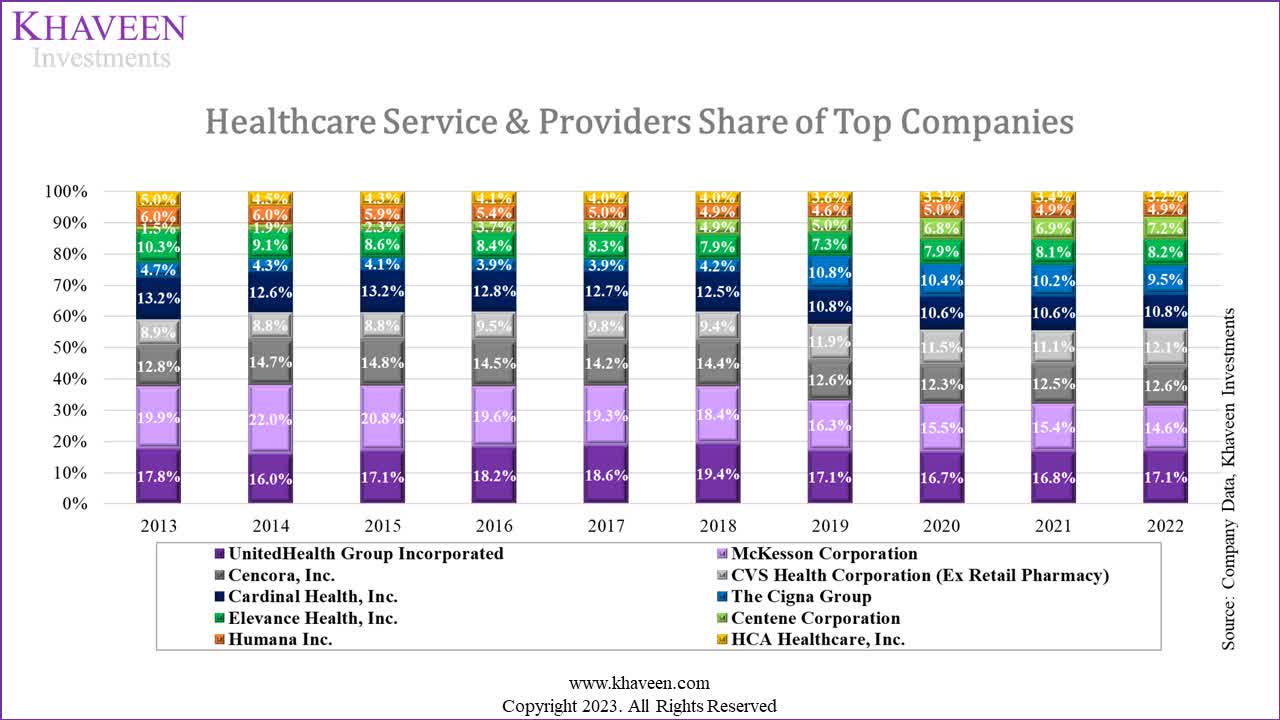
When looking at market share in terms of the entire Industry, UnitedHealth is still the market leader, though its competitors are closer to its position. Interestingly, UnitedHealth’s market share has remained relatively the same over the past decade, taking first place from McKesson in 2017, which has seen its share decline by around 5% since 2013.
|
Top 10 Healthcare Providers & Services |
Subindustries |
9-year Average Growth % |
|
UnitedHealth Group Incorporated |
Managed Healthcare |
11.5% |
|
CVS Health Corporation |
Healthcare Services |
11.2% |
|
McKesson Corporation |
Healthcare Distributors |
8.4% |
|
Cencora, Inc. |
Healthcare Distributors |
12.1% |
|
Cardinal Health, Inc. |
Healthcare Distributors |
9.5% |
|
The Cigna Group |
Managed Healthcare |
30.6% |
|
Elevance Health, Inc. |
Managed Healthcare |
9.3% |
|
Centene Corporation |
Managed Healthcare |
34.2% |
|
Humana Inc. |
Managed Healthcare |
9.6% |
|
HCA Healthcare, Inc. |
Healthcare Facilities |
6.6% |
|
Average |
11.5% |
Source: Company Data, Khaveen Investments
Company Data, Khaveen Investments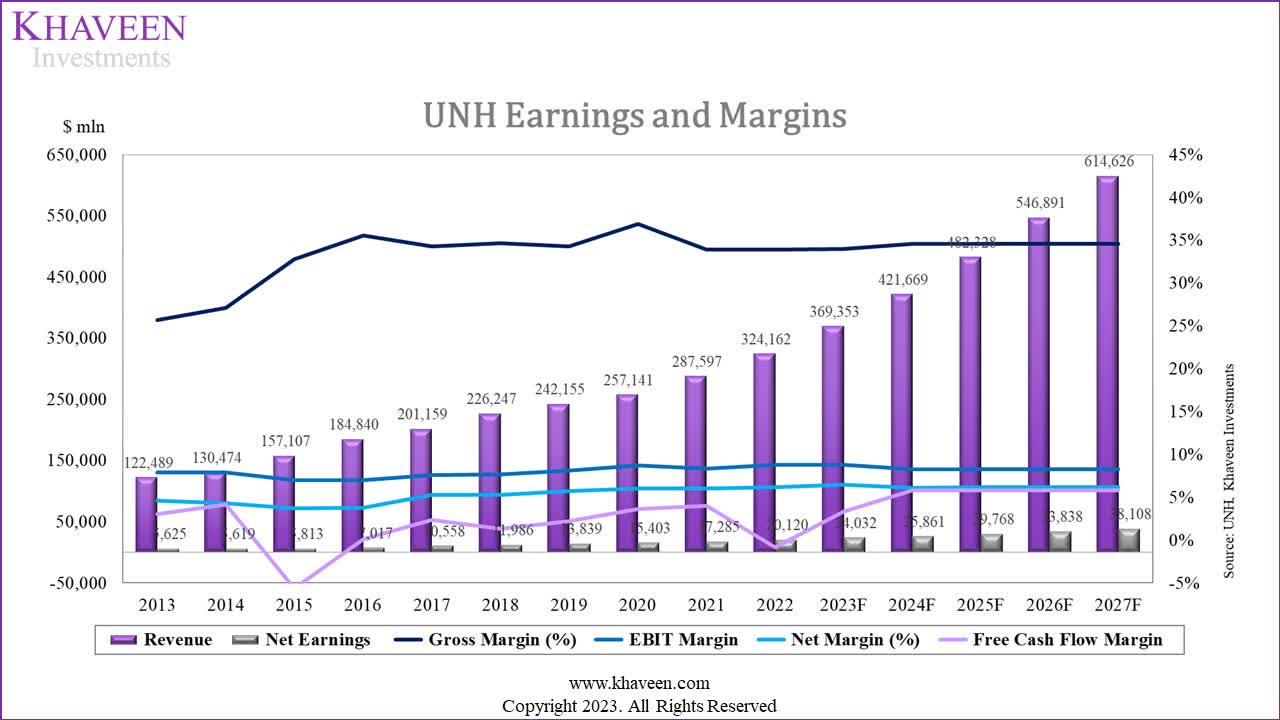
While its gross margins have only been stable over the past 5 years, its net and EBIT margins have been stable over the past 10 years. Its FCF margins have also been stable with dips in 2015 and 2022 due to acquisitions. In 2015, the company acquired Catamaran Corporation for $12.8 bln and acquired Change Healthcare in 2022 for $13 bln. Additionally, it recently acquired LHC Group ($5.4 bln) and EMIS ($1.52 bln) in 2023.
Company Data, Khaveen Investments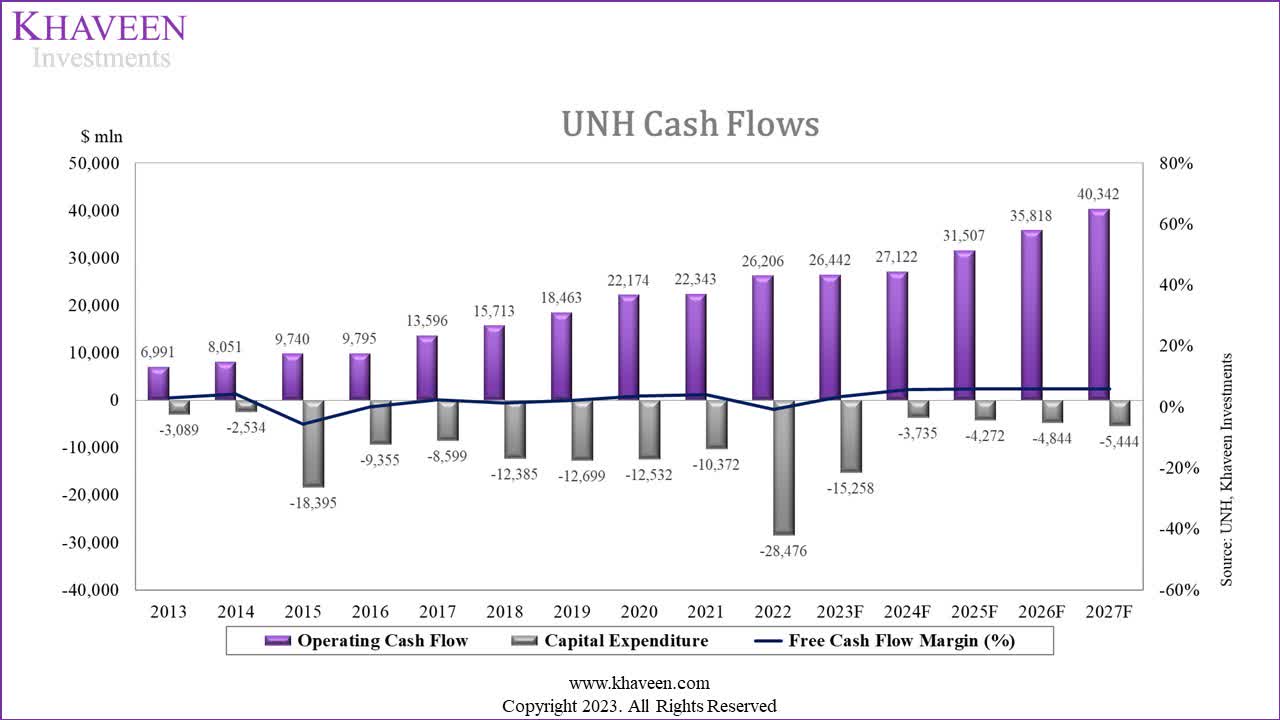
We believe the stable FCF margins are extremely attractive given the relatively safe and stable revenue contributions from government medical expenditure. Given the stable revenue model and margins, we used UnitedHealth’s 7-year average margins for our projections.
Given the stability, we derived our 5-year forward revenue projections based on each business segment. From our second point, we applied our derived competitive factor score to weight the revenue growth forecast for the company’s segments, including:
- United Healthcare (Managed Care): We applied the managed care market forecast CAGR of 6.8% and factored this with our Value-based Care factor score for the company.
- Optum Organic: We compiled the average historical growth rates for the Healthcare Services of the top Managed Healthcare companies’ revenue within the top 10 Healthcare Providers & Services industry from 2017 and factored this with our derived Diversification Network factor score.
- Optum (Non-Organic): We based our forecast on the company’s historical average growth of the Optum non-organic revenues multiplied with a ratio of 0.77x and factored this with our derived Integration factor score.
|
Revenue Breakdown |
CAGR |
Factor Score |
Total Growth % |
|
United Healthcare (Managed Care) |
6.80% |
1.22 |
8.3% |
|
Optum Organic |
13.2% |
1.50 |
19.9% |
|
Optum Inorganic |
11.5% |
1.50 |
17.2% |
Source: Company Data, Khaveen Investments
Overall, we summarized our revenue projections for the 3 segments in the table above. As seen, we forecasted its Optum Organic segment to have the highest growth of 20% followed by Optum Inorganic growth of 17.2% whereas its United Healthcare segment with the lowest growth forecast of 8.3%.
|
Revenue Projections ($ mln) |
2022 |
2023F |
2024F |
2025F |
|
UnitedHealthcare (After Eliminations) |
141,394 |
153,145 |
165,873 |
179,659 |
|
Growth % |
8.3% |
8.3% |
8.3% |
|
|
Optum Organic |
74,421 |
89,205 |
106,926 |
128,167 |
|
Growth % |
19.9% |
19.9% |
19.9% |
|
|
Eliminations (Optum Non-organic) |
108,347 |
127,002 |
148,869 |
174,502 |
|
Growth % |
17.2% |
17.2% |
17.2% |
|
|
Total Company (After Eliminations) |
324,162 |
369,353 |
421,669 |
482,328 |
|
Growth % |
13.9% |
14.2% |
14.4% |
Source: Company Data, Khaveen Investments
We applied our revenue growth forecast for each segment to the table above of our revenue projections over the next 3 years. In total, we forecasted the company’s 3-year average forward revenue growth of 14.2%. Our 2023 full-year revenue growth projection is in line with analysts’ consensus of 13.75%. Furthermore, our projections are also in line with the management’s expectations to “outpace overall market growth” and also the company’s “long-term 13% to 16% growth objective” as highlighted in its latest earnings briefing.
Risk: New Legislation on Medicare Advantage
One of its key competitors, Humana has filed a lawsuit against the US Department of Health and Human Services concerning a new legislation approved this year that would allow the US government to recover “overpayments” to health insurers for Medicare Advantage plans. According to Humana, the new rule would create “unpredictable consequences for Medicare Advantage organizations and the millions of seniors who rely on the Medicare Advantage program for their healthcare”. The US government stated that it could recover “as much as $4.7 billion over 10 years”. We believe this new rule could impact UnitedHealth as it is the largest health insurer for the Medicare Advantage program with a share of 29%. Furthermore, the Medicare segment accounted for 45.5% of its revenue in 2022, making it the largest source of revenue for the company.
Valuation
Khaveen Investments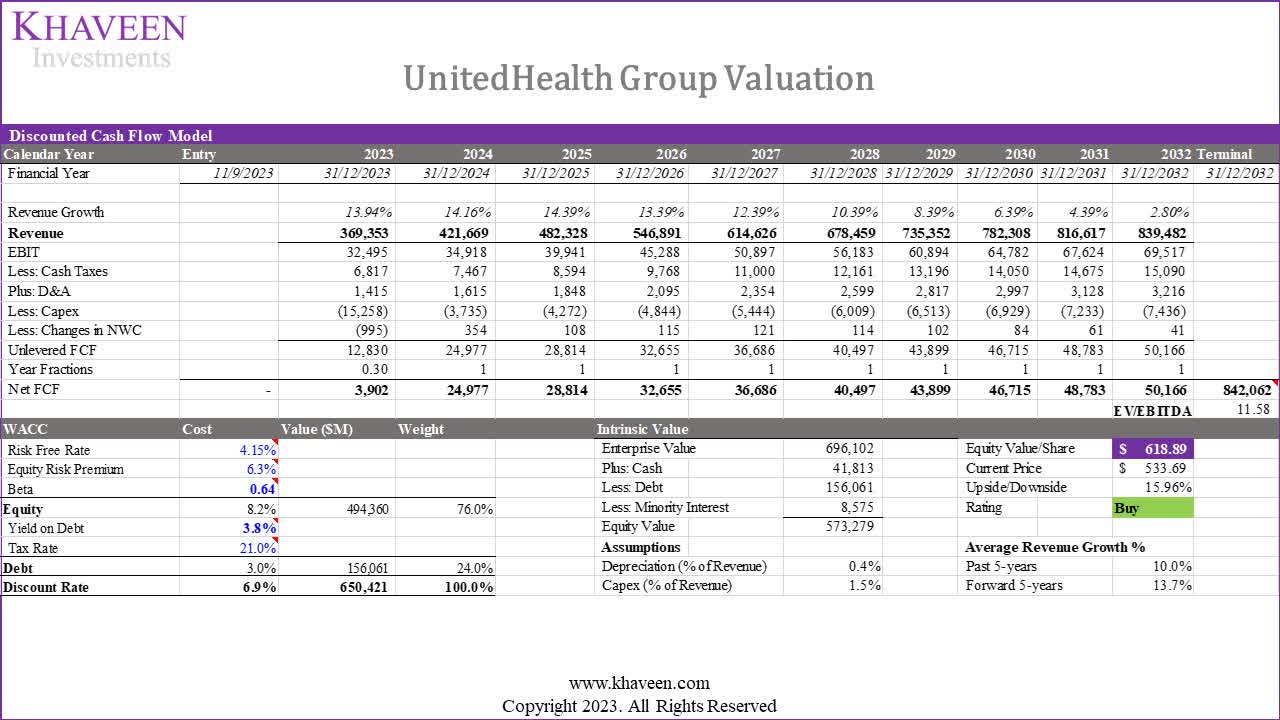
Based on a discount rate of 6.9% (company’s WACC) and terminal value based on the average EV/EBITDA of the top Managed Healthcare companies of 11.58x, we obtained an upside of 15.96%.
Verdict
In conclusion, we determined that UnitedHealth’s size is primarily a reflection of the industry it operates rather than its unique business model. We believe the Healthcare Providers & Services Industry exhibits certain advantages over other sectors, with high revenue driven by a revenue model that recognizes premiums as revenue, while low margins are a result of industry-specific medical cost spending requirements that impact gross margins. Furthermore, we determined its gross margins are weighed down due to these mandatory expenditures.
To assess the industry’s competitive advantages, we delve into the operating model, highlighting the sector’s low capital expenditure and efficient leverage utilization, resulting in superior Returns on Equity compared to other healthcare sectors. We also identify key competitive factors in the industry, including Value-based care, Integration, and Diversified Networks, with United Healthcare’s popularity and customer satisfaction ranking solidly. Furthermore, we believe UnitedHealth’s integration efforts, particularly through Optum, have contributed significantly to its growth. Lastly, we determined UnitedHealth’s diversified network strength, covering a large number of states and employing a large number of physicians. Moreover, we believe these factors support its competitive positioning as the market leader and the company’s profitability demonstrates stability. Overall, we rate the company as a Buy with a price target of $618.89.
Analyst’s Disclosure: I/we have a beneficial long position in the shares of UNH either through stock ownership, options, or other derivatives. I wrote this article myself, and it expresses my own opinions. I am not receiving compensation for it (other than from Seeking Alpha). I have no business relationship with any company whose stock is mentioned in this article.
No information in this publication is intended as investment, tax, accounting, or legal advice, or as an offer/solicitation to sell or buy. Material provided in this publication is for educational purposes only, and was prepared from sources and data believed to be reliable, but we do not guarantee its accuracy or completeness.
Seeking Alpha’s Disclosure: Past performance is no guarantee of future results. No recommendation or advice is being given as to whether any investment is suitable for a particular investor. Any views or opinions expressed above may not reflect those of Seeking Alpha as a whole. Seeking Alpha is not a licensed securities dealer, broker or US investment adviser or investment bank. Our analysts are third party authors that include both professional investors and individual investors who may not be licensed or certified by any institute or regulatory body.