Summary:
- Texas Instruments has outpaced the S&P 500 with a 20% return since April, showcasing its strong capital allocation and robust dividend growth.
- Despite lagging peers post-pandemic due to AI trade and high CapEx, TXN’s strategic investments in automation and electrification are set to pay off.
- Looking ahead, TXN aims for substantial revenue growth with new facilities like RFAB2 and LFAB1, positioning itself for long-term market leadership and profitability.

tampatra/iStock via Getty Images
Introduction
To use the words of famous rapper Eminem: “Guess who’s back, back again?“
Texas Instruments (NASDAQ:TXN) is who’s back.
Since my most recent article on April 10, titled “Dividend Investors Take Note: Unlocking Texas-Sized Returns With Texas Instruments,” the stock has returned 20%, beating the 9% return of the S&P 500 by a substantial margin.
Over the past ten years, the Texas-based company has returned 436%. While that is a phenomenal number, it underperformed the iShares Semiconductor ETF’s (SOXX) 902% return by a huge margin.
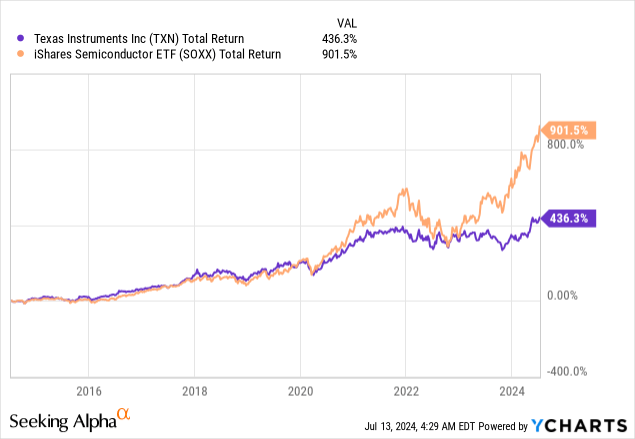
As we can see above, after the pandemic, Texas Instruments failed to keep up with its peers, which was due to two major reasons:
- Especially last year, semiconductors turned into an AI trade. Texas Instruments is not a typical AI trade.
- The company has started massive capital investments, which pressured free cash flow.
The good news is that investors have found new confidence. Texas Instruments is soaring, supported by a broadening in market strength and the realization that its investments are about to pay off handsomely.
In this article, I’ll update my thesis, discuss the latest developments, and explain why I remain bullish on what may be one of the best capital allocators in the industry.
So, let’s get to it!
A Superior Capital Allocator
If there’s one thing Texas Instruments is known for, it’s its ability to allocate capital, something that is much harder to do than it sounds.
Between 2014 and 2023, the company spent $94 billion, roughly 50% of its current market cap.
Most of this went to R&D, sales, CapEx, and inventory. In other words, measures to grow the business.
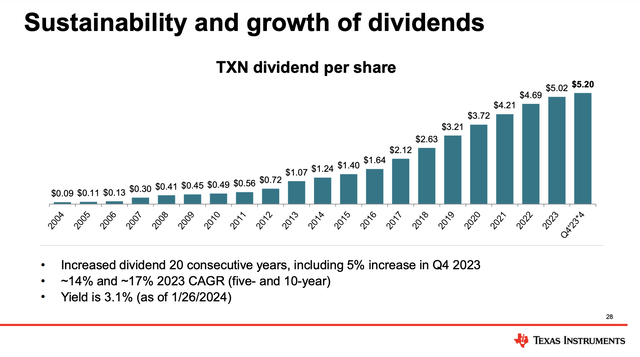
It also spent close to $50 billion on dividends and buybacks, which helped the company to increase its dividend growth streak to 20 consecutive years with a ten-year CAGR of 17%.
Texas Instruments
Currently, TXN yields 2.6%, which comes with an 80% payout ratio.
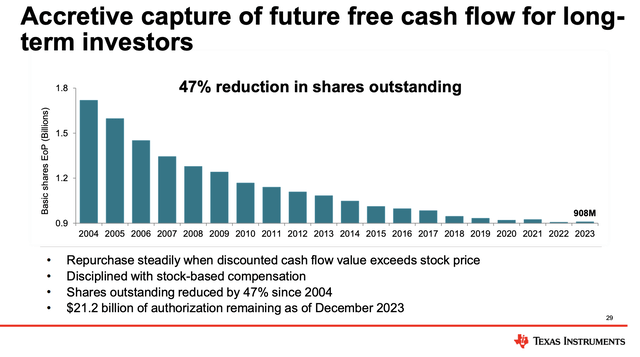
On top of that, the company has bought back almost half of its shares between 2004 and 2023. Going into this year, it had an outstanding authorization of more than $20 billion, 11% of its market cap.
Texas Instruments
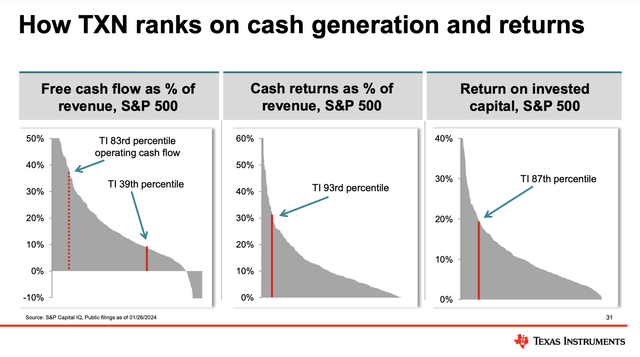
Moreover, using the data below, the company is among the most efficient S&P 500 members when it comes to returning cash and generating a return on its invested capital, which are key metrics – especially in capital-intensive industries.
Texas Instruments
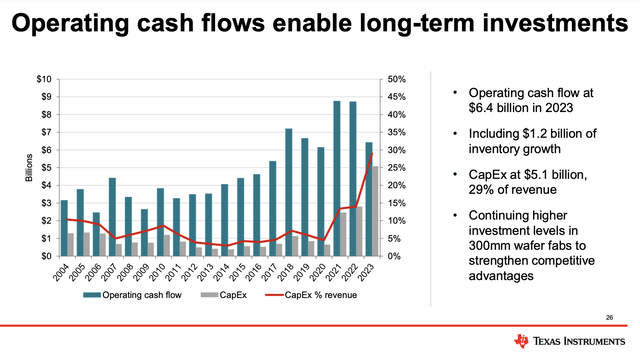
That said, as the chart above shows, the company does not score high when it comes to free cash flow generation. That’s due to a free cash flow implosion.
Usually, TXN spends close to 5-10% of its annual revenue on CapEx. In recent years, that number has been pushed to 30%. When adding some post-pandemic weakness in operating cash flow, we get tremendous pressure on free cash flow.
Texas Instruments
Over the past 20 years, the company’s per-share free cash flow followed an exponential curve. This ended when it accelerated free cash flow.
The good news is that CapEx wasn’t wasted but spent on mega projects that are about to pay off handsomely.
Growth Investments Are About To Pay Off
During last month’s Bank of America Global Technology Conference, the company highlighted the purpose and success of its aggressive investments.
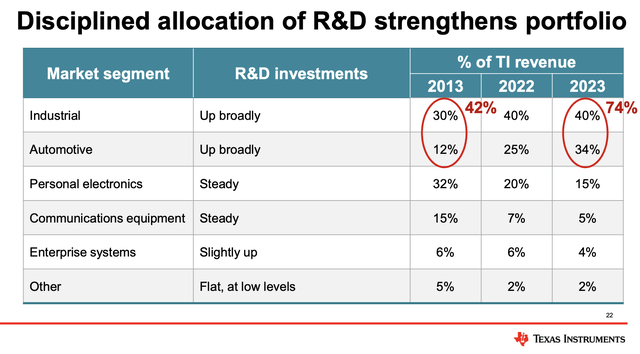
Essentially, it’s all about automation, electrification, and safety, as the company generates roughly 75% of its revenue from automotive and industrial markets.
Texas Instruments
For example, the company’s content in EVs, which already reaches up to $1,000 per vehicle in some cases, is set to grow as the adoption of electric vehicles accelerates. Even if the EV revolution hasn’t panned out as some may have expected, it’s still an attractive growth market. It also helps that non-EV cars are increasingly complex.
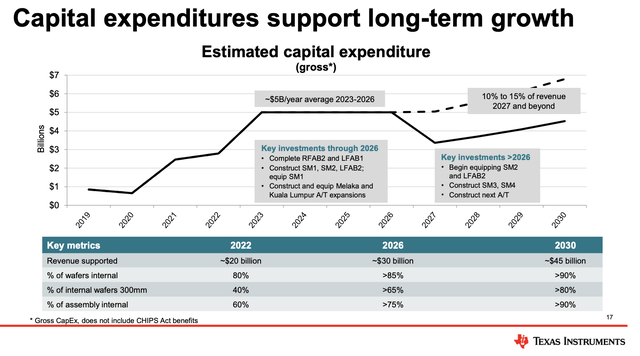
To position itself for growth, it is expanding its capacities through the aforementioned acceleration in growth investments.
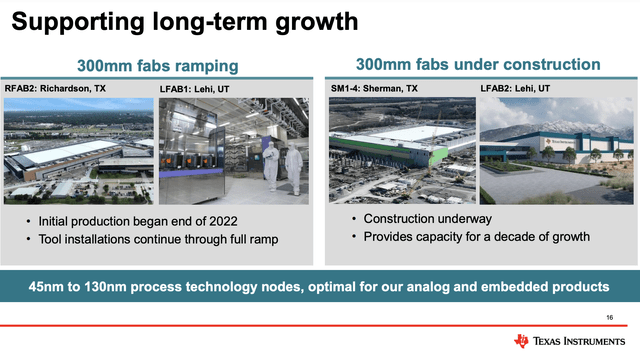
The company is investing roughly $5 billion annually in 2024 and 2025 to enhance its manufacturing capabilities. Key projects include RFAB2, and LFAB1, two massive facilities in Texas and Utah.
Texas Instruments
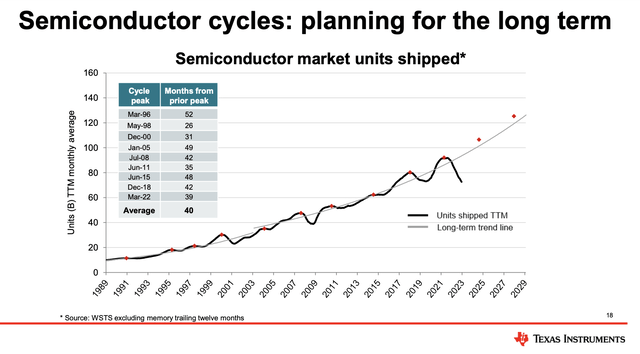
As one can imagine, these investments are designed to make sure the company can meet future demand and avoid missed opportunities during upcycles.
As we can see below, we are currently not in an upcycle for the semiconductors TXN produces. However, once demand follows its exponential curve again, the company wants to be prepared.
Texas Instruments
In order to be prepared, the company needs to be able to improve total production capacity and product quality.
For example, RFAB2 is expected to be a cornerstone for the next growth cycle, providing significant cost efficiencies as products move from older, less efficient factories to more advanced facilities.
Texas Instruments
These investments also provide lower costs.
By moving loadings from external suppliers like TSMC and UMC to its own facilities, TXN has managed to lower its variable wafer costs from roughly $2,500 to $200.
Additionally, the 25% Investment Tax Credit (“ITC”) that applies to RFAB2 and LFAB1 until 2026 further supports the financial attractiveness of the company’s investments and puts an emphasis on investing as much as possible before the credits expire.
Now, you’re probably wondering when Texas Instruments will reap the benefits from these investments.
From 2014 to 2018, the company achieved a 21% peak-to-peak revenue growth, which further accelerated to 27% from 2018 to 2022.
Applying similar growth trajectories, the company expects potential revenue between $24 billion and $26 billion by 2026.
For now, analysts don’t agree with that, as they see $20 billion in 2026 revenues. That is likely due to the fact that most analysts do not incorporate specific scenarios but mainly straight-line the current business environment.
With that said, during the Bernstein Strategic Decisions Conference, the company noted its revenue growth potential is stunning, as the RFAB2 project alone is expected to support up to $6 billion in revenue once it’s fully equipped and operational.
Each of the Sherman fabs is expected to generate $9 billion in sales at full capacity.
So, what does this mean for its valuation?
Valuation
Texas Instruments isn’t just expecting fast growth, but it is also highly profitable, turning roughly half of its revenue into EBITDA. Even better, analysts expect that to continue, with EBITDA margins between 50% and 52% through 2026.
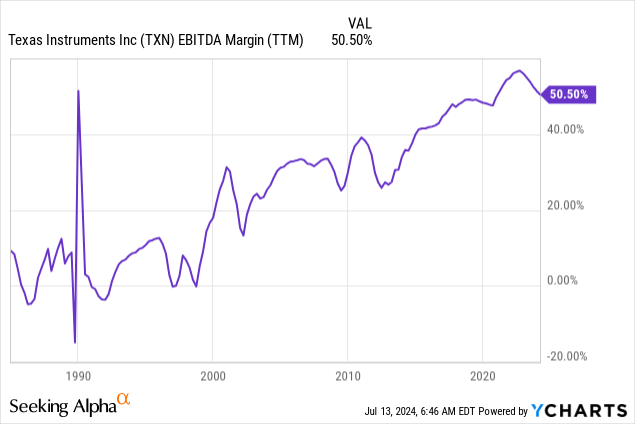
Using the company’s 2026 guidance of $26 billion in potential revenue, it could generate $13 billion in EBITDA. This would be 17% above its record 2022 result and 24% higher than official analyst estimates for 2026. In other words, we’re incorporating a demand upswing based on the aforementioned growth trajectory.
Additionally, the company is expected to end up with $5.4 billion in 2026 net debt. That would be just 0.4x EBITDA. This balance sheet comes with an A+ credit rating.
Using the company’s $184 billion market cap, $5.4 billion in expected net debt, and $13 billion in projected EBITDA gives us an enterprise value of $189.4 billion and a 14.6x EBITDA multiple.
Using Seeking Alpha data, the company has a five-year average EBITDA multiple of 18.0x.
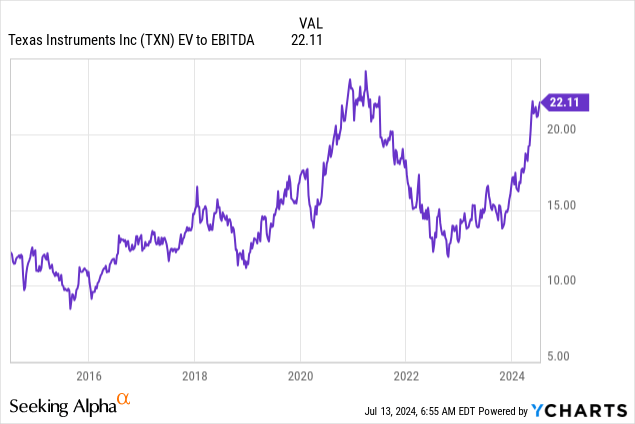
I believe an 18x multiple is more than fair, which gives the stock a fair stock price of $250, roughly 24% above the current price.
However, this price target is only valid if the company is right about demand developments. If demand remains sluggish, we’re likely dealing with a fair price target close to the current price.
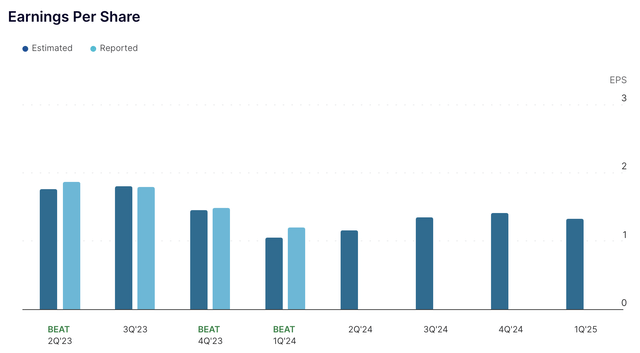
That said, on July 23, the company will release its earnings. Analysts are looking for $1.16 in EPS, which would be down 39% compared to 2Q23. The company has beaten expectations three times in the past four releases.
Nasdaq
While I do not really care if it slightly beats or misses, I am looking forward to hearing about its long-term growth plans and if it is still confident in a potential demand upswing in the years ahead.
That said, given secular growth opportunities and aggressive investments in growth, I stick to a Buy rating, expecting TXN to go back to what it does best in the years ahead: beating the market while growing dividends and spending a lot on buybacks after 2026.
Takeaway
Texas Instruments is back in the spotlight with a 20% return since April, outperforming the S&P 500 by a wide margin.
Despite trailing its semiconductor peers since the pandemic, the company’s strategic investments in growth and profitability are poised to pay off handsomely.
Furthermore, with a 20-year streak of dividend growth and robust buybacks, TXN is a master at capital allocation.
As it ramps up its manufacturing capabilities with mega projects like RFAB2 and LFAB1, Texas Instruments is preparing for a future demand surge.
With the potential for substantial revenue growth and an attractive valuation, I remain bullish on TXN’s long-term prospects.
Pros & Cons
- Strong Capital Allocation: Texas Instruments is a proven master at allocating capital, with significant investments in R&D, CapEx, and shareholder returns through dividends and buybacks.
- Strong Dividend Growth: With a 20-year growth streak and a 17% CAGR in dividends, TXN is a great dividend growth stock.
- Future Growth Potential: Massive investments in manufacturing capabilities position the company for substantial future revenue growth.
- Attractive Valuation: At current prices, TXN is trading at a fair multiple, with significant upside potential if growth targets are met.
Cons
- Recent Underperformance: TXN has lagged behind its semiconductor peers post-pandemic, mainly due to its lack of exposure to the AI boom.
- High CapEx Pressure: The company’s aggressive capital expenditure has pressured free cash flow, limiting short-term dividend growth.
- Market Uncertainty: Future revenue growth relies on the realization of the company’s bullish growth projections, which are currently more optimistic than analyst expectations.
Analyst’s Disclosure: I/we have no stock, option or similar derivative position in any of the companies mentioned, and no plans to initiate any such positions within the next 72 hours. I wrote this article myself, and it expresses my own opinions. I am not receiving compensation for it (other than from Seeking Alpha). I have no business relationship with any company whose stock is mentioned in this article.
Seeking Alpha’s Disclosure: Past performance is no guarantee of future results. No recommendation or advice is being given as to whether any investment is suitable for a particular investor. Any views or opinions expressed above may not reflect those of Seeking Alpha as a whole. Seeking Alpha is not a licensed securities dealer, broker or US investment adviser or investment bank. Our analysts are third party authors that include both professional investors and individual investors who may not be licensed or certified by any institute or regulatory body.
Test Drive iREIT© on Alpha For FREE (for 2 Weeks)
Join iREIT on Alpha today to get the most in-depth research that includes REITs, mREITs, Preferreds, BDCs, MLPs, ETFs, and other income alternatives. 438 testimonials and most are 5 stars. Nothing to lose with our FREE 2-week trial.
And this offer includes a 2-Week FREE TRIAL plus Brad Thomas’ FREE book.

