Summary:
- Traditional wisdom considers utility stocks safe haven investments for good reason.
- They offer a combination of growth and quasi-bond features (such as generous yields and relative predictable earnings).
- However, now is a bad time to apply such wisdom, especially when applied blindly.
- The combination of rate changes, valuation expansion and growth potential has made XLU one of the most overvalued sectors on our dashboard.
- In contrast, leading stocks in the sector like NEE offer a better-rounded package of growth and valuation – at least relative to the sector average represented by XLU.

Galeanu Mihai
NEE and XLU: Previous thesis and new development
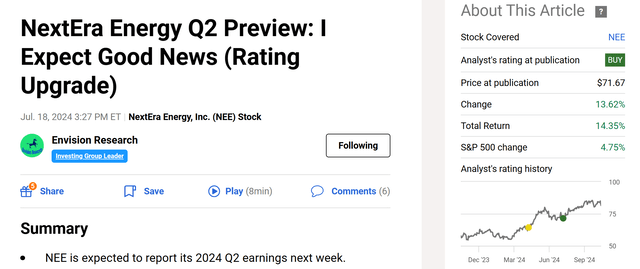
The last time I wrote on utility stocks was more than four months ago. In particular, I argued for a bullish thesis on one of the leading stocks in the sector, NextEra Energy (NYSE:NEE), back in July 2024. As you can see from the chart below, that article was titled “NextEra Energy Q2 Preview: I Expect Good News (Rating Upgrade).” In that article, I upgraded the stock to a “Buy” rating based on the following considerations:
NEE is expected to report its 2024 Q2 earnings next week. I expect it to either reaffirm the full-year guidance or even up it from the range announced in Q1. My optimism stems from the new developments in the past quarter. The top ones are Florida’s strong economy, NEE’s expansion projects, and the new interest rate outlook.
Seeking Alpha
My last coverage on the sector as a whole, as represented by the Utilities Select Sector SPDR Fund ETF (NYSEARCA:XLU), dates further back to more than one year ago, back in September 2023. In that article, I argued for a Hold thesis on XLU based on the sector premium relative to risk-free rates.
Since these writings, there have been substantial developments surrounding both NEE and the sector at large. Thus, I thought it would be helpful to write this follow-up article and reexamine my earlier thesis. In the remainder of this article, I will focus on the top two developments in my mind: The change in the interest rate outlook and NEE’s business developments in the past quarter. The takeaways are:
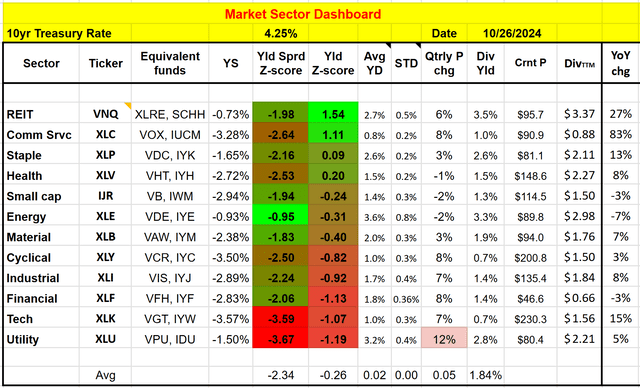
- The changes in interest rates, combined with XLU’s earnings and price performance since my last writing, have made the sector the most expensively valued sector according to our following dashboard (which is coded as a Google sheet and downloadable via this link: Market Sector Dashboard). I will elaborate on these results later. As such, the remainder of this article will explain why I downgraded my rating on XLU to Sell from my earlier Hold rating.
- For NEE, I’m seeing a more mixed picture. The business has some positive catalysts afoot and compares favorably against the sector as a whole in terms of profitability, growth potential, and dividend yield. However, its valuation is also at a sizable premium and leaves little margin of safety. Thus, my conclusion is to also downgrade it to a Hold from my earlier Buy rating for the considerations to be detailed immediately below.
Author
XLU and NEE: Basis information
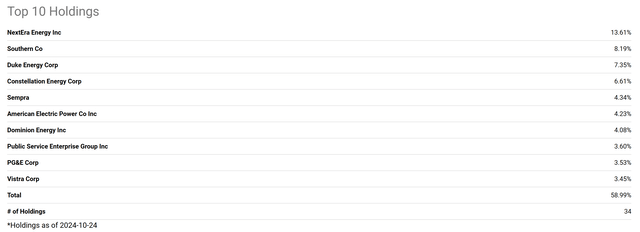
Before diving in, let’s take a quick at the basic information regarding NEE and XLU in case they’re new to some readers. The XLU ETF is a popular choice for investors seeking exposure to the U.S. utility sector. It’s heavily concentrated in its top holdings. The top 10 holdings alone account for a substantial 58.99% of the fund’s total portfolio, as seen in the next chart below.
Leading the pack is exactly NEE, one of the two main characters of this article. NEE holds a significant 13.61% weight in the XLU portfolio. Following closely are Southern Co. at 8.19%, Duke Energy at 7.35%, and Constellation Energy at 6.67%. These traditional utility companies, known for their regulated businesses and dividend payouts, contribute significantly to XLU’s overall performance.
Seeking Alpha
Overall, as of Oct. 24, 2024, the fund holds a portfolio of 31 holdings, offering investors a broad-based approach to this sector. The fund’s estimated EPS growth is about 8.61% in the next 3~5 years according to the fund’s webpage. In terms of valuation, the price-to-book ratio is 2.42 as seen. The price-to-earnings ratio (on an FY1 basis) is 20.33. Later in the article, I will better contextualize these growth rate projections and valuation ratios.
As for NextEra Energy, it’s a holding company for Florida Power & Light Co. (FP&L), which provides electricity to roughly 5.9 million customers in Eastern, Southern and Northwestern Florida. Notably, one of the company’s subsidiaries, NextEra Energy Resources, is a nonregulated power generator with exposure to nuclear, gas, and renewable energy sources.

XLU fund description
NEE vs. XLU: Why I like NEE better
The next chart shows a detailed comparison of NEE and XLU. This analysis compares the valuation, profitability, growth, and consistency metrics of these two options. All the parameters used here were gleaned from various sources (mainly Yahoo Finance, Seeking Alpha, and XLU’s fund description as of Oct. 24, 2024). My overall conclusion is that NEE appears to be a bit more expensive than XLU based on valuation metrics such as P/E and price/book ratios (and I will explain why I put an emphasis on appears in a later section), but it’s just a much better-rounded package, in my view.
To wit, NEE currently trades at a higher P/E ratio of 23.8 compared to XLU’s 20.3 as seen, translating into a premium of about 17%. In terms of the price/book ratio, NEE’s price-to-book value ratio of 2.82 is also higher than XLU’s 2.42 by about 17%. Both NEE and XLU also feature about the same level of profitability judging by their ROE (return on equity). As seen, the ROE for NEE is 11.8% vs. XLU’s 11.9%.
However, NEE features much better growth and consistency than XLU. As a dividend champion, NEE has a longer history of consecutive dividend growth (28 years) compared to XLU (13 years). In addition, NEE also has demonstrated much better growth than XLU in the past. For example, NEE has a higher five-year dividend growth rate of 10.6% (vs. only 3.4% for XLU).

Author
NEE vs. XLU: Growth outlook
Looking ahead, my view is that A) NEE to keep enjoying a better growth curve than XLU, and B) the market’s expected growth rate for XLU (about 8.6% if you recall from an earlier chart) is too optimistic.
NEE differentiates itself from the average utility sector through several strategies. The top two on my list are its geographical exposure and its focus on renewable energies. The geographical perspective (such as Florida’s strong economy and population growth) has been detailed in my last article and I won’t further elaborate here. NEE has been a pioneer in developing and operating large-scale renewable energy projects, particularly in solar and wind power. This focus has allowed NEE to capitalize on the growing demand for clean energy and position itself well for secular growth.
For the average sector represented by XLU, the growth projection of 8.6% is too optimistic in my view. XLU’s dividend payout ratio is about 56% (inferred from the fund’s current yield of 2.75% and also its P/E ratio of 20.3x as aforementioned). Thus the reinvestment rate for the sector is at best around 44%. With a ROE of ~12% and an RR of 44%, my projection for the long-term growth rate is about 5% only (12% ROE x 44% RR), which is more consistent with the fund’s past data. If you recall from the dashboard, XLU’s latest dividend increases translate into a YOY growth rate of 5% (on a TTM basis).
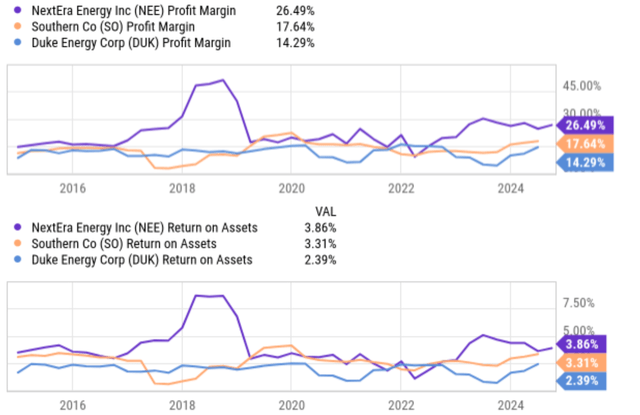
At this point, you must be wondering why/how NEE can grow faster. After all, NEE features about the same ROE, payout ratio, and also RR as XLU. The key in my view is NEE’s exposure to non-regulated businesses and renewables as mentioned above. Such exposure creates the potential for higher margins and higher return on capital (as you can see from the chart below comparing NEE’s margin and ROA to other leading peers in the sector). As a result, every $1 retained and reinvested could lead to more growth.
Seeking Alpha
XLU and NEE: valuation revisited and dividend yield
I mentioned earlier that NEE appears to be more expensively valued than XLU. Let me explain why emphasized the word “appears”. If you recall from an earlier chart, NEE is about 17% more expensive than XLU when measured either by the P/E or the P/B ratio. However, I think both ratios are misleading because A) they do not take into consideration the quality of the earnings (such as the margin differences mentioned above), and B) they’re also subject to the various accounting caveats embedded in the determination of the EPS.
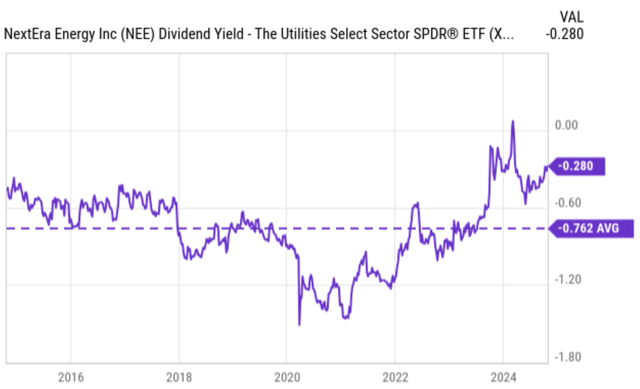
For stocks or funds that pay regular dividends such as NEE and XLU, I consider dividend payouts as a much more accurate and reliable measure of their underlying economic earnings. Consequently, I consider their dividend yield a more reliable measure of their valuation. Based on these considerations, the current yield spread (“YS”) between NEE and XLU, as shown in the next chart, serves as a clear signal for NEE’s attractive valuation. The concept of YS has been provided in our earlier article. Here I will only quote the gist:
- Dividends provide a backdoor to quickly estimate the owners’ earnings. Dividends are the most reliable financial information and the least open to interpretation. In investing, we always prefer a simpler method that relies on fewer and unambiguous data points rather than a more complicated method that depends on more ambiguous data points.
- The dividend yield spread (“YS”) is based on a timeless intuition. No matter how times change, for two securities that pay regular dividends, the yield spread between them always measures their risk premium relative to each other. A large spread provides a higher margin of safety and vice versa.
To wit, the chart displays the historical YS between NEE and XLU in the past decade. As seen, NEE’s dividend yield has been on average lower than XLU, as reflected by an average YS of -0.76% in the past decade. In contrast to this long-term average, NEE’s current yield is only 0.28% below that of XLU. As such, the current YS between NEE and XLU is far above the historical mean (actually toward the thickest end of the historical spectrum as seen), indicating a considerable valuation discount.
Seeking Alpha
Other risks and final thoughts
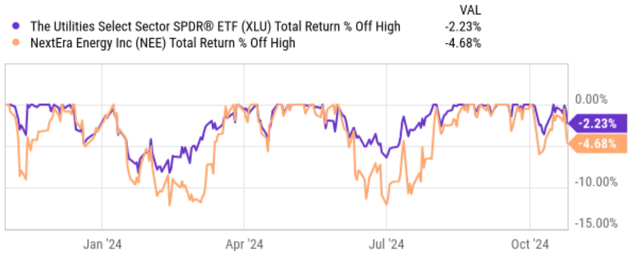
In terms of downside risks, the chart below shows that NEE has exhibited far higher price volatility than XLU. The orange line represents NEE’s price changes off-peak in the past year. As seen, the changes are much more pronounced compared to the smoother trajectory of XLU’s change (shown by the purple line). As of Oct. 24, 2024, both XLU and NEE have experienced declines from their respective 52-week highs. XLU is down 2.23%, while NEE has fallen by 4.68%. This indicates that NEE has experienced a slightly larger drawdown compared to XLU during this period. In the past 52 weeks alone, NEE has suffered off-high corrections as large as ~12% multiple times as seen. In contrast, XLU’s worst corrections were only about 7%.
Seeking Alpha
As mentioned upfront, a common risk facing both NEE and XLU is interest uncertainty. Utility stocks respond sensitively to interest rate changes due to their quasi-bond nature and their heavy reliance on debt financing. Since my last coverage on NEE and/or XLU, the outlook for interest rates has changed drastically, creating considerable uncertainties for their future performance.
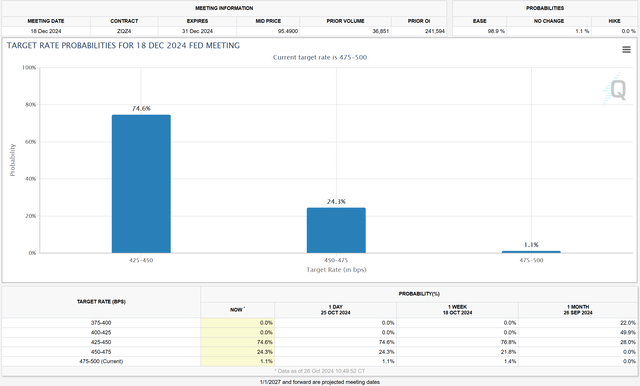
To wit, the CME Group FedWatch Tool shows the current market expectation for future interest rates. As you can see, the most likely rate scenario (with a probability of 74.6%) implied by the market’s current expectation is for the Fed rates to be in the range of 4.25% to 4.5% by the end of 2024. In contrast, even a month ago, the most likely scenario expected by the market (with a probability of 49.9%) points to lower rates in the range of 4% to 4.25% by the end of 2024. Such a change in rate outlook could pressure the valuation multiple of both NEE and XLU.
All told, utilities are considered a safe haven by traditional wisdom for good reasons. However, my thesis is that now is not a good time to apply such traditional wisdom – at least not blindly. The combination of changes in risk-free rates, XLU’s valuation multiple, and growth potential has made XLU one of the most overvalued sectors in my view, leading to my downgrade of its rating to Sell from my earlier Hold rating. In contrast, leading stocks like NEE in the sector present a more reasonable combination of value and growth, resulting in my Hold rating (compared to my earlier Buy rating).
CME group
Analyst’s Disclosure: I/we have no stock, option or similar derivative position in any of the companies mentioned, and no plans to initiate any such positions within the next 72 hours. I wrote this article myself, and it expresses my own opinions. I am not receiving compensation for it (other than from Seeking Alpha). I have no business relationship with any company whose stock is mentioned in this article.
Seeking Alpha’s Disclosure: Past performance is no guarantee of future results. No recommendation or advice is being given as to whether any investment is suitable for a particular investor. Any views or opinions expressed above may not reflect those of Seeking Alpha as a whole. Seeking Alpha is not a licensed securities dealer, broker or US investment adviser or investment bank. Our analysts are third party authors that include both professional investors and individual investors who may not be licensed or certified by any institute or regulatory body.
As you can tell, our core style is to provide actionable and unambiguous ideas from our independent research. If your share this investment style, check out Envision Early Retirement. It provides at least 1x in-depth articles per week on such ideas.
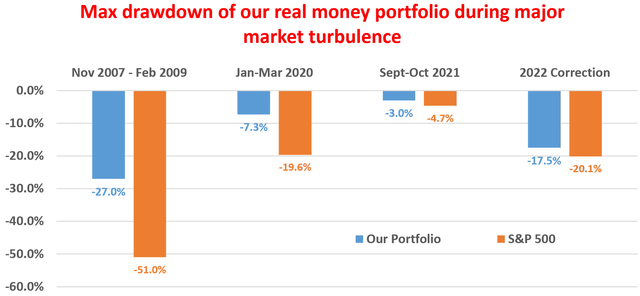
We have helped our members not only to beat S&P 500 but also avoid heavy drawdowns despite the extreme volatilities in BOTH the equity AND bond market.
Join for a 100% Risk-Free trial and see if our proven method can help you too.
