Summary:
- Vale S.A. is reporting earnings with consensus estimates of $0.92 in normalized EPS and $0.98 in GAAP EPS.
- Analysts expect revenue to come in at $13.07 billion.
- Vale’s Q4 iron ore production exceeded estimates, leading to an increase in analyst estimates.
Bloomberg/Bloomberg via Getty Images
Vale S.A. (NYSE:VALE) is reporting earnings on 2/22/2024 before the market opens. Consensus estimates are for $0.92 in normalized EPS and $0.98 in GAAP EPS. Analysts expect revenue to come in at $13.07 billion. This article will discuss analyst expectations, my EPS model, and context in terms of historical share price moves around earnings.
Vale reported its Q4 iron ore production (ahead of earnings) at the end of last month. Volume was up 10.6% from the year-earlier quarter, significantly above earlier estimates. This caused analysts to up estimates. This sort of pre-guidance before earnings tends to dampen the volatility around earnings events, as there’s not a lot of time for surprises to come up. Estimates can go up or down quite a bit because this is a commodity company and a price-taker. Weather events, transportation problems, and suddenly changing demand from China can significantly impact the top and bottom line. Over the last 90 days, there have been 12 EPS revisions upwards and 0 downwards.
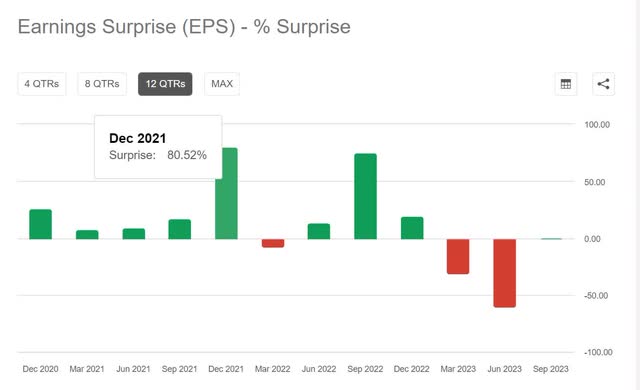
Unlike most companies, Vale isn’t exceeding analyst estimates as often as some companies tend to do. Possibly, this is because of the commodity nature of the company; analysts can predict quite well how many dollars the company is receiving. It is tough for the company to surprise with additional sales, and surprises are more likely to be negative.
earnings surprises Vale (Seekingalpha.com)
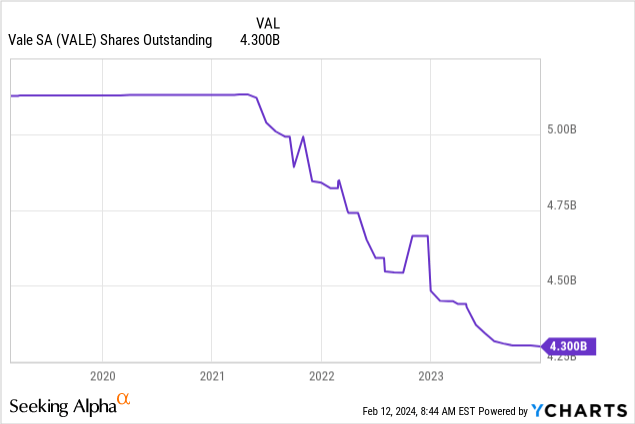
Vale tends to be quite aggressive with buybacks and dividends as of late.

That’s while paying spectacular dividends (as per Seeking Alpha):
|
Year |
Amount |
Adj. Amount |
Dividend Type |
Frequency |
Ex-Div Date |
Record Date |
Pay Date |
Declare Date |
|---|---|---|---|---|---|---|---|---|
| 2023 | ||||||||
| 0.4738 | 0.4738 | Special | Other | 11/22/2023 | 11/24/2023 | 12/8/2023 | 10/27/2023 | |
| 0.3888 | 0.3888 | Regular | Semiannual | 8/14/2023 | 8/15/2023 | 9/11/2023 | 7/28/2023 | |
| 0.3470 | 0.3470 | Regular | Semiannual | 3/14/2023 | 3/15/2023 | 3/29/2023 | 2/16/2023 | |
| 2022 | ||||||||
| 0.0554 | 0.0554 | Regular | Semiannual | 12/13/2022 | 12/14/2022 | 3/29/2023 | 12/2/2022 | |
| 0.6866 | 0.6866 | Regular | Semiannual | 8/12/2022 | 8/15/2022 | 9/9/2022 | 7/29/2022 | |
| 0.7249 | 0.7249 | Regular | Semiannual | 3/9/2022 | 3/10/2022 | 3/23/2022 | 3/8/2022 | |
| 2021 | ||||||||
| 1.5065 | 1.5065 | Regular | Semiannual | 9/23/2021 | 9/24/2021 | 10/8/2021 | 9/30/2021 | |
| 0.4376 | 0.4376 | Regular | Other | 6/24/2021 | 6/25/2021 | 7/8/2021 | 6/18/2021 | |
| 0.7588 | 0.7588 | Special | Other | 3/5/2021 | 3/8/2021 | 3/22/2021 | 2/26/2021 | |
| 2020 | ||||||||
| 0.4268 | 0.4268 | Special | Other | 9/22/2020 | ||||
The dividend average over the past 4 years comes out to a 9.16% yield. That’s very nice, given it accompanies sizeable buyback programs.
The lowest analyst EPS estimate is $0.86, and the highest estimate is $0.97 in EPS.
I’m experimenting and trying to improve on consensus estimates based on a weighted average of models. This includes time series models, analyst estimates, and other things. In practice, I’m fudging with it a lot because it appears that lots of stocks likely benefit from customization. This is in the experimental phase, and I’m still improving my forecasting, so take the estimate below with a grain of salt. I’m making these forecasts because I think they should ultimately be helpful.
| FQ4 2023 | EPS estimate per share $ | Revenue estimate ($ billions) |
| Wall Street Analysts | $0.96 | $13.07 |
| Bram de Haas | $0.89 | $12.7 |
I come out quite a bit below the current consensus numbers but within the bands of high/low analyst estimates.
The important thing is where the stock will go on the earnings number.
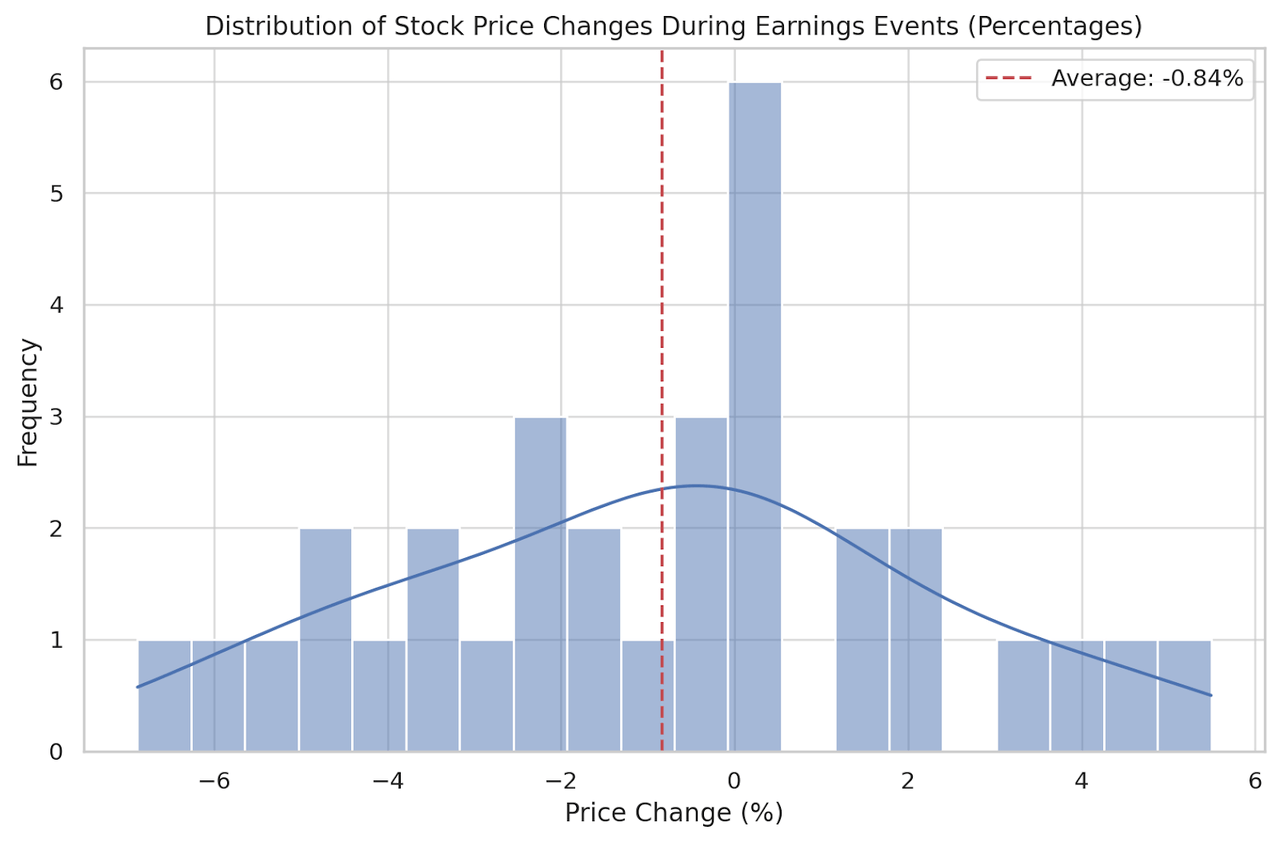
I’ve looked back at 30 earnings events, and on average, the stock declines 0.12%, but it can go either way. Here is a graph showing the distribution of share price changes from the close the day before earnings to the open on the day after earnings:
price changes over earnings (Author)
Whether earnings come in above estimates or below estimates doesn’t really seem to matter. This is likely a function of the last decade, having been fairly bad for Vale. The company experienced horrible tragedies involving its tailing dams, and earnings were likely one of the moments where the company communicated about these events. It is also possible that in mining, forward guidance about capital allocation and/or operational color about budget overruns, etc., counts for a lot more than whether prices of iron ore were high or low over the past three months (and that’s not going to be news anyway).
Generally, companies’ outperforming or underperforming analyst expectations aren’t immediate massive drivers of share prices. Outperformance is the norm. However, there tends to be some effect. I still expect over-earnings, where Vale outperforms expectations, to have a slight positive expectation.
Even though historically, not even the magnitude of the earnings surprise seems to have a consistent relationship with the magnitude of any share price response.
Option chains can also be informative about upcoming earnings; sometimes, there are potential opportunities to profit or protect from a volatile event.
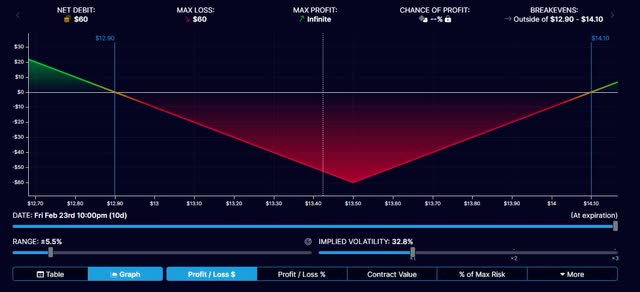
So far, with these earnings analyses, I’ve leaned towards selling straddles or strangles. There generally appears to be more value in that approach. In this case, I’m leaning toward buying a straddle. The February 23 straddle (including earnings), and costs around 60 cents. It breaks even if the stock goes below $12.90 or above $14.10 by expiration. Beyond these points, the position becomes increasingly profitable.
straddle payoff structure VALE (optionstrat.com)
This translates to the stock being around 3.4% down or 4% up. The implied volatility is elevated. Historical realized volatility (past 20 days) is around 23%, and the implied volatility is around 36%. However, Vale is sensitive to news from China, and earnings are coming up. The share price may be muted, but implied volatility likely increases as earnings approach.
I’d consider reversing this position much closer to earnings, with similar prices on the straddle. With 11 days to go and an earnings event included, the straddle looks a little too cheap. If I owned Vale S.A. stock and were interested in short-term repositioning, I would consider lightening up my position in the short term. I think the company could miss estimates even though, historically, earnings results haven’t predicted share price responses. Items discussed on the earnings call about future cash flows and investments should be much more impactful in terms of the direction of the stock price.
Analyst’s Disclosure: I/we have no stock, option or similar derivative position in any of the companies mentioned, and no plans to initiate any such positions within the next 72 hours. I wrote this article myself, and it expresses my own opinions. I am not receiving compensation for it (other than from Seeking Alpha). I have no business relationship with any company whose stock is mentioned in this article.
Seeking Alpha’s Disclosure: Past performance is no guarantee of future results. No recommendation or advice is being given as to whether any investment is suitable for a particular investor. Any views or opinions expressed above may not reflect those of Seeking Alpha as a whole. Seeking Alpha is not a licensed securities dealer, broker or US investment adviser or investment bank. Our analysts are third party authors that include both professional investors and individual investors who may not be licensed or certified by any institute or regulatory body.
Sign up here for a 14-day free trial of my weekly premium trade & investment ideas. Discover the best things I can find in this market. Unique and hard-to-find ideas, selected based on the presence of edge, outstanding risk/reward and being uncorrelated or being less correlated to the S&P 500.
