
Summary:
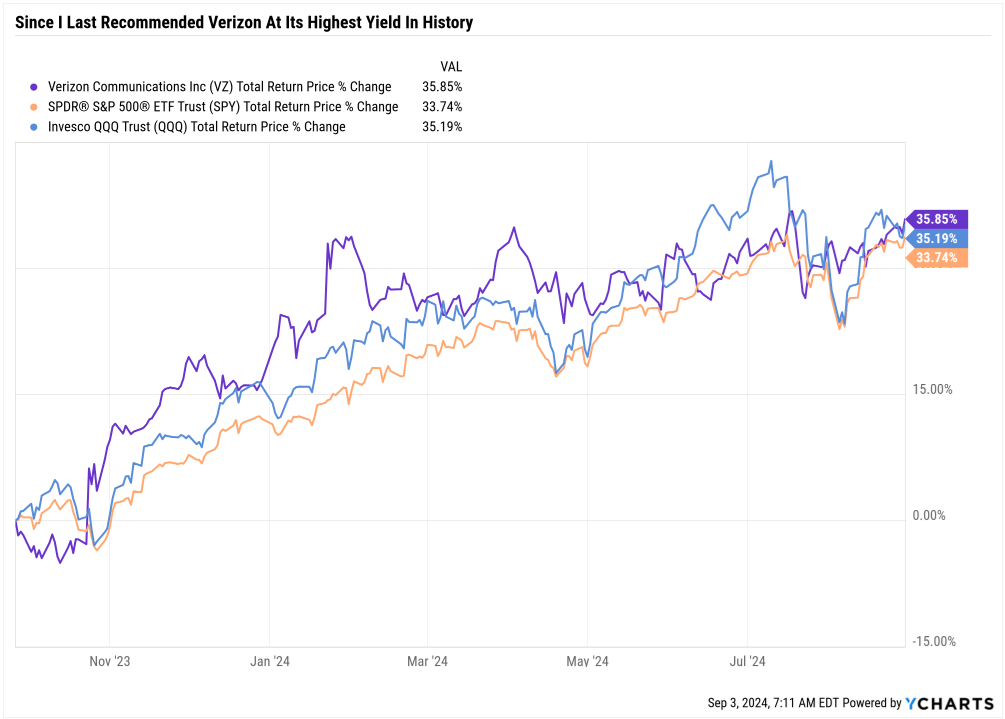
- Since my “Best Time in History to Buy Verizon” article last September, VZ has been up 35%, outperforming the S&P and Nasdaq.
- Verizon’s 6.4% yield is very low risk, supported by a low payout ratio, strong balance sheet, and $49 billion in expected retained free cash flow through 2029.
- Verizon remains attractively valued, but it’s 18% undervalued. It offers a 29% upside in the next year and 51% in the next 2.5 years, which would be 3.5 years.
- Verizon has some significant negatives to be aware of, specifically its 1.1% growth consensus and 7.5% long-term return potential.
- Verizon is usually a low volatility stock (falling 50% as much in most down years for stocks) but it has specific idiosyncratic risks that you need to be comfortable with before making it part of your diversified dividend portfolio.

Deagreez
Many readers have recently asked me for an update about Verizon (NYSE:VZ).
I just completed the annual review for Verizon and wanted to report my findings.
So, let’s examine the three things income investors will love and the two reasons to avoid Verizon.
Reason One To Love Verizon: A Very Low Risk 6.4% Yield
YieldChart
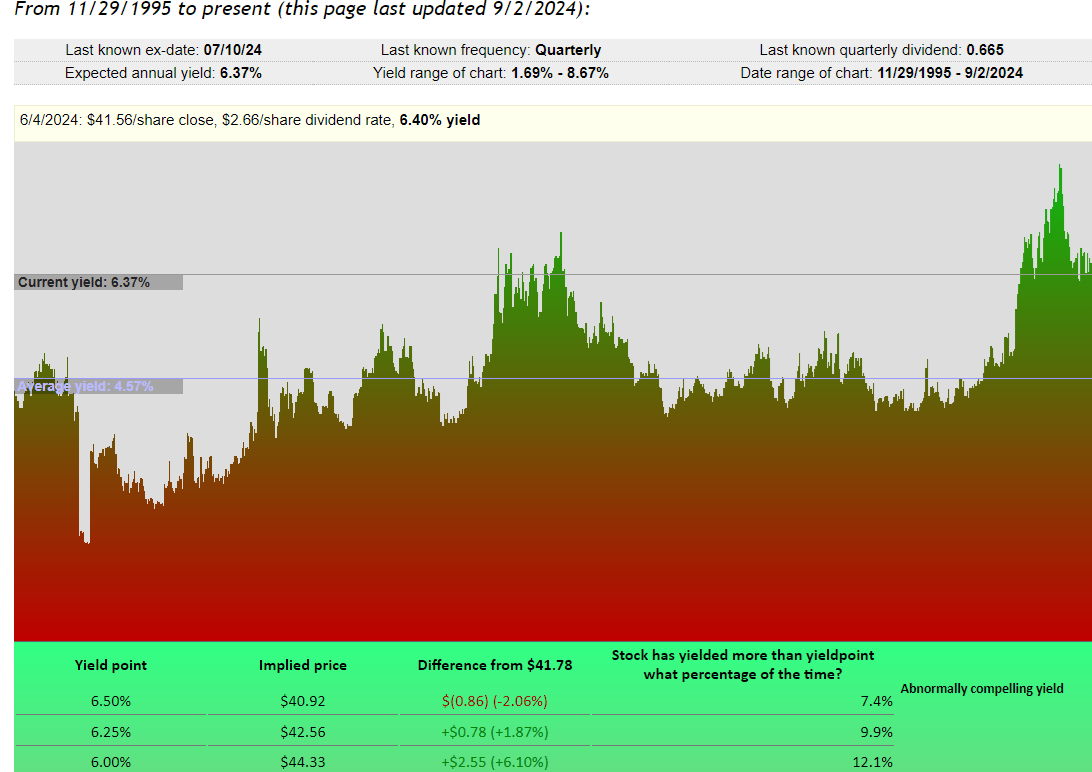
For the last three decades, Verizon averaged a 4.6% yield, and in its very slow growth era, the five-year average yield has been closer to 5%.
How often has Verizon offered a 6.4% yield in the last three decades? About 8% of the time.
I last wrote about Verizon in September 2023 when it traded at the highest yield in its history.
YCharts
Buffett-Like Returns From A Blue-Chip Bargain Hiding In Plain Sight
FAST Graphs, FactSet
Not surprisingly, buying a blue chip at its best valuation ever usually results in great short-term results as long as the fundamentals remain stable. That’s the case with Verizon, which has matched the Nasdaq and beat the S&P since I recommended it last year.
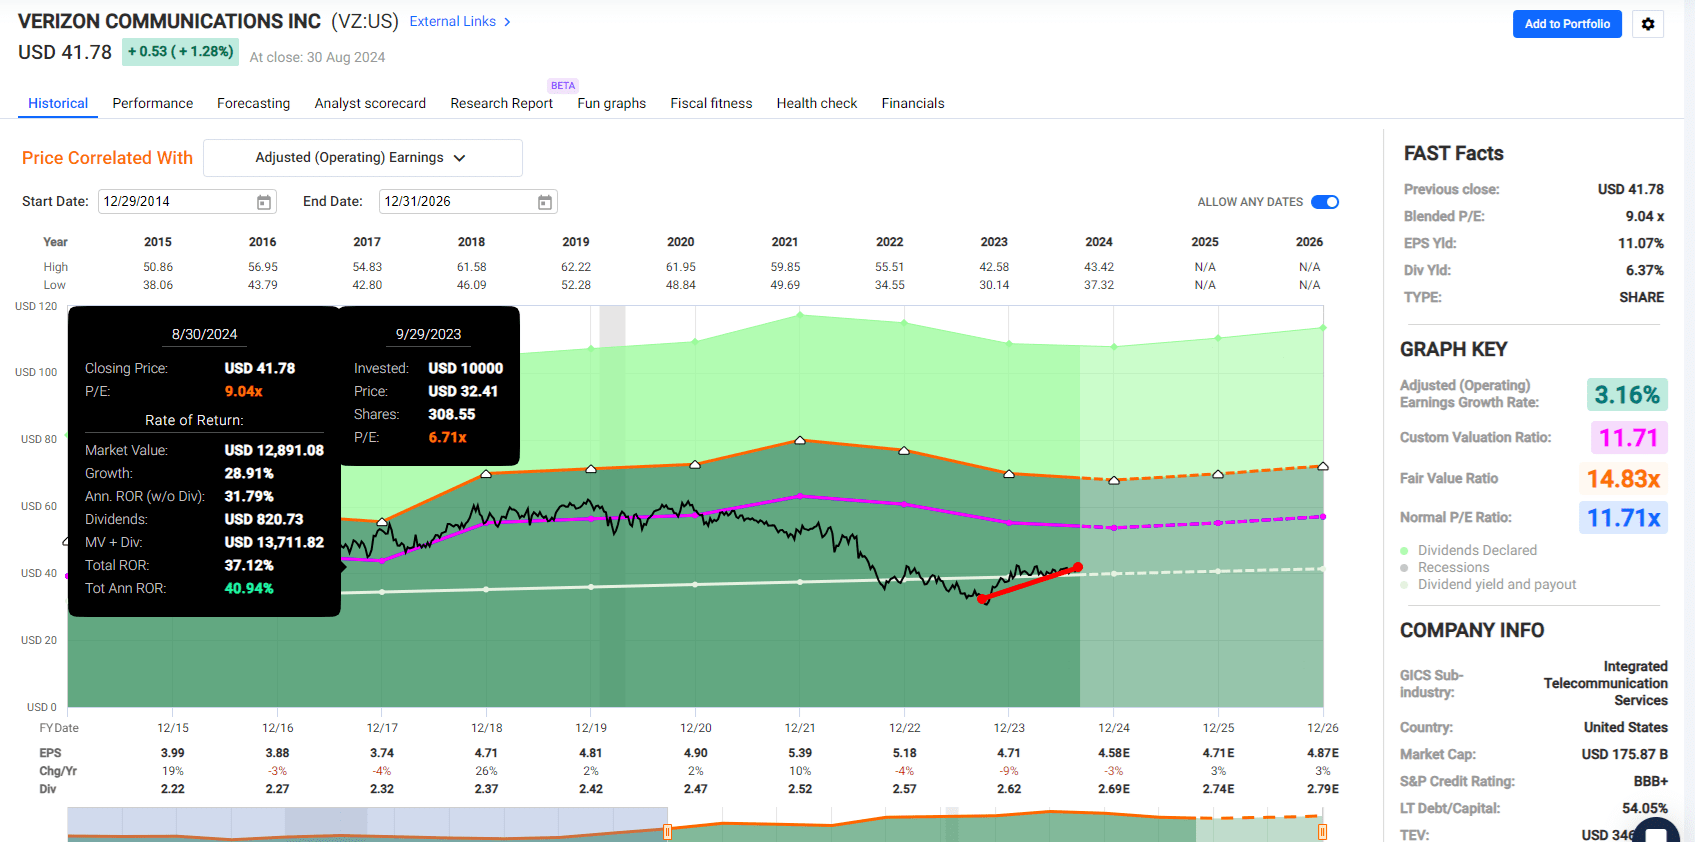
I’ve recommended VZ 13 times since 2016, with the average 12-month price return (excluding dividends) averaging 22.43%.
- Always and forever, it’s a market of stocks, not a stock market.
- Buffett-like returns from blue-chip bargains are hiding in plain sight.
- No market timing is required.
The secret to success like this isn’t magic or market timing. It’s what I call “long-term quantitative fundamental investing.”
As Ben Graham recommended, I look at the past, present, and likely future.
I look at the quantitative facts (the math) and the qualitative (the “story”).
The key is to build a holistic model incorporating quantitative and qualitative information about the past, present, and future.
Then, we must continually improve, update, and follow that model systematically.
The disciplined financial scientist will make money over the long term because the facts and fundamentals are all that matter in the end.
You are not right because others agree with you. You are right because your facts and reasoning are right.” Warren Buffett
That 8.6% peak yield was due to the market worrying about Verizon’s dividend safety. I’ve just completed the annual review based on over 1,000 metrics, and here’s the conclusion.
| Rating | Dividend Kings Safety Score (Over 1,000 Metric Model) | Approximate Dividend Cut Risk (Average Recession) | Approximate Dividend Cut Risk In Pandemic Level Recession |
| 1 – unsafe | 0% to 20% | over 4% | 16+% |
| 2- below average | 21% to 40% | over 2% | 8% to 16% |
| 3 – average | 41% to 60% | 2% | 4% to 8% |
| 4 – safe | 61% to 80% | 1% | 2% to 4% |
| 5- very safe | 81% to 100% | 0.5% | 1% to 2% |
| VZ | 95% | 0.5% | 1.25% |
| S&P Risk Rating | 61% Percentile, Good | BBB+ stable outlook credit rating = 5% 30-year bankruptcy risk | 15% or Less Max Risk Cap |
(Source: Dividend Kings Zen Research Terminal)
Verizon’s dividend safety is almost unchanged from last year’s 96% thanks to several protective factors.
Verizon has been paying dividends since 1984 when it was known as Bell Atlantic. Ben Graham considered 20-plus years without a dividend cut an essential sign of quality, and Verizon is at 40 years, an investing lifetime of impressive dividend dependability.
Of course, dividend safety is much more than no-cuts or growth streaks (e.g., the 19-year dividend growth streak).
Verizon’s Payout Ratio of 58.7% is well below the 70% rating agencies consider safe for this industry.
| Year | Dividend | EPS | FCF Per Share | EPS Payout Ratio | FCF Payout Ratio | Dividend Cost (Billions) | Retained Earnings |
Retained Free Cash Flow |
| 2024 | 2.68 | 4.58 | 4.32 | 58.5% | 62.0% | $11.31 | $8.02 | $6.92 |
| 2025 | 2.73 | 4.69 | 4.68 | 58.2% | 58.3% | $11.52 | $8.27 | $8.23 |
| 2026 | 2.79 | 4.89 | 4.69 | 57.1% | 59.5% | $11.77 | $8.86 | $8.02 |
| 2027 | 2.84 | 4.96 | 4.71 | 57.3% | 60.3% | $11.98 | $8.95 | $7.89 |
| 2028 | 2.9 | 4.82 | 4.97 | 60.2% | 58.4% | $12.24 | $8.10 | $8.74 |
| 2029 | 2.96 | 5.17 | 5.14 | 57.3% | 57.6% | $12.49 | $9.33 | $9.20 |
| Total/Annualized | 1.7% | 2.0% | 2.9% | -0.4% | -1.2% | 1.7% | $51.53 | $48.99 |
(Source: FactSet Research)
Verizon’s average EPS payout ratio is 58%, and its average FCF payout ratio is 59%, well below 70%.
Slowly falling payout ratios should help build up steadily larger safety cushions totaling $52 billion in retained earnings and $49 billion in retained free cash flow through 2029.
Retained earnings and free cash flow are the money left over after running the business, investing in future growth, and paying dividends.
In the coming years, Verizon is expected to generate $49 billion in excess free cash flow above dividend costs.
That’s around $8 billion per year, and it can be used to pay down debt, buy back shares, or make acquisitions.
- VZ’s track record on acquisitions is abysmal.
- Investors should hope for debt repayment or buybacks.
Perplexity
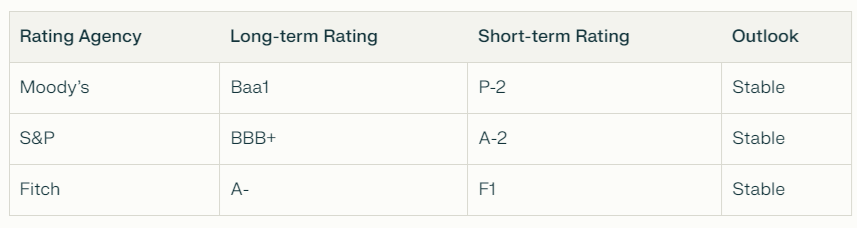
Moody’s and S&P rate Verizon BBB+ stable (or its equivalent), with Fitch rating A-.
That’s a 2.5% to 5% 30-year default risk. When a company defaults on its bonds, it usually files for bankruptcy, and the stock goes to zero.
In other words, credit ratings are the second-best proxy for fundamental risk, Buffett’s concept that actual risk has nothing to do with volatility.
Fundamental risk is the risk of permanent capital impairment, specifically the risk of losing 100% of your investment.
What’s the single best proxy for bankruptcy risk? Credit Default Swap derived default estimates.
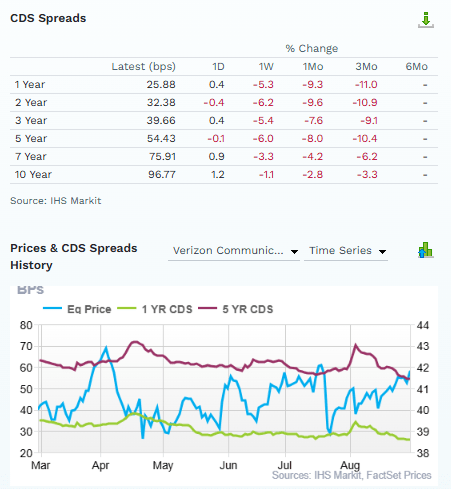
FactSet Research Terminal
Credit Default Swaps, or CDS, are insurance policies bond investors take out against the risk of a company or government defaulting on its bonds.
The spreads of these CDS can be used to estimate default risk in real time, not just over 30 years but also over shorter periods, such as a year or five-year risk.
The value of CDS is that rating agencies update their ratings once per year unless something significant happens, like an acquisition.
CDS spreads allow us to know, with a 24-hour lag, what the “smart money” on Wall Street thinks about a company’s risks.
If a scary headline breaks and the stock price falls 10%, check the CDS spreads to see whether the company’s fundamental risk is affected and how much.
In Verizon’s case, the price bottomed in early May 2023 (the yield peaked in September due to a dividend hike).
What was Verizon’s fundamental risk doing when it fell to its 52-week lows in May? The fundamental one and five-year risk of default (bankruptcy) was declining.
When the dividend yield reached 8.6%, the highest level in company history, it remained relatively flat and low, 0.3% over the next year and 0.6% over the next five years.
Let’s put that another way: September 2023. Verizon is roiled by fears of lead lawsuits, and some SA authors are claiming the dividend is in danger.
What does the bond market say? The 30-year risk of bankruptcy is 3%, consistent with an A-credit rating.
This is why I was so confident in pounding the table on VZ in September. Not that the dividend was risk-free by any means.
CDS doesn’t predict dividend safety, it’s just financial stress.
But when the “smart money” on Wall Street says that a crashing stock price is detached from fundamental risk, and rating agencies and the analyst consensus agree, management’s guidance of a safe and growing dividend has much more credibility.
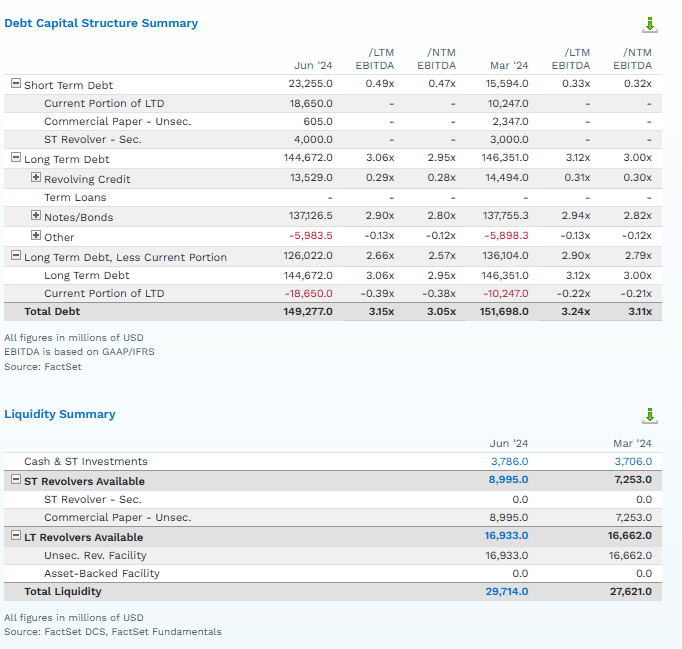
FactSet
Verizon’s debt/EBITDA ratio, i.e., “leverage,” is 3.15 and is expected to hit 3.05X in the coming year.
Rating agencies consider 3.5X or lower safe because this industry has stable, predictable, and recurring revenue.
Verizon has $150 billion in debt, but thanks to almost $50 billion in annual cash flow, that level of debt is safe and manageable.
Remember that debt is not good or bad; what matters is how debt is used.
Debt levels are irrelevant. Only debt ratios matter.
Apple (AAPL) has $101 billion in debt but just -$48 billion in net debt (debt minus cash).
What if Verizon’s debt rises to $1.5 trillion in the coming century? As long as its cash flow increases to $500 billion, its leverage ratio will remain around 3X, and its debt levels will not threaten the dividend.
Verizon Consensus Balance Sheet Forecast
| Year | Debt/EBITDA | Net Debt/EBITDA (3.5 Or Less Safe According To Credit Rating Agencies) |
Interest Coverage (4+ Safe) |
| 2023 | 3.15 | 3.11 | 4.14 |
| 2024 | 3.00 | 2.91 | 4.69 |
| 2025 | 2.82 | 2.71 | 4.91 |
| 2026 | 2.65 | 2.54 | 5.24 |
| 2027 | 2.55 | 2.44 | 6.10 |
| 2028 | 2.62 | 2.56 | 6.67 |
| Annualized Change | -3.6% | -3.8% | 10.0% |
(Source: FactSet Research)
Verizon’s debt is expected to fall $20 billion by 2028 as its cash flows grow at a modest 1% per year (basically keeping up with inflation).
However, that’s good enough to generate significant de-leveraging, which will probably earn VZ an A-credit rating by 2029 or 2030.
While unlikely over the next couple of years, an upgrade would be predicated on the company achieving leverage of 2.5x and maintaining wireless service revenue growth and stable EBITDA margins.” – S&P
3.5X leverage is safe for BBB-rated telecoms, and at 2.5X leverage, rating agencies typically assign A-credit ratings.
Reason Two To Love Verizon: An Attractive Valuation
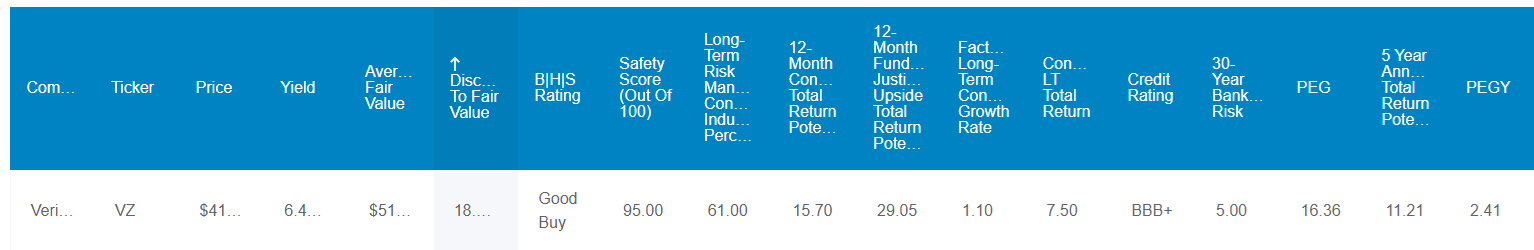
Dividend Kings Zen Research Terminal
Verizon is 18% historically undervalued compared to its historical market-determined fair value PE ratio and five-year average dividend yield.
The five-year average yield is 5.5%, a conservative estimate of continued slow growth in the future.
The 13-year median yield is 4.6%, indicating that when VZ is in high-growth mode, its fair value yield is about 1% lower.
Verizon’s Historical Valuation Profile
| Time Frame (Years) | Average PE | Average P/FCF | Annual EPS Growth | Annual FCF Growth | EPS PEG | FCF PEG |
| 20 | 13.57 | 11.8 | 3.21 | 1.33 | 4.23 | 8.87 |
| 19 | 13.62 | 11.94 | 3.57 | 2.63 | 3.82 | 4.54 |
| 18 | 13.54 | 11.86 | 3.66 | 3.86 | 3.70 | 3.07 |
| 17 | 13.7 | 11.85 | 5.02 | 4.17 | 2.73 | 2.84 |
| 16 | 13.49 | 11.6 | 4.42 | 3.33 | 3.05 | 3.48 |
| 15 | 13.22 | 11.32 | 4.2 | 2.48 | 3.15 | 4.56 |
| 14 | 13.28 | 11.4 | 4.93 | -0.52 | 2.69 | -21.92 |
| 13 | 13.31 | 11.81 | 5.88 | -2.25 | 2.26 | -5.25 |
| 12 | 13.07 | 12.31 | 6.75 | -0.59 | 1.94 | -20.86 |
| 11 | 12.51 | 12.7 | 6.65 | -1.68 | 1.88 | -7.56 |
| 10 | 11.98 | 13.21 | 5.19 | -5.4 | 2.31 | -2.45 |
| 9 | 11.71 | 13.8 | 3.86 | 3.09 | 3.03 | 4.47 |
| 8 | 11.38 | 13.79 | 2.1 | -1.89 | 5.42 | -7.30 |
| 7 | 11.35 | 14.6 | 2.81 | 18.12 | 4.04 | 0.81 |
| 6 | 10.87 | 12.14 | 3.92 | 14.49 | 2.77 | 0.84 |
| 5 | 10.39 | 11.61 | 0 | 0.73 | NA | 15.90 |
| 4 | 9.88 | 11.45 | -0.52 | 0.79 | -19.00 | 14.49 |
| 3 | 9.31 | 10.45 | -1.31 | -7.96 | -7.11 | -1.31 |
| 2 | 8.42 | 10.49 | -6.52 | -2.19 | -1.29 | -4.79 |
| 1 | 7.81 | 10.14 | -9.08 | 32.96 | -0.86 | 0.31 |
| Average | 11.8205 | 12.0135 | 2.437 | 3.275 | 0.99 | -0.36 |
| Median | 12.245 | 11.83 | 3.76 | 1.06 | 2.73 | 0.82 |
(Source: FAST Graphs, FactSet)
Verizon’s average growth rate across all rolling periods over the last 20 years is 2.44%, with a median growth rate of 3.8%.
In other words, 50% of the time, VZ grows earnings faster than 3.8% and half the time slower.
Free cash flow usually grows slightly faster over the long term (by about 1%), but free cash flow growth can be negative for many years.
The average PEG ratio is 1, including periods of negative PEG. The median PEG ratio is 2.73.
However, that doesn’t tell us much these days when Verizon is in a prolonged growth mode.
Verizon 2026 Consensus Total Return Potential: 51% = 19% annualized vs 35% S&P (12% annualized)
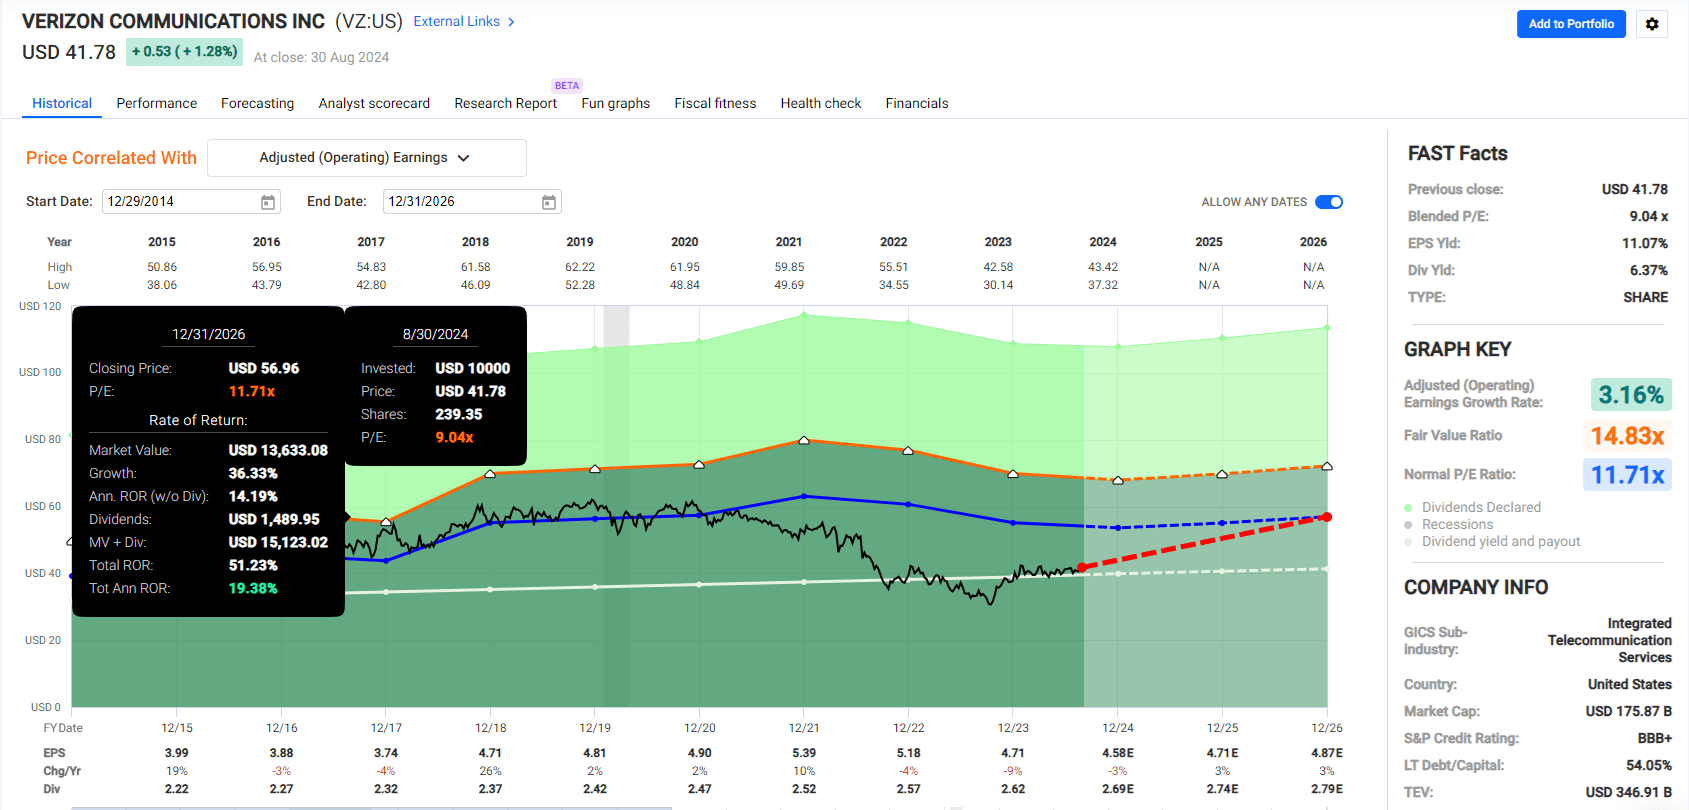
FAST Graphs, FactSet
Verizon 2029 Consensus Total Return Potential: 76% = 11% annualized vs 35% S&P (12% annualized)
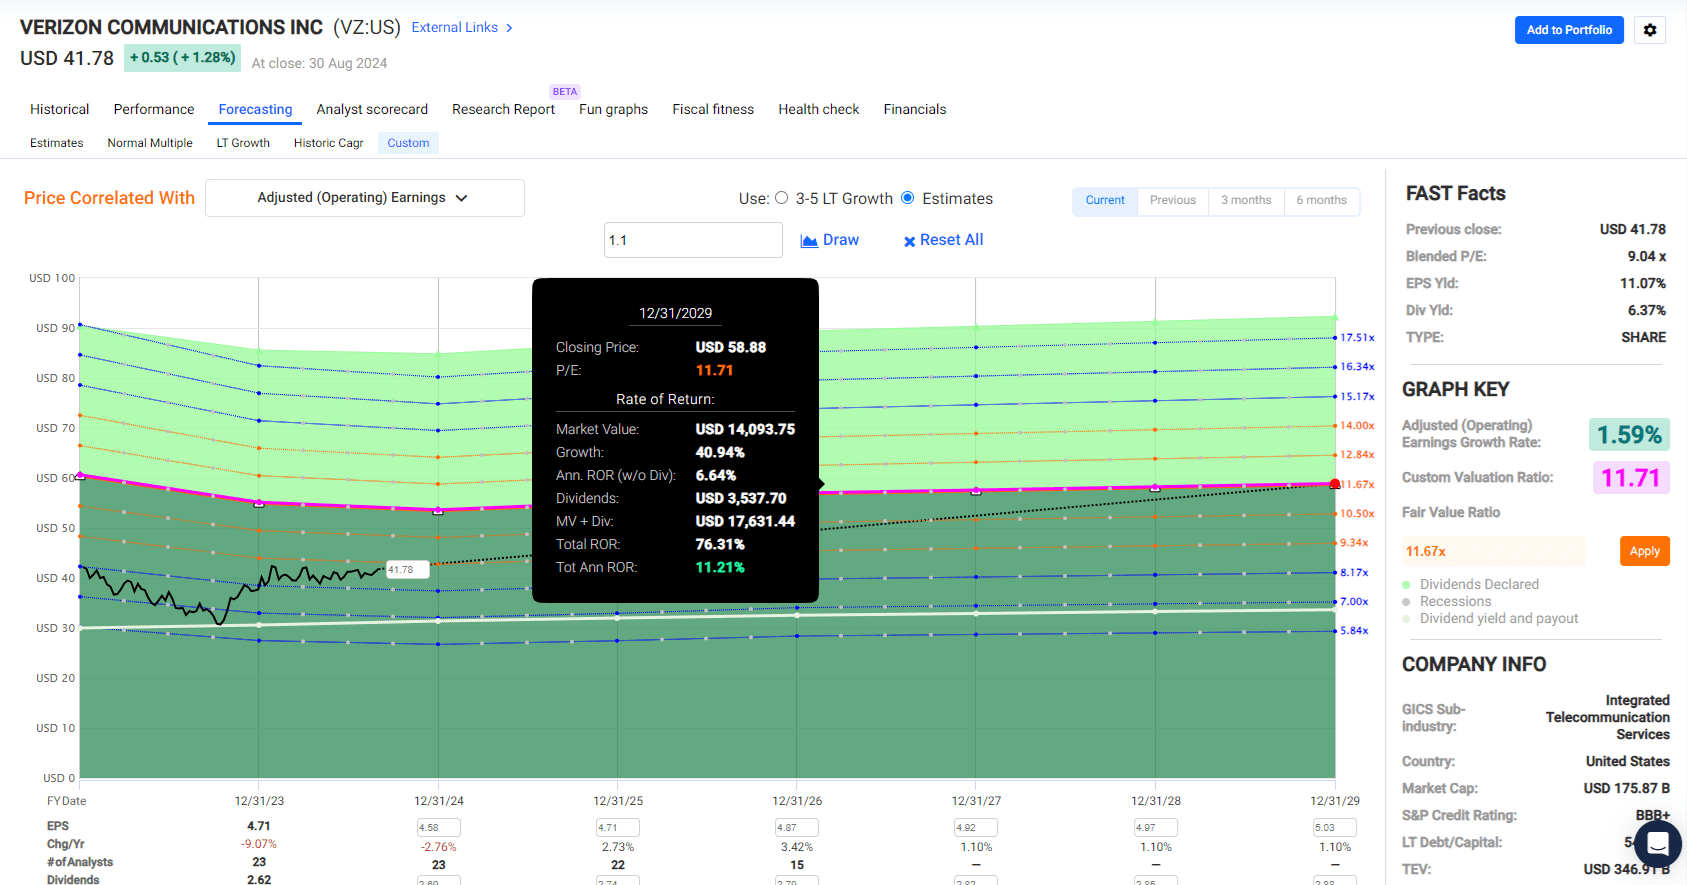
FAST Graphs, FactSet
Verizon isn’t going to beat the S&P long term, but that’s not its job.
It can outperform over shorter periods as it has since I last recommended it.
VZ is up 35% since then and has a 29% 12-month justified return potential in the next year.
- Not a forecast.
- I never Forecast.
- If and only if VZ grows as expected, a return to historical fair value would justify a 29% gain 12 months from now.
In other words, if Verizon does what analysts and management expect, then a 29% gain in the next 12 months would be 100% justified by fundamentals.
Verizon, at fair value, would yield 5.2%. Its price would have soared 70% off the 2023 lows, and its total returns would have delivered 87% total returns, including dividends.
And even then, after almost doubling investors’ money off the lows, Verizon would still be a potentially reasonable buy for anyone comfortable with its fundamental income and total return profile.
Reason Three To Love Verizon: Relative Lower Volatility
Portfolio Visualizer
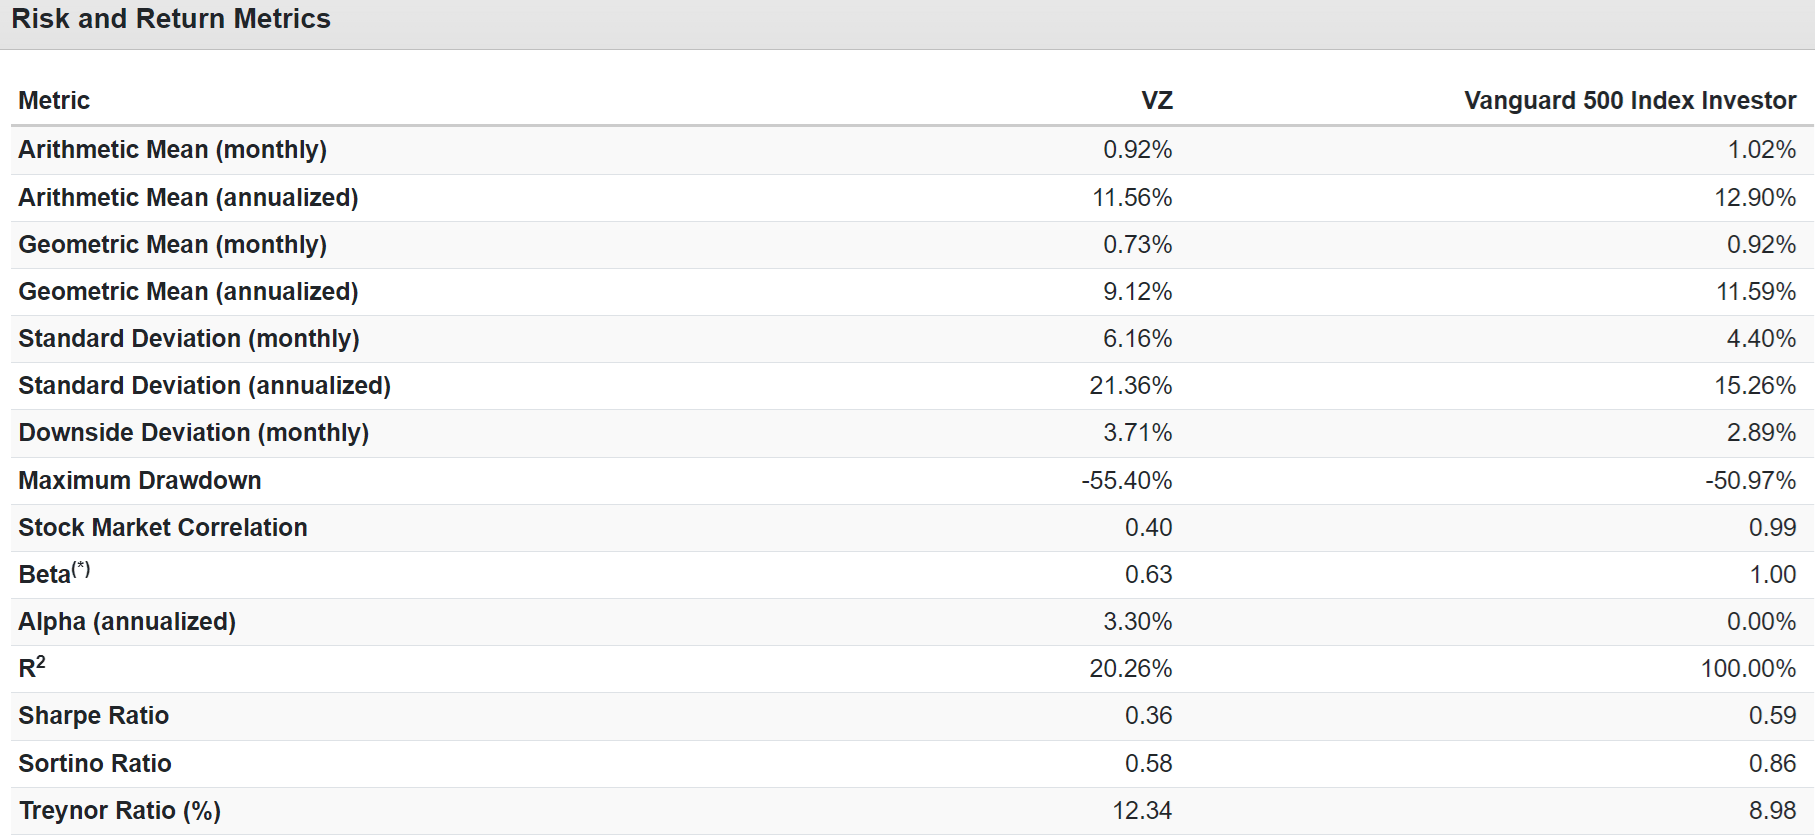
Verizon’s historical beta is 0.63, meaning that since 1985, when the S&P is up or down, VZ has been up or down 63% as much.
Its correlation to the S&P is 0.4, which is very low.
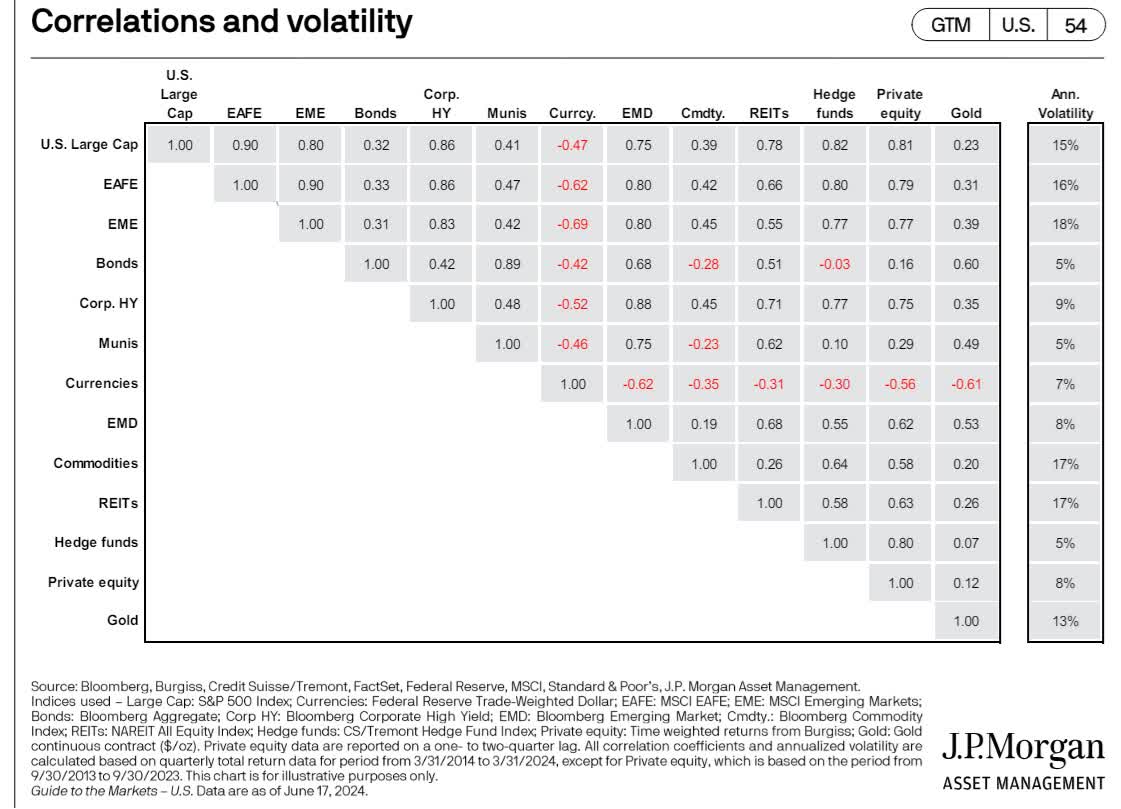
JPMorgan Asset Management
A correlation of 0.4 is the exact historical correlation that US stocks have with municipal bonds.
That doesn’t mean that Verizon should replace munis in your portfolio, but it shows just how good of a diversifier VZ can be when the market falls hard and fast.
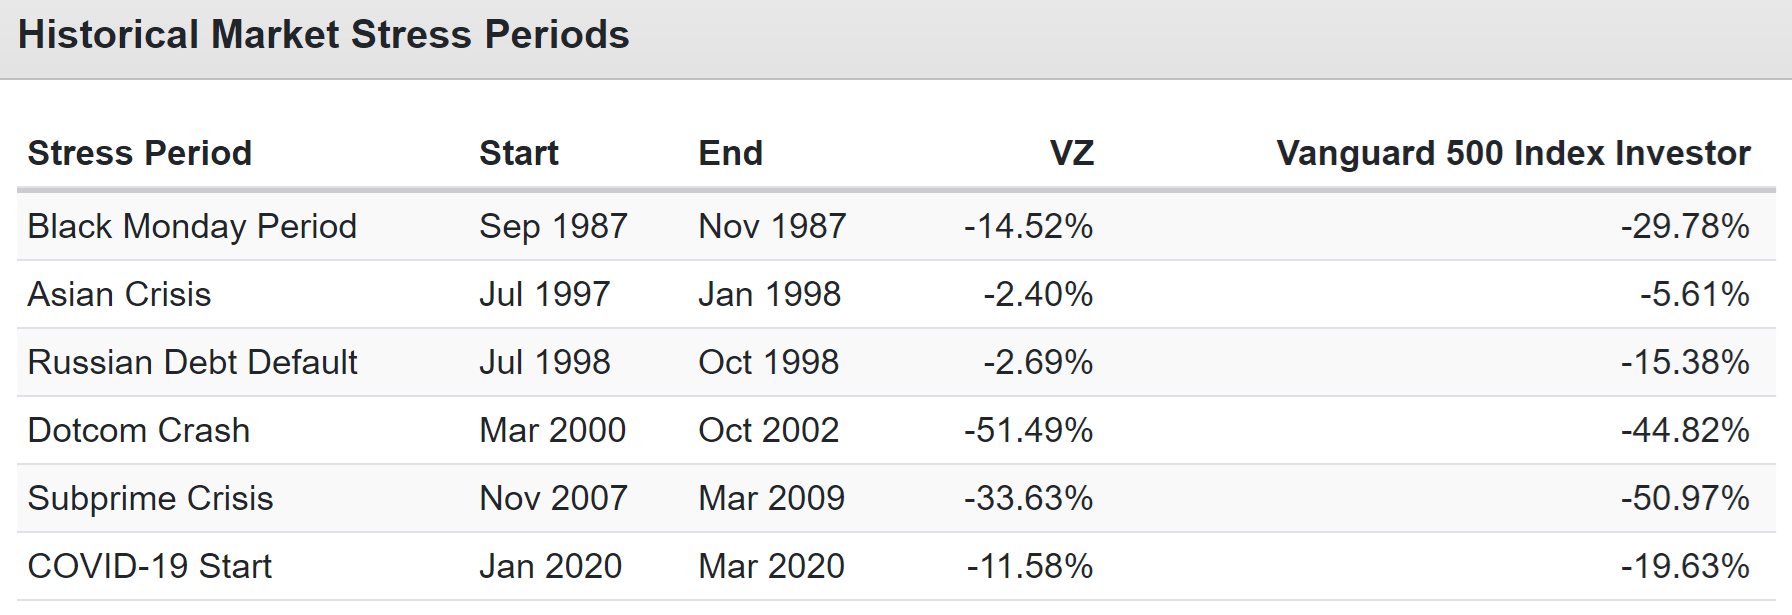
JPMorgan Asset Management
In most corrections, Verizon tends to be defensive as long as Verizon’s fundamentals aren’t at risk (company-specific bear market catalyst).
Verizon’s Returns In Negative Years For US Stocks
| VZ |
Vanguard 500 Index Investor |
||
| Year | Inflation | Return | Return |
| 2008 | 0.09% | -18.02% | -37.02% |
| 2002 | 2.38% | -15.12% | -22.15% |
| 2022 | 6.45% | -20.01% | -18.23% |
| 2001 | 1.55% | -2.47% | -12.02% |
| 2000 | 3.39% | -16.29% | -9.06% |
| 2018 | 1.91% | 11.25% | -4.52% |
| 1990 | 6.11% | 0.98% | -3.32% |
| Average | -8.53% | -15.19% | |
| Median | -15.12% | -12.02% |
(Source: Portfolio Visualizer)
Verizon’s average decline in a bad year for stocks is half as severe as the S&P.
Reason One To Avoid Verizon: Sub-Inflation Growth Expectations
I will never personally buy Verizon shares. I own some courtesy of exposure to the S&P 500.
The reason my family won’t buy Verizon is its growth potential.
FactSet Research Terminal
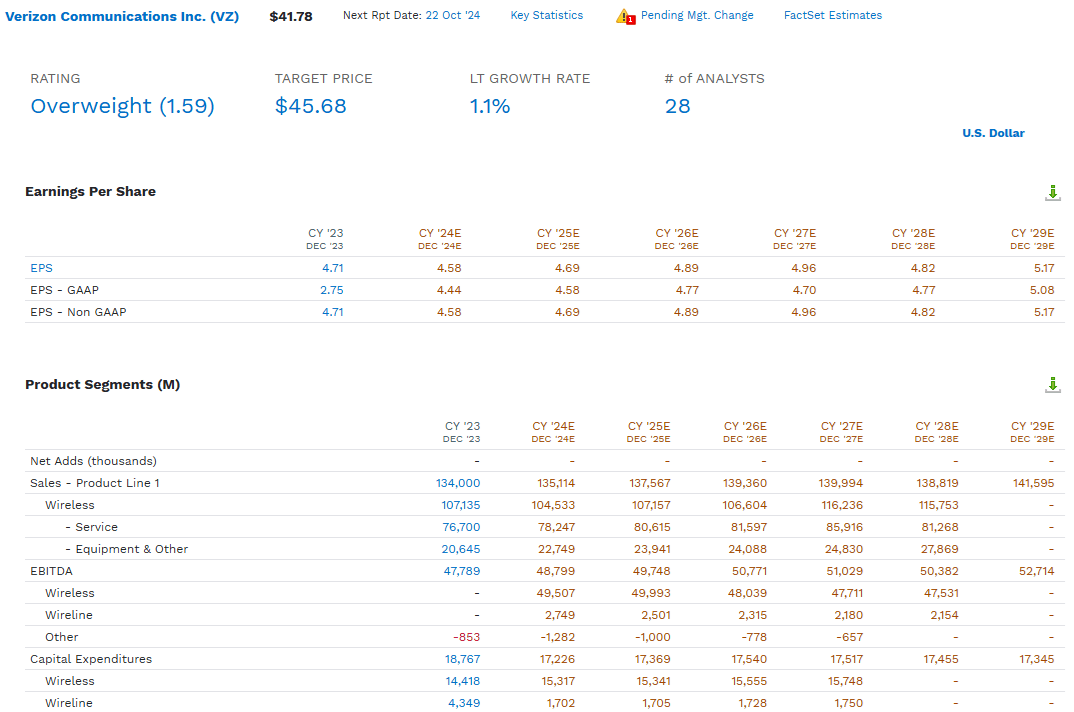
The median growth consensus of all 28 analysts who cover VZ for a living and collectively know the company better than anyone other than management expects Verizon to grow its EPS by 1.1% long term, about 50% slower than long-term inflation.
Verizon Medium-Term Growth Consensus
| Year | Sales | Free Cash Flow | EBITDA | EBIT (Operating Income) | Net Income |
| 2023 | $134,000 | $18,708 | $47,789 | $22,877 | $19,749 |
| 2024 | $135,114 | $18,589 | $48,799 | $30,959 | $19,094 |
| 2025 | $137,567 | $19,228 | $49,748 | $31,835 | $19,647 |
| 2026 | $139,360 | $19,896 | $50,771 | $32,812 | $20,429 |
| 2027 | $139,994 | $20,418 | $51,029 | $32,597 | $20,228 |
| 2028 | $138,819 | $20,964 | $50,382 | $32,481 | $20,599 |
| 2029 | $141,595 | $21,761 | $52,714 | $34,804 | $21,893 |
| Annualized Growth 2024-2029 | 0.9% | 2.2% | 2.0% | 7.2% | 1.7% |
| Cumulative 2024-2029 | $832,449 | $120,856 | $303,443 | $195,488 | $121,890 |
(Source: FactSet)
Verizon is growing sales at 1% and cash flow at 2%.
That’s not keeping up with inflation. Long-term analysts expect 1.7% dividend growth through 2028, also below inflation.
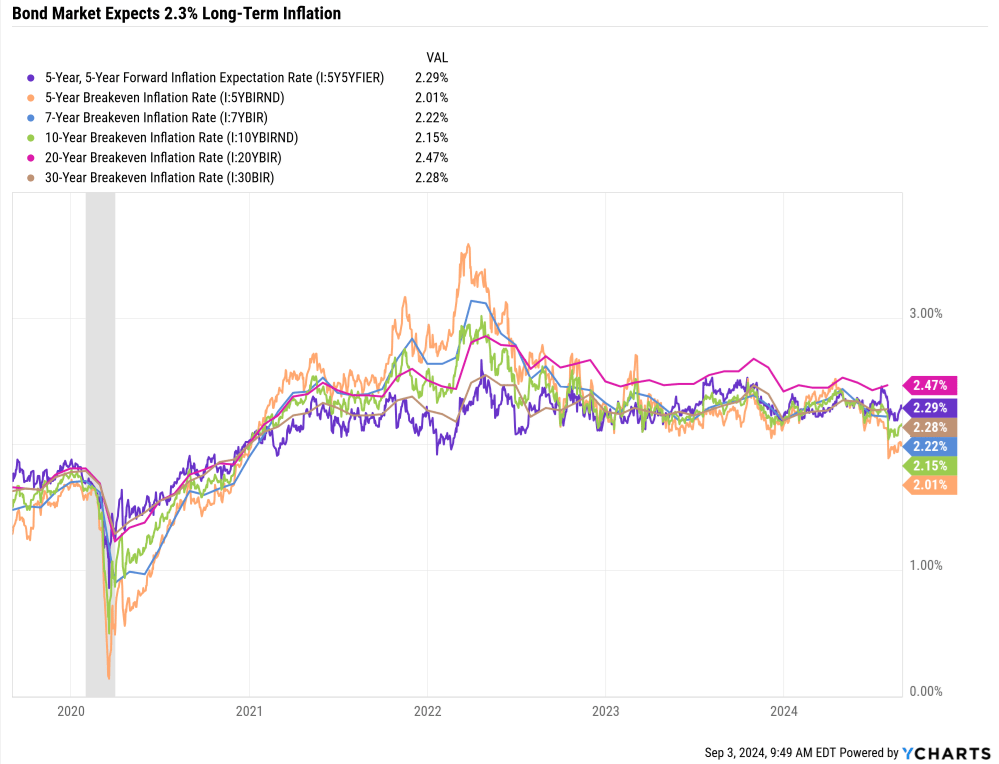
Long-term 1% to 2% dividend growth is expected to lose to inflation, though very slowly.
YCharts
The bond market is priced at 2% to 2.5% long-term inflation, depending on the time frame.
OK, that’s the median consensus, but what about the range? Are there any analysts who are bullish on Verizon’s growth prospects?
- -0.2% to 3% long-term growth range.
In other words, while no analyst thinks Verizon’s highly negative growth of recent years will continue for the foreseeable future, no expert on this company says it will grow significantly faster than inflation either.
Remember what fair value means.
Fair value is the price at which you fully participate in a company’s future growth and upside.” – Chuck Carnevale
At fair value (5.2% yield), Verizon’s total return potential would be 5% to 8.2%, with a consensus of 6.3%.
Not only is that a feeble return for any individual stock, but 5% total returns is what corporate bond ETFs can achieve, with lower annual volatility.
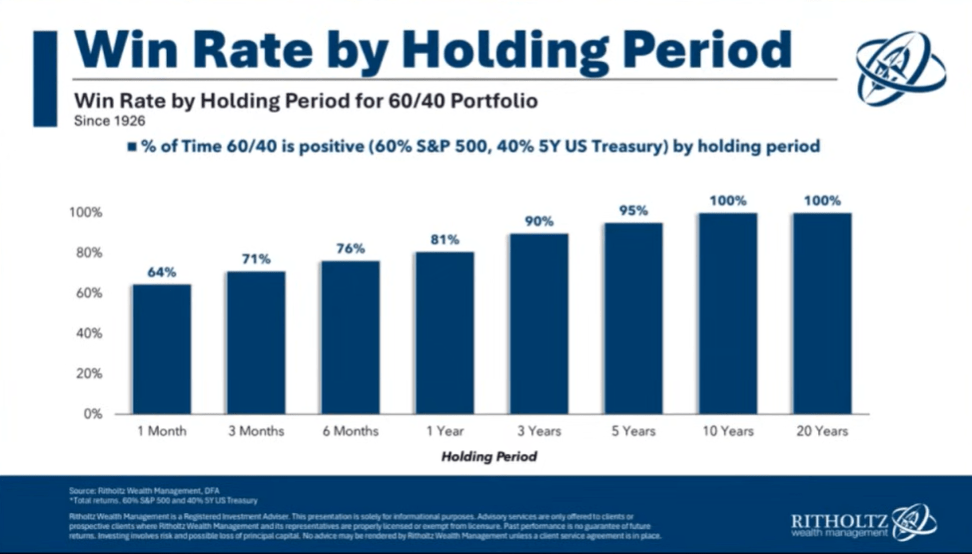
I consider 8% the low end of acceptable return for defensive stocks because 8% is the historical return for the 60-40 stock/bond retirement portfolio.
It’s the gold standard hedge fund design and long-term risk-free strategy.
Ritholtz Wealth Management
The 60-40 stock/bond portfolio has never had a lost decade since 1926.
Ritholtz Wealth Management
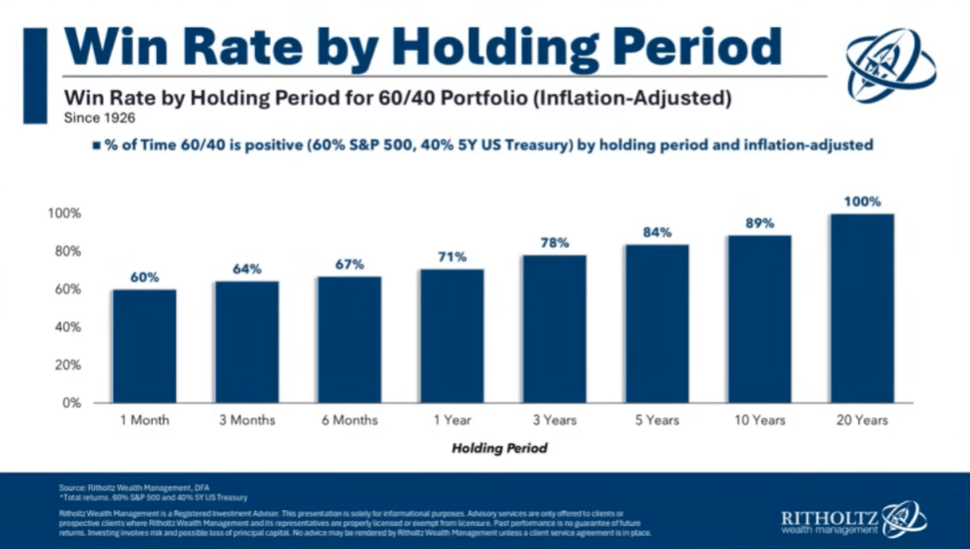
Adjusted for inflation, since 1926, even with inflation hitting 22% post-WWII, investors have never suffered long-term losses from a 60-40 portfolio.
Which delivers 8% long-term nominal returns and 5% inflation-adjusted returns.
In other words, a defensive high-yield investment with relatively low volatility must offer an 8% return potential to justify taking on single stock risk.
Reason Two To Avoid Verizon: Its Risk Profile

Ritholtz Wealth Management
Not adjusting for inflation, there has never been a 12-year period when US stocks haven’t gone up.
However, while the US stock market is relatively “risk free” as long your time horizon is long enough and you avoid panic selling for financial or emotional reasons, individual stocks are very risky.
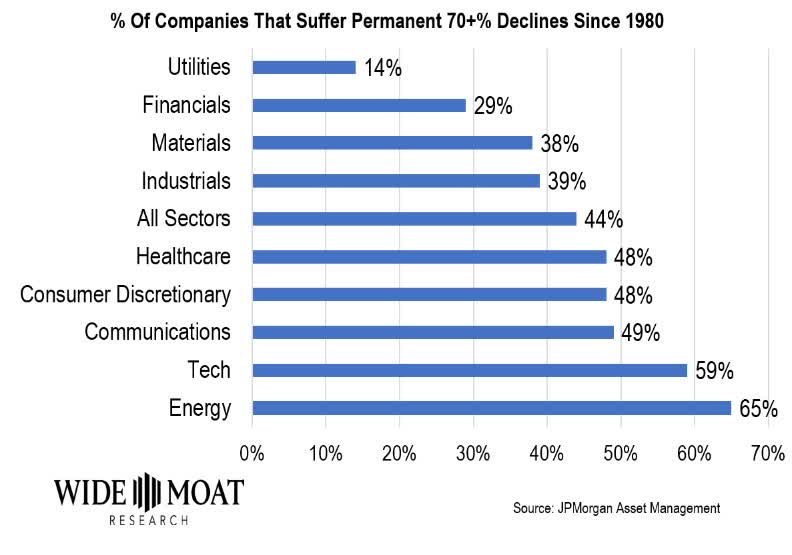
Wide Moat Research
Almost half of US stocks eventually fell 70%-plus and never recovered. Depending on the sector, it can be a 65% risk.
Even the best companies today can turn into dumpster fires.
GE was once an AAA-rated dividend aristocrat that hadn’t missed earnings in 10 years and was led by Fortune’s “CEO of the Century.” It was the most valuable company on earth in 2000, and after five dividend cuts, investors still haven’t recovered.
That’s why I require all companies to offer sufficient total return potential. If I can earn 8% risk-free long-term returns with a 60-40, why would I ever buy a stock offering less return with far higher risk?
- Verizon has a 3% to 5% risk of going to zero within 30 years.
- According to rating agencies and the bond market.
Even the dividend safety can change in a hurry.
For example, if Verizon were to be hammered with the worst-case scenario lead, then, like 3M (MMM), it might have to cut the dividend.
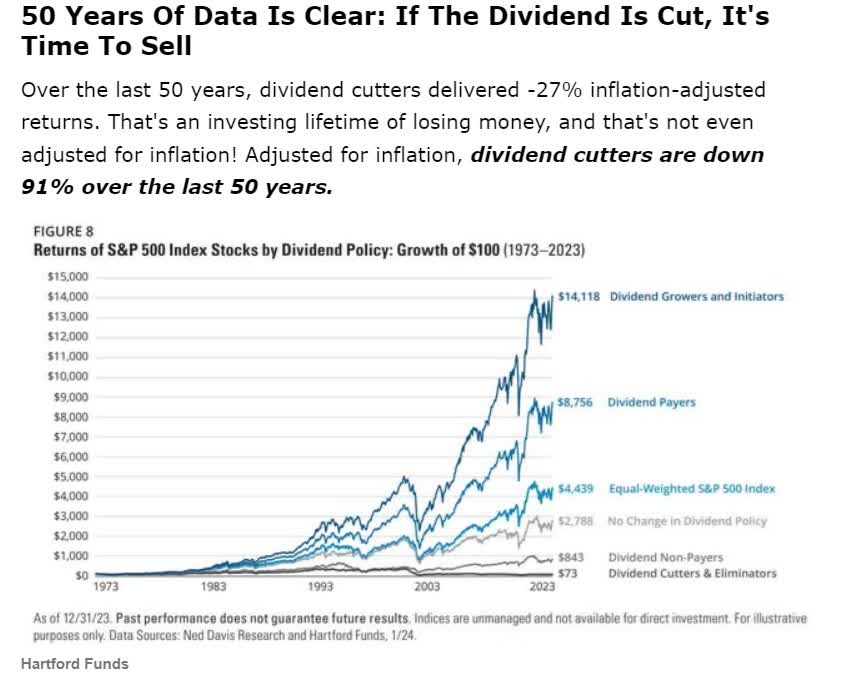
Hartford Funds
I would never own a dividend cutter because the long-term data against doing so is overwhelmingly compelling.
Update On Verizon’s Fundamental Risks
Verizon faces significant legal and financial challenges due to toxic lead-sheathed cables in its infrastructure. A Wall Street Journal investigation highlighted this issue, highlighting potential health and environmental risks associated with these cables.
Potential Liabilities and Costs
Analysts have provided a range of estimates regarding the potential financial impact on Verizon:
- Worst-case scenario: Initial estimates suggested that the telecom industry’s cost of removing and replacing these cables could be as high as $59 billion. However, recent estimates have significantly reduced Verizon’s potential liability to around $1 billion. This reduction reflects a reassessment of the extent and impact of the lead-sheathed cables.
- Most Likely Scenario: The situation remains fluid while the worst-case estimates have been adjusted downward. Verizon and other telecom companies will face ongoing legal battles and potential remediation costs. Analysts suggest that the litigation and cleanup process could take 5 to 10 years to resolve, with total industry costs potentially reaching $43 billion before litigation.
Verizon’s most likely annual expenses from the lead removal will be $100 to $200 million annually.
- Vs. $9 billion in annual free cash flow.
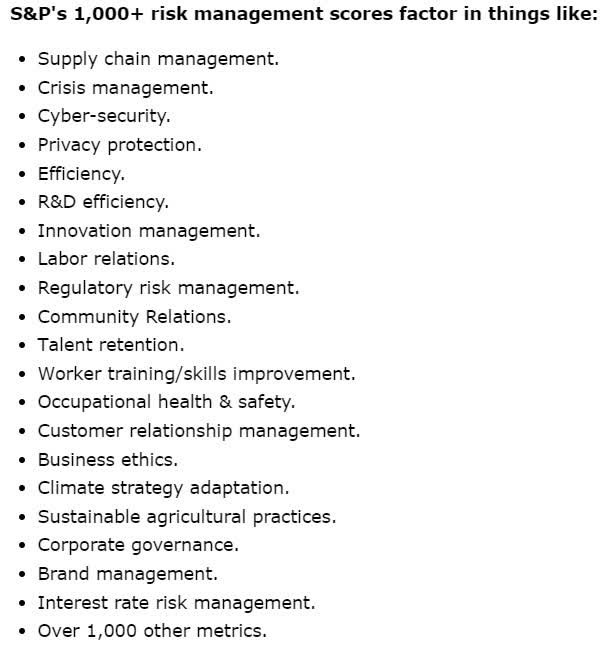
S&P
Verizon faces other kinds of risk, according to S&P.
| S&P LT Risk Management Score | Rating |
| 0% to 9% | Very Poor |
| 10% to 19% | Poor |
| 20% to 29% | Suboptimal |
| 30% to 59% | Acceptable |
| 60% to 69% | Good |
| 70% to 79% | Very Good |
| 80+% | Exceptional |
| Verizon | 37.89% |
| Global Percentile | 61.39% |
(Source: S&P)
Verizon is 38% optimal in its risk management. That’s compared to the No. 1 ranked company in the industry on each risk.
In other words, compared to the realistically best risk management any telecom could deliver, Verizon is 38% perfect at managing risk, putting it in the top 39% of global companies.
Even though Verizon is historically a low-volatility stock, that doesn’t mean it can suffer idiosyncratic crashes.
In a correction, it’s usually low volatility. However, during Verizon bear markets, it can crash even if stocks are rising.
Verizon’s 50 (10%) Worst Months Since 1985
| VZ |
Vanguard 500 Index Investor |
||
| Year | Month | Return | Return |
| 2000 | 2 | -20.99% | -1.91% |
| 2002 | 7 | -16.97% | -7.72% |
| 1986 | 9 | -13.60% | -8.31% |
| 1990 | 8 | -13.42% | -9.03% |
| 2002 | 4 | -12.22% | -6.07% |
| 1997 | 3 | -12.12% | -4.14% |
| 2000 | 5 | -11.88% | -2.04% |
| 2018 | 2 | -11.71% | -3.69% |
| 2002 | 9 | -11.48% | -10.87% |
| 2005 | 1 | -11.28% | -2.45% |
| 1990 | 1 | -11.25% | -6.72% |
| 2000 | 12 | -10.79% | 0.51% |
| 2009 | 1 | -10.62% | -8.41% |
| 2003 | 7 | -10.40% | 1.74% |
| 1999 | 3 | -10.30% | 4.00% |
| 2008 | 1 | -10.20% | -6.02% |
| 2013 | 5 | -10.07% | 2.33% |
| 2001 | 2 | -9.92% | -9.14% |
| 2010 | 1 | -9.88% | -3.60% |
| 2003 | 2 | -9.67% | -1.52% |
| 2022 | 8 | -9.48% | -4.09% |
| 1987 | 11 | -9.19% | -8.19% |
| 2022 | 9 | -9.18% | -9.22% |
| 2020 | 2 | -8.88% | -8.24% |
| 1991 | 9 | -8.77% | -1.67% |
| 2008 | 9 | -8.63% | -8.91% |
| 1991 | 1 | -8.51% | 4.32% |
| 2004 | 5 | -8.37% | 1.36% |
| 2023 | 5 | -8.24% | 0.42% |
| 2003 | 9 | -8.15% | -1.07% |
| 1990 | 2 | -8.06% | 1.27% |
| 2022 | 4 | -8.00% | -8.73% |
| 2008 | 6 | -7.98% | -8.44% |
| 2022 | 7 | -7.84% | 9.21% |
| 1998 | 4 | -7.79% | 1.01% |
| 2001 | 8 | -7.66% | -6.27% |
| 2014 | 12 | -7.53% | -0.26% |
| 2002 | 12 | -7.47% | -5.89% |
| 2023 | 9 | -7.35% | -4.78% |
| 2001 | 10 | -7.28% | 1.90% |
| 2000 | 7 | -7.27% | -1.50% |
| 2017 | 1 | -7.19% | 1.88% |
| 1993 | 4 | -7.12% | -2.42% |
| 1988 | 3 | -7.09% | -3.04% |
| 2000 | 8 | -6.92% | 6.19% |
| 2018 | 12 | -6.77% | -9.04% |
| 2023 | 7 | -6.70% | 3.20% |
| 2023 | 2 | -6.64% | -2.45% |
| 2002 | 6 | -6.63% | -7.13% |
| 2008 | 2 | -6.46% | -3.25% |
| Average | -9.44% | -3.14% | |
| Median | -8.70% | -3.15% |
(Source: Portfolio Visualizer)
In its 10% worst months, Verizon averaged a 3X worse decline than the S&P, falling 9%.
In early 2000, it fell 21% in one month, while the S&P was down 2%.
Remember, long-term low volatility means nothing because any stock can fall any amount in the short term.
Sleep Well At Night quality ratings are based not on volatility but on fundamental risk and dividend safety.
Verizon’s 50 (10%) Best Year Since 1985
| VZ |
Vanguard 500 Index Investor |
||
| Year | Month | Return | Return |
| 2002 | 10 | 39.27% | 8.78% |
| 2000 | 3 | 24.90% | 9.75% |
| 2000 | 10 | 20.26% | -0.43% |
| 1999 | 6 | 19.41% | 5.56% |
| 2024 | 1 | 14.25% | 1.67% |
| 2007 | 5 | 14.01% | 3.48% |
| 1998 | 3 | 13.93% | 5.10% |
| 1997 | 4 | 12.89% | 5.96% |
| 2001 | 4 | 12.59% | 7.77% |
| 2010 | 7 | 12.56% | 7.00% |
| 1999 | 4 | 12.29% | 3.85% |
| 1990 | 10 | 11.94% | -0.41% |
| 1988 | 1 | 11.92% | 4.17% |
| 1999 | 1 | 11.88% | 4.20% |
| 2010 | 12 | 11.78% | 6.67% |
| 1997 | 11 | 11.56% | 4.60% |
| 1990 | 5 | 11.50% | 9.69% |
| 2000 | 9 | 11.31% | -5.29% |
| 1997 | 9 | 11.14% | 5.47% |
| 1989 | 7 | 10.95% | 9.01% |
| 1989 | 4 | 10.94% | 5.18% |
| 2002 | 11 | 10.91% | 5.88% |
| 2013 | 4 | 10.83% | 1.91% |
| 2022 | 5 | 10.78% | 0.17% |
| 2023 | 10 | 10.73% | -2.12% |
| 1998 | 10 | 10.64% | 8.16% |
| 1987 | 8 | 10.62% | 3.84% |
| 1995 | 1 | 10.57% | 2.58% |
| 1987 | 1 | 10.56% | 13.27% |
| 1990 | 9 | 10.53% | -4.89% |
| 2001 | 1 | 10.42% | 3.55% |
| 2010 | 9 | 10.36% | 8.92% |
| 2008 | 11 | 10.04% | -7.17% |
| 1986 | 3 | 9.87% | 5.48% |
| 2017 | 7 | 9.81% | 2.04% |
| 1999 | 9 | 9.79% | -2.74% |
| 1998 | 9 | 9.77% | 6.41% |
| 2016 | 6 | 9.71% | 0.25% |
| 1985 | 11 | 9.49% | 6.94% |
| 2013 | 10 | 9.47% | 4.59% |
| 2016 | 1 | 9.46% | -4.98% |
| 1993 | 6 | 9.45% | 0.27% |
| 2015 | 10 | 9.13% | 8.42% |
| 2023 | 11 | 9.11% | 9.12% |
| 1992 | 12 | 9.04% | 1.21% |
| 1985 | 12 | 8.80% | 4.67% |
| 1992 | 4 | 8.64% | 2.91% |
| 1997 | 6 | 8.39% | 4.45% |
| 1992 | 7 | 8.29% | 4.04% |
| 2001 | 9 | 8.22% | -8.09% |
| Average | 11.89% | 3.62% | |
| Median | 10.69% | 4.33% |
(Source: Portfolio Visualizer)
Verizon has experienced three 20%-plus monthly rallies, including a nearly 40% gain in October 2000.
Low volatility doesn’t mean low volatility when the market is always falling.
The upside of the downside is that volatility can be cut both ways. After peak pessimism, the best rallies usually come, assuming the fundamental thesis remains intact.
Verizon’s Annual Returns Since 1985 (Worst To Best)
| VZ |
Vanguard 500 Index Investor |
||
| Year | Inflation | Return | Return |
| 2005 | 3.42% | -22.12% | 4.77% |
| 2022 | 6.45% | -20.01% | -18.23% |
| 2008 | 0.09% | -18.02% | -37.02% |
| 2000 | 3.39% | -16.29% | -9.06% |
| 2002 | 2.38% | -15.12% | -22.15% |
| 1994 | 2.67% | -11.61% | 1.18% |
| 2021 | 7.04% | -7.53% | 28.53% |
| 2003 | 1.88% | -5.53% | 28.50% |
| 1991 | 3.06% | -5.25% | 30.22% |
| 2001 | 1.55% | -2.47% | -12.02% |
| 2014 | 0.76% | -0.56% | 13.51% |
| 2020 | 1.36% | -0.12% | 18.25% |
| 1990 | 6.11% | 0.98% | -3.32% |
| 1987 | 4.43% | 1.65% | 4.71% |
| 2023 | 3.35% | 2.77% | 26.11% |
| 2015 | 0.73% | 3.61% | 1.25% |
| 2009 | 2.72% | 3.82% | 26.49% |
| 1996 | 3.32% | 3.97% | 22.88% |
| 2017 | 2.11% | 4.02% | 21.67% |
| 2018 | 1.91% | 11.25% | -4.52% |
| 1992 | 2.90% | 12.47% | 7.42% |
| 2012 | 1.74% | 13.18% | 15.82% |
| 2019 | 2.29% | 13.87% | 31.33% |
| 1988 | 4.42% | 15.92% | 16.22% |
| 2024 | 2.54% | 16.40% | 19.41% |
| 1999 | 2.68% | 16.98% | 21.07% |
| 2011 | 2.96% | 18.23% | 1.97% |
| 2013 | 1.50% | 18.64% | 32.18% |
| 2004 | 3.26% | 20.34% | 10.74% |
| 2016 | 2.07% | 20.72% | 11.82% |
| 2007 | 4.08% | 22.29% | 5.39% |
| 1998 | 1.61% | 22.54% | 28.62% |
| 2010 | 1.50% | 22.58% | 14.91% |
| 1993 | 2.75% | 22.81% | 9.89% |
| 1986 | 1.10% | 33.70% | 18.06% |
| 2006 | 2.54% | 34.75% | 15.64% |
| 1985 | 3.80% | 40.34% | 31.23% |
| 1995 | 2.54% | 41.36% | 37.45% |
| 1997 | 1.70% | 48.57% | 33.19% |
| 1989 | 4.65% | 62.48% | 31.36% |
| Average | 2.78% | 10.64% | 12.89% |
| Median | 2.61% | 11.86% | 15.73% |
(Source: Portfolio Visualizer)
In seven of the last 39 years, 18% of all years, VZ is down when the S&P is up.
That includes dividends.
That’s the downside of owning individual stocks. You will have to endure periods of market envy and fear of missing out.
Line Item Risk
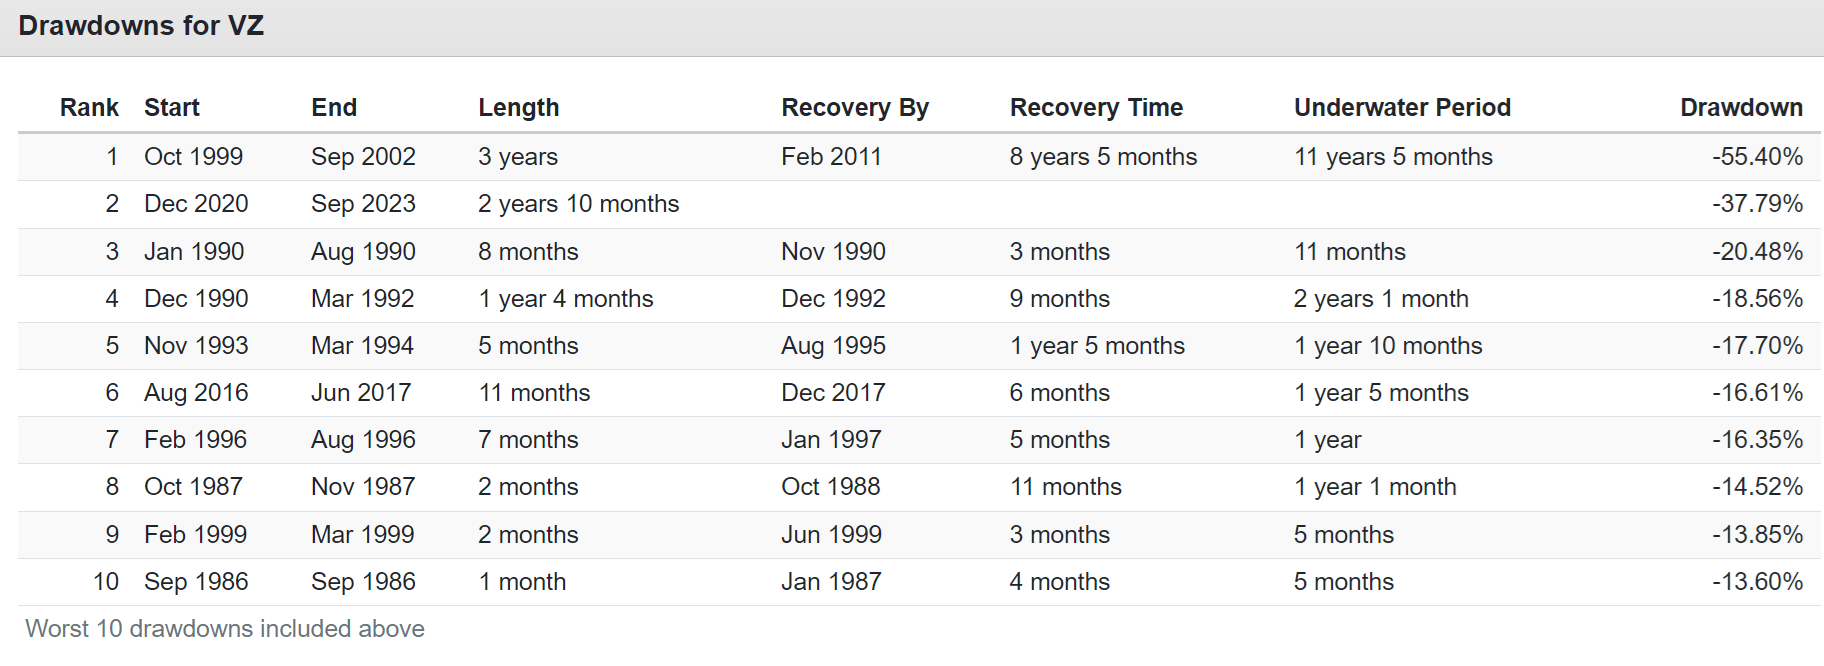
(Source: Portfolio Visualizer)
Line item risk is when your portfolio is doing fine, but you can’t help but be horrified by one ticker or line item.
Verizon has spent as long as 11.5 years underwater and is currently in a three-year bear market.
One occurred while the S&P was turbocharged by big tech.
How many Verizon investors sold at the bottom because they were disgusted by terrible returns and market envy?
How many investors locked in losses and missed out on 40% gains in the last year?
The Downside Of Low Volatility: Verizon’s Annual Returns When The S&P is Positive
| VZ |
Vanguard 500 Index Investor |
||
| Year | Inflation | Return | Return |
| 1995 | 2.54% | 41.36% | 37.45% |
| 1997 | 1.70% | 48.57% | 33.19% |
| 2013 | 1.50% | 18.64% | 32.18% |
| 1989 | 4.65% | 62.48% | 31.36% |
| 2019 | 2.29% | 13.87% | 31.33% |
| 1985 | 3.80% | 40.34% | 31.23% |
| 1991 | 3.06% | -5.25% | 30.22% |
| 1998 | 1.61% | 22.54% | 28.62% |
| 2021 | 7.04% | -7.53% | 28.53% |
| 2003 | 1.88% | -5.53% | 28.50% |
| 2009 | 2.72% | 3.82% | 26.49% |
| 2023 | 3.35% | 2.77% | 26.11% |
| 1996 | 3.32% | 3.97% | 22.88% |
| 2017 | 2.11% | 4.02% | 21.67% |
| 1999 | 2.68% | 16.98% | 21.07% |
| 2024 | 2.54% | 16.40% | 19.41% |
| 2020 | 1.36% | -0.12% | 18.25% |
| 1986 | 1.10% | 33.70% | 18.06% |
| 1988 | 4.42% | 15.92% | 16.22% |
| 2012 | 1.74% | 13.18% | 15.82% |
| 2006 | 2.54% | 34.75% | 15.64% |
| 2010 | 1.50% | 22.58% | 14.91% |
| 2014 | 0.76% | -0.56% | 13.51% |
| 2016 | 2.07% | 20.72% | 11.82% |
| 2004 | 3.26% | 20.34% | 10.74% |
| 1993 | 2.75% | 22.81% | 9.89% |
| 1992 | 2.90% | 12.47% | 7.42% |
| 2007 | 4.08% | 22.29% | 5.39% |
| 2005 | 3.42% | -22.12% | 4.77% |
| 1987 | 4.43% | 1.65% | 4.71% |
| 2011 | 2.96% | 18.23% | 1.97% |
| 2015 | 0.73% | 3.61% | 1.25% |
| 1994 | 2.67% | -11.61% | 1.18% |
| 1990 | 6.11% | 0.98% | -3.32% |
| 2018 | 1.91% | 11.25% | -4.52% |
| 2000 | 3.39% | -16.29% | -9.06% |
| 2001 | 1.55% | -2.47% | -12.02% |
| 2022 | 6.45% | -20.01% | -18.23% |
| 2002 | 2.38% | -15.12% | -22.15% |
| 2008 | 0.09% | -18.02% | -37.02% |
| Average | 10.64% | 12.89% | |
| Median | 11.86% | 15.73% |
(Source: Portfolio Visualizer)
Market envy is what can hurt when the market is up, which is 75% of years.
Bottom Line: Verizon Is A Solid Choice Of Ultra Yield Income Investors… If You Understand Its Limitations
In my almost 10 years as an investment analyst, I’ve seen many articles hype Verizon (and sometimes AT&T (T)) as “cloud computing stocks, 5G stocks, AI stocks, etc.”
While it’s undoubtedly true that Verizon is an industry leader in mobile and will provide much of the US’s 5G and later 6G telecom backbone, let me be very clear.
Verizon is not a growth stock and never will be. It’s a high-yield, relatively lower-volatility blue chip with a business model as exciting as watching paint dry.
That business predictability means incredibly stable free cash flow that allows for a very low-risk dividend, around a 1.25% risk of a dividend cut even in a severe recession.
However, the downside of that business model is that Verizon is expected to grow its dividends slower than inflation over the long term.
The attractive valuation means Verizon might have double-digit solid returns in the coming years. If it becomes fairly valued or overvalued, I would consider trimming or selling outright since, at a fair value of approximately 5% yield and 1% growth, you’re looking at 6% long-term return potential.
In other words, Verizon’s total return potential from fair value is similar to corporate bonds but with higher fundamental risk and much higher volatility.
From today’s 23% historical discount, Verizon might be an attractive “value rotation play.” But I’m content to own my small allocation via ETFs because there are many superior ultra-yield blue-chip options.
Analyst’s Disclosure: I/we have no stock, option or similar derivative position in any of the companies mentioned, and no plans to initiate any such positions within the next 72 hours. I wrote this article myself, and it expresses my own opinions. I am not receiving compensation for it (other than from Seeking Alpha). I have no business relationship with any company whose stock is mentioned in this article.
Seeking Alpha’s Disclosure: Past performance is no guarantee of future results. No recommendation or advice is being given as to whether any investment is suitable for a particular investor. Any views or opinions expressed above may not reflect those of Seeking Alpha as a whole. Seeking Alpha is not a licensed securities dealer, broker or US investment adviser or investment bank. Our analysts are third party authors that include both professional investors and individual investors who may not be licensed or certified by any institute or regulatory body.
—————————————————————————————-

Dividend Kings helps you determine the best safe dividend stocks to buy via our Automated Investment Decision Tool, Zen Research Terminal, Correction Planning Tool, and Daily Blue-Chip Deal Videos.
Membership also includes
-
Access to our 14 model portfolios.
-
My family’s real money $2.5 million.
-
50% discount to iREIT (our REIT-focused sister service)
-
real-time chatroom support
-
real-time email notifications of all my family portfolio buys
-
numerous valuable investing tools
Click here for a two-week free trial, so we can help you achieve better long-term total returns and your financial dreams.