Summary:
- With falling interest rates, T and VZ’s high dividend yields may attract attention, but their heavy debt loads are a concern.
- Lyn Alden cautions that T and VZ could be value traps, with fundamental risks and significant leverage, though Verizon is slightly preferable.
- Our analysis suggests potential upside for both stocks, but T may face more risk, with critical levels to watch for bullish scenarios.
- Elliott Wave Theory, despite its apparent complexity, offers favorable risk-reward opportunities, and our educational resources can help investors master this methodology.
Richard Drury
By Levi at Elliott Wave Trader; Produced with Avi Gilburt
With the possibility of a falling interest rate environment ahead of us, the current dividend yields on these two are going to garner more attention. What are the potential pitfalls here? We will take a look at their financial snapshots with Lyn Alden, as well as listen to her updated commentary. Then, the structure of price on the charts will give its point of view and help with specific levels to watch out for going forward.
Red Flags And Debt Load Show Up
Here is some recent commentary from Lyn Alden regarding this duo:
“I historically have avoided T and VZ, since they offered up a number of red flags for potentially being value traps.
They pay high yields and at many times have had very low valuations, but when the fundamentals aren’t growing significantly or at times are at risk of outright shrinking, those negative forces can override even a seemingly good deal.
FAST Graphs – Lyn Alden YCharts – Lyn Alden FAST Graphs – Lyn Alden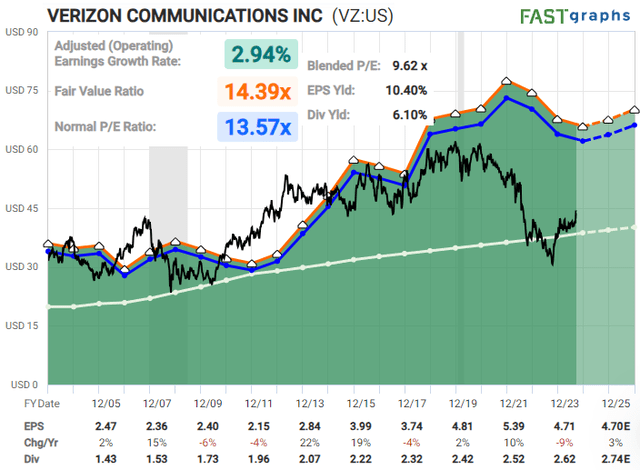
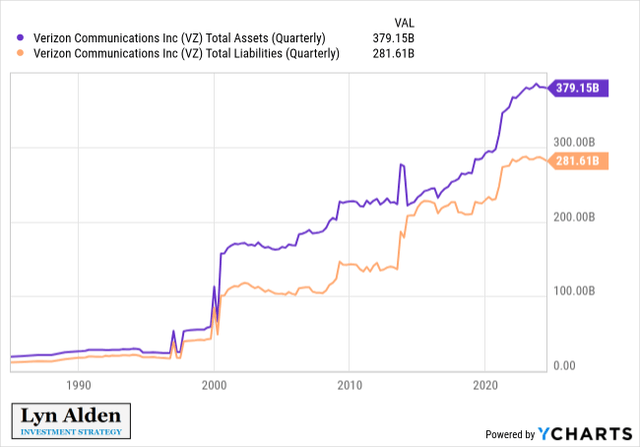
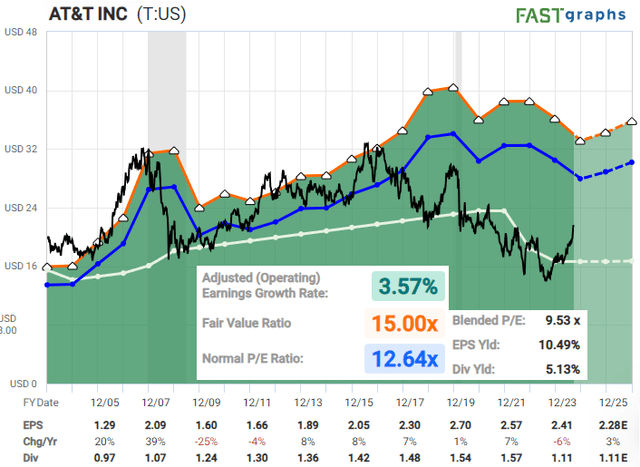
Both companies are asset heavy and have significant leverage on their books, which is a burden in a higher-rate environment. As interest rates moderate over the next year, that should be a decent tailwind for them. Between the two, I’d be a bit more comfortable with Verizon, but from a potential shareholder perspective, I’m not sold on their recently announced deal to acquire Frontier Communications, which will require additional borrowing.” – Lyn Alden
What Does The Structure Of Price Tell Us?
A salient detail here is that both of our lead analysts are showing likely upside ahead for (NYSE:VZ) and (T). Note the charts below:
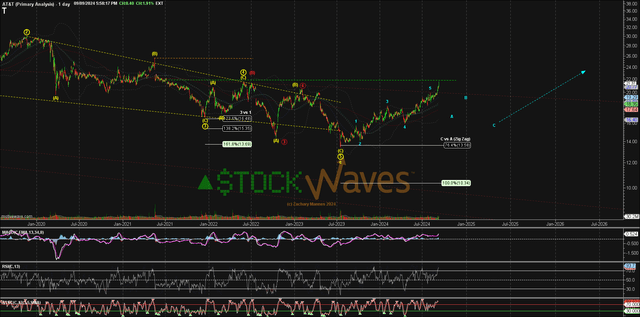
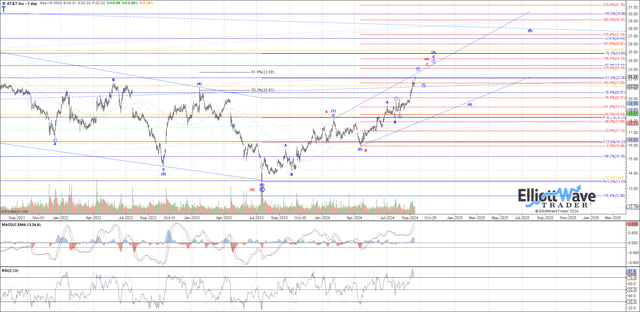
Chart by Garrett Patten – StockWaves Chart by Zac Mannes – StockWaves Chart by Garrett Patten – StockWaves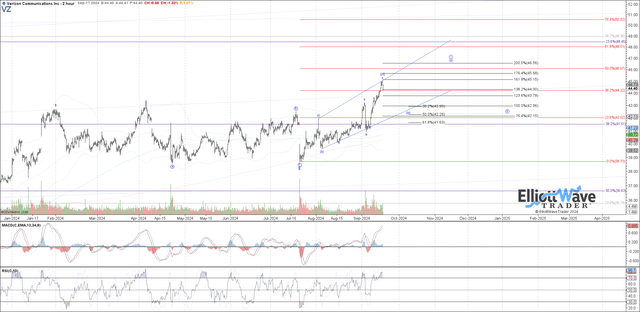
Let’s focus on the (VZ) chart first. Take note that the consolidation in the first half of this year appears to have been a wave 2 corrective move. Price is now filling out the next lesser degree wave circle ‘i’ as shown. Some may choose to accumulate shares in this region as ‘i’ fills out and then ‘ii’ consolidates those gains. For as long as price remains at the 38 to 40 level or higher, then we would maintain this bullish outlook.
The upside would next see resistance in the 47 to 49 area.
As far as the (T) chart, you can see from Garrett’s illustrated path that there is some risk the next high could be the Red wave [4]. That would suppose a lower low yet to come. We would know much more once that area is tested and then the initial structure of price in the next pullback. Should price form 5 waves down from the next high, it would be a cautionary sign to longs.
Why can we say this? It’s because of the larger structure that has played out on the (T) chart. Should we see a termination of the rally at the next high, then it would suggest that the move up from lows struck in the Summer of 2023 is corrective. The main point behind this thesis would be 3 waves up and into resistance followed by 5 waves down from the 23 to 24 zone just overhead.
So while we see a bullish scenario on each chart, it is plausible that they may diverge sometime in the future, with (VZ) taking the lead over (T).
Why Don’t More People Use Elliott Wave Analysis?
Have you ever asked this? Avi Gilburt penned a response to this very topic. Here is a brief excerpt from that article (this piece is available in its entirety in our Education section).
First, many may not know this, but there are quite a few ‘name’ investors who do use Elliott Wave analysis in their decision-making. One of the most popular is Paul Tudor Jones of Tudor Investment Corporation. Jones was quoted as saying:
“I attribute a lot of my success to Elliot Wave Theory. It allows one to create incredibly favorable risk reward opportunities.”
“Let’s start with the understanding that it takes a lot of detailed work and calculation in order to perform a proper Elliott Wave analysis. Moreover, it is a very complicated method to learn. So, the entry into this methodology is not easy and to perform a proper analysis is not easy. But, then, show me anything that is truly worthwhile that does not require an initial investment and hard work.
To this end, most of what I see being claimed as Elliott Wave analysis is nothing more than what I call ‘wave slapping.’ This is when an analyst places numbers and letters on a chart based either upon the ‘look’ of the chart, or to support their prior bias about market direction. Since I would classify most analysis presented as Elliott Wave analysis as such, resultantly, most analysis is rarely correct more than 50% of the time. And, this lends to the argument about Elliott Wave being too subjective in nature.
So, when investors follow this type of ‘analysis’ and see how often it is wrong, they make the assumption that Elliott Wave really does not work, and are turned off.”
Conclusion
In addition to the articles provided to the readership here, we have an extensive Education library available at Elliott Wave Trader. As well, we want to teach others this methodology. Three times a week, we have beginner and intermediate-level videos where we show the exact way we count the waves and give in-depth analysis techniques. This methodology, if you give it the chance, will change the way you invest forever. More on that can be found here.
There are many ways to analyze and track stocks and the market they form. Some are more consistent than others. For us, this method has proved the most reliable and keeps us on the right side of the trade much more often than not. Nothing is perfect in this world, but for those looking to open their eyes to a new universe of trading and investing, why not consider studying this further? It may just be one of the most illuminating projects you undertake.
(Housekeeping Matters)
If you would like notifications as to when our new articles are published, please hit the button at the bottom of the page to “Follow” us.
Analyst’s Disclosure: I/we have no stock, option or similar derivative position in any of the companies mentioned, but may initiate a beneficial Long position through a purchase of the stock, or the purchase of call options or similar derivatives in VZ over the next 72 hours. I wrote this article myself, and it expresses my own opinions. I am not receiving compensation for it. I have no business relationship with any company whose stock is mentioned in this article.
Seeking Alpha’s Disclosure: Past performance is no guarantee of future results. No recommendation or advice is being given as to whether any investment is suitable for a particular investor. Any views or opinions expressed above may not reflect those of Seeking Alpha as a whole. Seeking Alpha is not a licensed securities dealer, broker or US investment adviser or investment bank. Our analysts are third party authors that include both professional investors and individual investors who may not be licensed or certified by any institute or regulatory body.
STOCK WAVES: Where fundamental analysis meets technical analysis for highest-probability investment opportunities! Get leading Elliott Wave analysis from our team, along with fundamental insights and macro analysis from top author Lyn Alden Schwartzer.
“Stockwaves is my bread and butter, and that’s only catching maybe 10% of the charts they throw out! I had 7-10x+ trades with SW last year, and dozens more that were “slackers” (LOL) with “only” 3-4-5x returns. Amazing!” (Nicole)
Click here for a FREE TRIAL.
