Summary:
- The bond market is certain that a recession is coming in 2023 and 85% of economists and CEOs agree.
- Historically the S&P should fall about 20% from here, making for a volatile and frightening few months for investors.
- Low-volatility high-yield telecoms like Verizon and AT&T are a solid choice for such likely market environments. One of these two averages 9% declines in every bear market since 1985.
- One of these defensive high yielders offers a superior yield, a much safer dividend, a better balance sheet, and a slightly faster growth rate.
- One is more undervalued and could potentially benefit investors in five years. One is a far better recession buy, that can help you sleep-well-at-night no matter what’s coming next for the stock market.

Kativ
This article was published on Dividend Kings on Jan. 18, 2023.
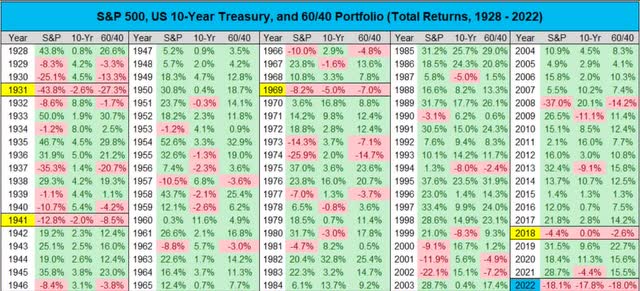
2022 was a crazy year for markets. Not because the S&P fell 18% but because the stock and bond market fell double digits simultaneously for the first time in history.
Charlie Bilello
There’s good and bad news for those hoping 2023 will be a kinder year for our portfolios.
The good news is that inflation is rapidly declining, and the Fed is almost done hiking rates.
The bad news? There’s a lot of it.
- The Fed has said it plans to hold rates high potentially until October 2024
- inflation could potentially go back up if oil prices soar because of China’s reopening
- The fed might have to keep hiking far higher than the bond market is pricing in
- potentially to 6% (UBS) or even higher (Jamie Dimon, CEO of JPMorgan)
And, of course, we can’t forget that we’re likely barreling toward recession in a few months.
DK Research Terminal, CNBC
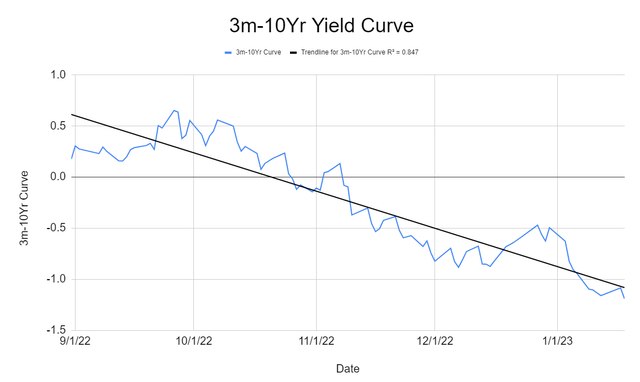
The 3m-10yr yield curve is the best recession forecasting tool in history, according to studies from the NY, Dallas, Chicago, and San Francisco Feds.
Since the 1950s, anytime it’s become inverted (gone negative), a recession has always followed within two years.
What does a -1.19% yield curve inversion mean?
- the most inverted in 40 years
- the bond market is estimating a 100% probability of a recession by May 2023
This dire assessment agrees with the consensus of CEOs and economists.
- According to Bloomberg’s survey, 85% of CEOs expect a mild recession in 2023
- According to the Wall Street Journal, 85% of economists expect a recession in 2023
S&P 500 Bear Market Bottom Scenarios
| Earnings Decline In 2023 | 2023 S&P Earnings | X 25-Year Average PE Of 16.8 | Decline From Current Level |
| 0% | $217.84 | $3,666.25 | 8.1% |
| 5% | $206.95 | $3,482.93 | 12.7% |
| 10% | $196.06 | $3,299.62 | 17.3% |
| 13% (average, median since WWII) | $189.52 | $3,189.64 | 20.1% |
| 15% | $185.16 | $3,116.31 | 21.9% |
| 20% | $174.27 | $2,933.00 | 26.5% |
(Source: DK S&P 500 Valuation Tool, Bloomberg Consensus)
The historically average recession brings with it a 13% earnings decline which would imply a 20% further decline in stocks.
- Bloomberg’s blue-chip consensus expects a 3,000 to 3,400 S&P bottom between Q1 and Q3 2023
In other words, 2023 MIGHT be another terrible year for stocks, at least until the bear market finally bottoms.
But that doesn’t necessarily mean it will be. Wall Street doesn’t run on certainties, only probability curves.
Ritholtz Wealth Management
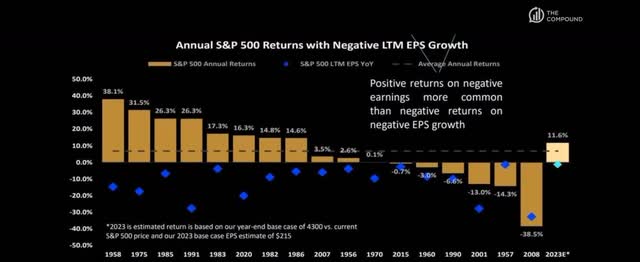
In fact, stocks have actually gone up in 11 of the 17 years since WWII, with negative earnings growth.
The main purpose of Wall Street is to make fools of as many men as possible.” – Bernard Baruch
In other words, stocks might crash from here…or merely trade sideways and possibly shock most of Wall Street and go up.
So what’s a smart investor like you to do when the stock market’s potential returns for 2023 range from -25% to +25%?
Short-Term Prices Are Vanity, Cash Flow Is Sanity, And Safe Dividends Are Reality
I can’t tell you what the stock market will do in the next week, month, or even in 2023; no one can. For every bearish argument, you can find an equally plausible bullish one.
But guess what? What happens to the economy in 2023 or even 2024 won’t matter in the long term.
Nick Maggiulli
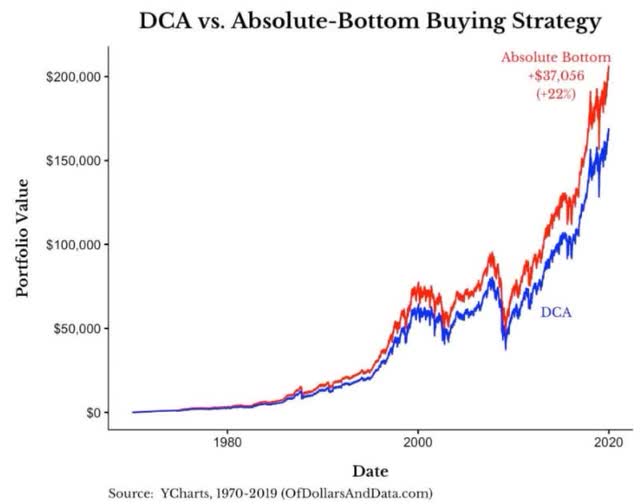
Perfect market timing is impossible, but even if you had the God-like power to only buy on the lowest day of the year, it would hardly make a difference.
In fact, over 40 years, from 1970 to 2019, perfect market timing delivered 22% better returns than buying on the first day of the year.
Not 22% per year, but 22% over 40 years, or 0.5% better annual returns.
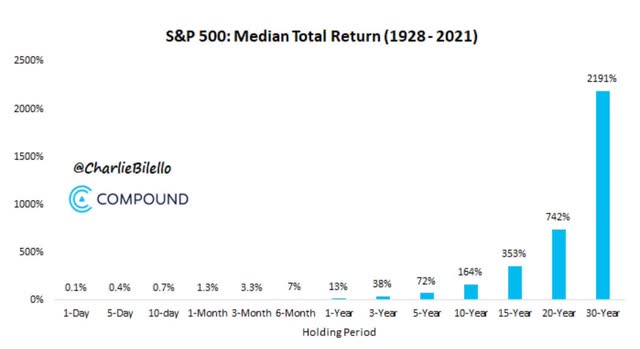
Charlie Bilello
Since 1928 the median 30-year S&P return is 2200%, a 23X return.
That’s the standard retirement time frame, which is important for everyone under and including the age of 70.
- The Social Security Administration estimates a 10% chance that the average retired couple will live to 100
In other words, if you buy blue-chip stocks over 30 years, you can reasonably expect a 2200% return.
If you perfectly time the market, you can expect... about 2216% returns.
Instead of turning $1 into $23, you’d turn it into $23.16… if you had the ability to nail the bottom every year for three decades.
Are you willing to risk $23 in profit per $1 invested to make an extra $0.16?
For every $1 in extra profit, perfect market timing could achieve you risk not making $144.
For context, the casino edge in Blackjack is 2%.
- a reward-to-risk ratio of 0.92
The reward-to-risk ratio for market timing? 0.007
Or, to put it another way, you’re 131X more likely to retire rich from BlackJack than from market timing.
High-Yield Dividend Blue-Chips Are A Great Way To Stay Sane And Safe In Recessions
What’s the easiest way to sleep well at night during a recession where stocks could fall as much as 27% (from here)?
How about earning a very safe 4% to 9% yield that grows in all economic and market conditions?
Imagine a portfolio that yields a safe 6% to 7% (I’ve built several in recent months). Imagine using a 3% to 5% annual withdrawal rule for retirement.
Guess what the after-tax yield is on a 6% blue-chip portfolio? 5.1%.
So how much should you care about stock prices if you can safely live 100% on dividends alone? Zero.
The only thing that matters is the safety of those dividends, which is a function of cash flow, balance sheet, and management long-term risk management skill.
A diversified high-yield blue-chip portfolio is the ultimate financial freedom because it doesn’t rely on capital gains to maintain your standard of living.
But guess what? Dividend growth blue-chips tend to be lower volatility, which helps most people stay calm and avoid costly mistakes like panic selling during bear markets.
Dividend Growth Blue-Chips Vs. S&P Since 2006

Portfolio Visualizer Premium
How would you like to match or beat the market with lower volatility even during the 2nd worst market crash in US history?
And guess what? Recession-resistant high-yield blue-chips like Verizon (NYSE:VZ) and AT&T (NYSE:T) allow retirees to sleep even sounder at night.
Several DK members have asked me for an update on these two telecom giants, specifically focusing on which one is the better recession buy.
So let’s look at the three criteria high-yield income investors should consider with defensive dividend blue-chips.
Historical Volatility During Bear Markets: Winner Verizon
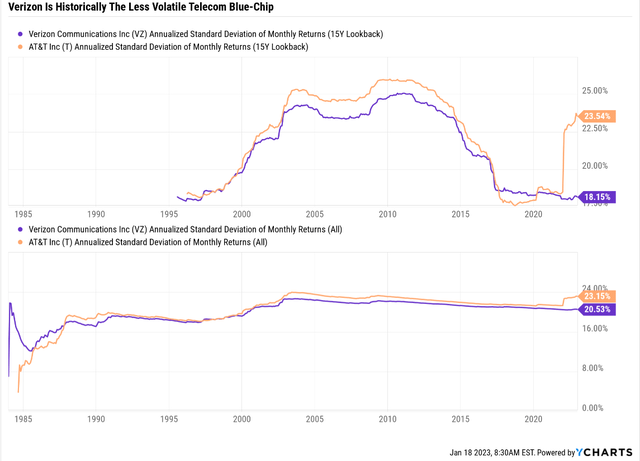
Ycharts
For context, the average annual volatility for standalone companies is 28%, and for dividend aristocrats, 25%.
- in any given year, a stock can fall 28% and an aristocrat 25%
- even if the investment thesis remains intact
Verizon’s average annual volatility over the last 15 years is 18% compared to 24% for AT&T.
OK, but that’s just average volatility over 15 years. What about during bear markets?
Verizon & AT&T During Every Bear Market Since 1985
| Bear Market | VZ | AT&T | 60/40 | S&P |
| 2022 Stagflation | -20% | 7% | -21% | -28% |
| Pandemic Crash | -12% | -24% | -13% | -34% |
| 2018 | 7% | -14% | -9% | -21% |
| 2011 | -1% | -7% | -16% | -22% |
| Great Recession | -34% | -39% | -44% | -58% |
| Tech Crash | -52% | -64% | -22% | -50% |
| July 1998 to October 1998 | -3% | -7% | -10% | -22% |
| 1990 Recession (May To October) | 3% | -4% | NA | -20% |
| 1987 Black Monday Period | -15% | -23% | NA | -36% |
| Average | -14% | -19% | -19% | -32% |
| Average Peak Decline Vs. S&P 500 | -56% | -40% | -40% | NA |
| Median | -12% | -14% | -16% | -28% |
| Median Peak Decline Vs. S&P 500 | -57% | -50% | -43% | NA |
(Sources: Portfolio Visualizer Premium, Charlie Bilello)
AT&T averages a 19% decline during bear markets, matching that of a 60/40 and 40% less than the S&P.
But Verizon averages a 14% decline, 56% less than the S&P.
The median decline for AT&T is 14%, 50% less than the S&P.
The median decline for Verizon is 12%, 57% less than the S&P.
What does this mean for investors in these stocks? That if the S&P falls the historical 20% from here:
- AT&T would historically fall 10% to 12%
- Verizon would historically fall 9%
So on a purely defensive/low volatility basis, Verizon is the superior company.
But it’s also the better choice regarding what income investors care about most, dividends safety.
Dividend Safety: Verizon Is The Better Choice
Let’s consider three important components of dividend safety.
First, there’s the dividend track record. Ben Graham considered this an important quality metric.
- 20+ years without a dividend cut = a sign of quality
- 20+ year dividend growth streak = a sign of excellence
AT&T was a dividend aristocrat that cut its dividend in 2022 as part of the spin-off of Warner Media.
- a disastrous $85 billion debt-funded deal that turned out to be a mistake
AT&T was formerly led by Randal Stephenson, who loved big, splashy, and debt-funded deals.
He bought DirectTV even after cord cutting was going to reduce its cash flows in the future. He paid $49 billion for that deal, and then doubled the size of his next expire building mistake.
The theory behind Time Warner was also disastrous.
Time Warner owned HBO and some of the best content in the world.
AT&T thought it could become a dominant name in streaming, going toe to toe with the likes of Netflix (NFLX) and Disney (DIS).
Of course, it now turns out that streaming is a pretty lousy business, requiring massive subscriber bases in the hundreds of millions just to turn a profit.
AT&T’s new CEO, John Stankey, decided to merge Warner with Discovery to create Warner Bros. Discovery (WBD), and offload as much debt as possible onto it.
The result was a 54% dividend hike, and shareholders were given shares of WBD, which isn’t expected to pay a dividend for the foreseeable future.
Warner Bros.’ Balance Sheet Looks Terrible
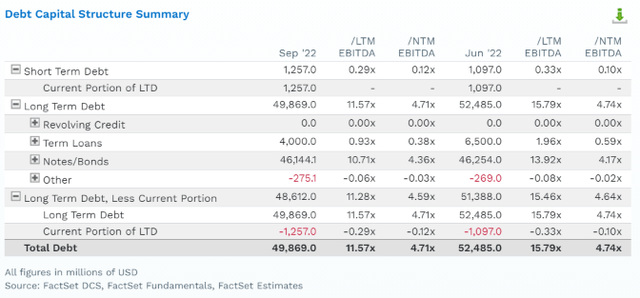
FactSet Research Terminal
WBD is in the process of slashing costs, including canceling many popular TV shows and even movies that were already almost complete.
And yet its $50 billion debt inheritance from AT&T means it’s expected to have a leverage ratio of almost 5X in 2023.
- 3X or less is considered safe for this industry according to rating agencies
- Fitch rates WBD BBB- stable
- the lowest level of investment-grade bonds
- 11% 30-year default risk
WBD isn’t expected to turn a profit until 2024.
Needless to say, I wouldn’t recommend anyone buy this 2nd tier media company.
What about Verizon’s dividend track record?
- 16-year dividend growth streak
- 38 years without a cut (since they began paying one)
VZ is a high-yield future aristocrat retirees can trust.
How can we tell? Because of the 2nd important dividend safety factor.
Balance Sheet Strength: Winner Verizon
Let’s start with credit ratings.
Verizon Credit Ratings
| Rating Agency | Credit Rating | 30-Year Default/Bankruptcy Risk | Chance of Losing 100% Of Your Investment 1 In |
| S&P | BBB+ Stable Outlook | 5.00% | 20.0 |
| Fitch | A- Stable Outlook | 2.50% | 40.0 |
| Moody’s | Baa1 (BBB+ Equivalent) Stable Outlook | 5.00% | 20.0 |
| Consensus | BBB+ Stable Outlook | 4.2% | 24.0 |
(Sources: S&P, Fitch, Moody’s)
The rating agency consensus is that Verizon has a 4.2% chance of going bankrupt in the next 30 years, a 1 in 24 fundamental risks for stock investors.
- Fundamental risk is the risk of a 100% loss due to the company going bankrupt
AT&T Credit Ratings
| Rating Agency | Credit Rating | 30-Year Default/Bankruptcy Risk | Chance of Losing 100% Of Your Investment 1 In |
| S&P | BBB Stable Outlook | 7.50% | 13.3 |
| Fitch | BBB+ Stable Outlook | 5.00% | 20.0 |
| Moody’s | Baa2 (BBB Equivalent) Stable Outlook | 7.50% | 13.3 |
| Consensus | BBB Stable Outlook | 6.7% | 15.0 |
(Sources: S&P, Fitch, Moody’s)
AT&T’s fundamental risk consensus is 6.7%, about 50% higher than Verizon’s, with a 1 in 15 chance that anyone buying AT&T will lose everything in the next 30 years.
Why does Verizon have a superior balance sheet?
There are two big reasons: debt ratios and cash flow.
AT&T Capital Structure
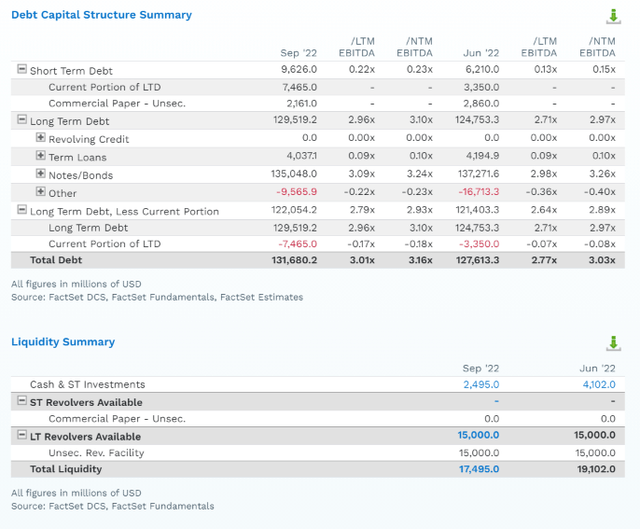
FactSet Research Terminal
For telecom utilities like this, rating agencies like to see 3.5X net debt/EBITDA and AT&T’s leverage ratio is 3.0X, with a slight increase expected in 2023 to 3.2%.
Its net debt/EBITDA is 3.5X, at the border of investment-grade safety.
AT&T’s interest coverage ratio is 3.7X, while rating agencies like to see 4+.
FactSet Research Terminal
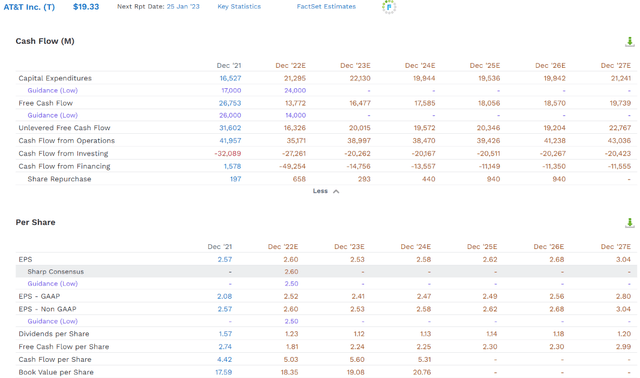
AT&T’s spending on its 5G network is expected to run around $20 billion annually through 2027.
- at which point it will begin preparing for 6G
- 6G is expected to launch in 2030
Fortunately, its free cash flow is expected to grow from $14 billion to $20 billion in the next five years.
This is why rating agencies aren’t too worried about AT&T’s ability to service its debt.
AT&T’s $20 billion in FCF in 2027 is still almost $7 billion less than in 2021, thanks to the WBD spinoff.
Without the spinoff, AT&T would have a record of $27 billion in 2027 consensus-free cash flow.
What about the long-term outlook for AT&T’s balance sheet?
- 2027 consensus debt/EBITDA: 2.7 vs. 3.5 safe
- 2027 consensus net debt/EBITDA: 1.8 vs. 3.5 safe
- 2027 consensus interest coverage ratio: 4.3 vs. 4.0+ safe
So AT&T’s outlook, at least for its balance sheet, is looking positive, though the dividend isn’t expected to grow for several years and at a 1.7% annual rate through 2027.
What about Verizon?
FactSet Research Terminal
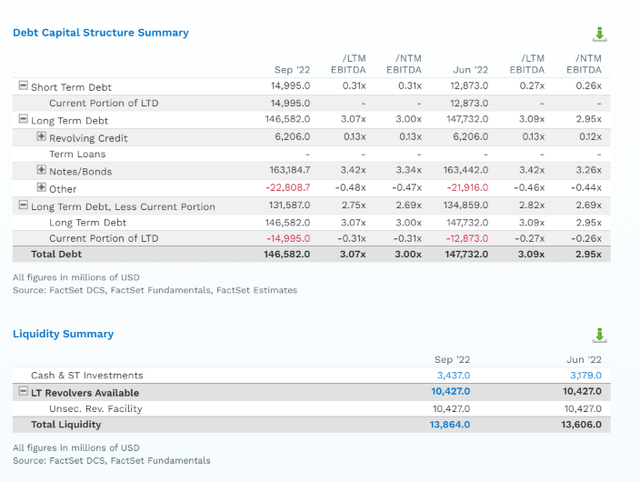
Verizon has slightly lower leverage than AT&T.
- 2027 consensus debt/EBITDA: 2.70
- 2027 consensus net debt/EBITDA: 2.30
AT&T is expected to eventually have lower leverage than Verizon, but Big Red is slightly safer now.
Verizon Free Cash Flow And Dividend Consensus Forecast
FactSet Research Terminal
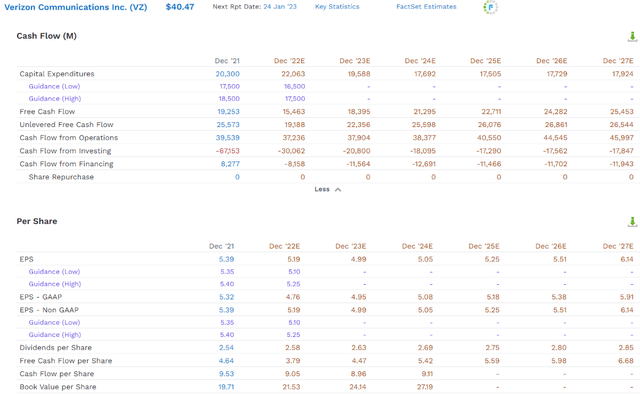
Verizon’s spending on 5G is expected to drop significantly, resulting in free cash flow growth from $15 billion to $26 billion over the next five years.
- 11% annually
The dividend is expected to grow slightly faster than AT&T’s, 2.0% annually, with Verizon achieving a 21-year dividend growth streak in 2027.
- In 2031 it becomes an aristocrat
Payout Ratio: Winner AT&T By A Hair
Due to the very stable nature of telecom cash flows, 70% is a safe FCF payout ratio, according to rating agencies.
- VZ has a 59% FCF payout ratio consensus for 2023
- AT&T has a 50% FCF payout ratio consensus for 2023
However, Verizon’s free cash flow growth rate of 11% vs. a 2% dividend growth rate is expected to result in VZ’s FCF payout ratio falling to a very safe 42% in 2027.
- AT&T’s 2027 FCF payout ratio consensus is 40%, slightly below that of VZ
- purely because it slashed its dividend 54% when there was no need to
OK, so on every dividend safety metric other than FCF payout ratio, which AT&T wins by a hair due to a massive dividend cut, Verizon is the superior choice.
But there’s more to a good investment than just dividend safety and low volatility.
| Investment Strategy | Yield | LT Consensus Growth | LT Consensus Total Return Potential | Long-Term Risk-Adjusted Expected Return |
| Verizon | 6.4% | 3.4% | 9.8% | 6.9% |
| AT&T | 5.8% | 3.2% | 9.0% | 6.3% |
| REITs | 3.9% | 6.1% | 10.0% | 7.0% |
| Schwab US Dividend Equity ETF | 3.4% | 7.6% | 11.0% | 7.7% |
| 60/40 Retirement Portfolio | 2.1% | 5.1% | 7.2% | 5.0% |
| Vanguard Dividend Appreciation ETF | 1.9% | 10.2% | 12.1% | 8.5% |
| Dividend Aristocrats | 1.9% | 8.5% | 10.4% | 7.3% |
| S&P 500 | 1.7% | 8.5% | 10.2% | 7.1% |
| Nasdaq | 0.8% | 10.9% | 11.7% | 8.2% |
(Sources: DK Research Terminal, FactSet, Morningstar, Ycharts)
Verizon’s growth prospects are slightly better than AT&T’s, and its yield is 0.6% higher.
- the last time Verizon’s’ yield was this high was in the depths of the Great Recession
- the highest yield in 14 years
Neither Verizon nor AT&T are expected to beat the S&P, but defensive high-yield blue-chips like these do their job if they deliver 8% or better returns.
How realistic are 9% to 10% returns for AT&T and Verizon?
Total Returns Since 1985

Portfolio Visualizer Premium
That is pretty realistic, given that both have been delivering such returns for the last 38 years.

Portfolio Visualizer Premium
Both have delivered 10% to 11% annual rolling returns for the last four decades, and that’s pretty much what long-term investors can expect from here.
Valuation And Short-Term Return Potential: AT&T Wins
Verizon Fair Value: $60
Current Price: $40
Discount: 32%
DK Rating: Potentially Very Strong Buy
Verizon is a bargain, just 8% below its table-pounding buy price.
AT&T Fair Value: $39
Current Price: $19
Discount: 51%
DK Rating: Potentially Speculative Strong Buy
AT&T is slightly undervalued than Verizon, though a speculative company with a far less dependable and less attractive dividend.
Verizon 2025 Consensus Total Return Potential
(Source: FAST Graphs, FactSet)
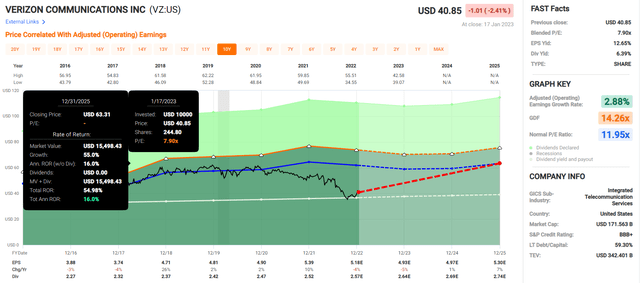
VZ has the potential for 55% total returns within three years or 16% annually.
- about 2X the S&P consensus
Verizon 2028 Consensus Total Return Potential
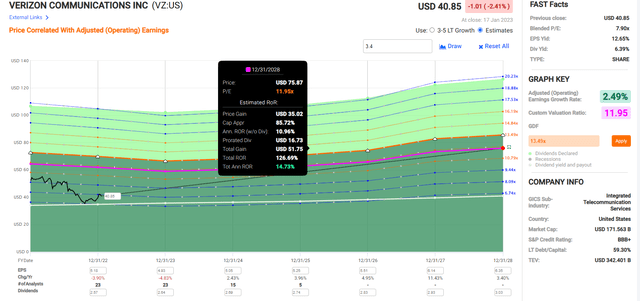
(Source: FAST Graphs, FactSet)
If VZ grows as expected, it could deliver 126% returns or 15% annually over the next five years.
- 2.5X more than the S&P 500 consensus
AT&T 2025 Consensus Total Return Potential
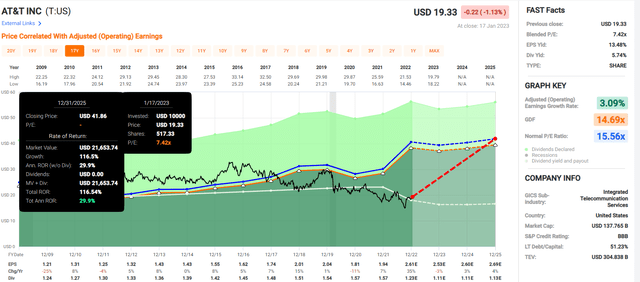
(Source: FAST Graphs, FactSet)
AT&T has the potential to deliver 30% annual returns over the next three years, more than doubling.
AT&T 2028 Consensus Total Return Potential
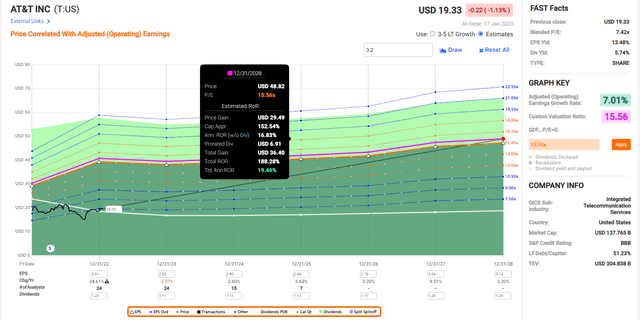
(Source: FAST Graphs, FactSet)
If AT&T grows as expected and returns to historical fair value, it could nearly triple, delivering 20% annual returns.
- about 4X the consensus return potential of the S&P 500
Bottom Line: Both Verizon And AT&T Are Screaming Bargains, But Verizon Is The Better Recession Buy
Let me be clear: I’m not calling the bottom in either VZ or AT&T (I’m not a market timer).
Super SWAN quality (for VZ) does NOT mean “can’t fall hard and fast in a bear market.”
Fundamentals are all that determine safety and quality, and my recommendations.
- over 30+ years, 97% of stock returns are a function of pure fundamentals, not luck
- in the short term; luck is 25X as powerful as fundamentals
- in the long term, fundamentals are 33X as powerful as luck
While I can’t predict the market in the short term, here’s what I can tell you about VZ and AT&T.
Both are trading at some of their lowest valuations in history.
- Verizon’s yield is the highest in 14 years
- it’s 32% historically undervalued
AT&T is about 50% undervalued, though a much lower-quality company.
In terms of which is the better recession buy? The answer is clear.
Verizon offers a superior balance sheet, and stronger credit rating and hasn’t cut its dividend in 38 years. AT&T cut its dividend just last year. And while its 50% payout ratio means it’s not likely to do so in a recession, Verizon’s 6.4% yield is superior to AT&T’s, much safer, and its dividend is expected to grow slightly faster and much more consistently.
Verizon is a future dividend aristocrat, and AT&T is a failed aristocrat who chose to cut its dividend even though it could have kept paying it safely.
In a recession, with the stock market potentially set for a 20% correction from here, Verizon is likely to fall around 9%, while AT&T should decline about 12%.
Both are solid deep-value defensive choices, but I always recommend favoring safety and quality first over pure valuation, especially when you can lock in a very safe 6.4% yield and around 10% long-term return potential on a Super SWAN that averages 12% to 14% declines in bear markets.
Disclosure: I/we have no stock, option or similar derivative position in any of the companies mentioned, and no plans to initiate any such positions within the next 72 hours. I wrote this article myself, and it expresses my own opinions. I am not receiving compensation for it (other than from Seeking Alpha). I have no business relationship with any company whose stock is mentioned in this article.
Additional disclosure: Dividend Kings owns VZ in our portfolios.
—————————————————————————————-

Dividend Kings helps you determine the best safe dividend stocks to buy via our Automated Investment Decision Tool, Zen Research Terminal, Correction Planning Tool, and Daily Blue-Chip Deal Videos.
Membership also includes
-
Access to our 10 model portfolios (all of which are beating the market in this correction)
-
my correction watchlist
-
50% discount to iREIT (our REIT-focused sister service)
-
real-time chatroom support
-
real-time email notifications of all my retirement portfolio buys
-
numerous valuable investing tools
Click here for a two-week free trial, so we can help you achieve better long-term total returns and your financial dreams.
