Summary:
- Verizon stock has shown 20% YTD total returns, compared to 28% total returns by the broader S&P 500 and 50% by AT&T.
- The Frontier deal will add to the massive debt load of the company and add to future uncertainty.
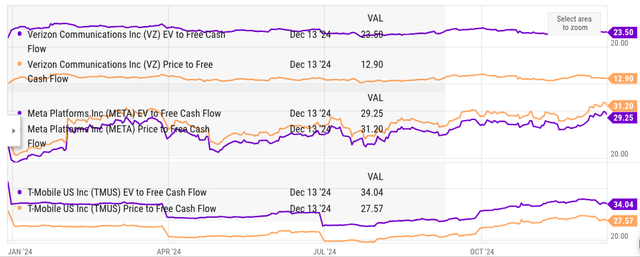
- The EV to FCF ratio of Verizon is not very attractive when compared to T-Mobile and even bigger tech companies like Meta.
- It is difficult to see Verizon stock beating the broader index in the near term, as the company has few growth levers.
JHVEPhoto
Verizon Communications (NYSE:VZ) stock has stagnated since January of this year. There were bullish estimates at the end of last year, but most of the hopes have evaporated over the last few quarters. Even AT&T (T) has been able to deliver better momentum. Verizon’s 20% total return in YTD pales in front of the 28% total returns by S&P 500 and AT&T’s 50% total return. In the previous article, it was mentioned that Verizon would continue to underperform the market as the earnings are not strong enough to change the sentiment.
The recent announcement of a deal with Frontier Communications is also a major headwind. It will add to the already massive debt load of over $140 billion and will divert management’s focus for the next 12-18 months. This deal will complement Verizon’s own fiber network, but Wall Street is more interested in a debt reduction roadmap instead of betting on new acquisitions to drive growth. The EPS estimate for the fiscal year ending 2025 is $4.71 which gives the stock forward PE ratio of 9.38. This is 20% lower than the 10-year median of 12.5, but the higher debt load will continue to be a major headwind for the stock, making further bullish momentum difficult.
Curb your enthusiasm
Last year, the main argument against Verizon stock was the massive debt load. Better macroeconomic data and fed rate cuts have helped in improving the sentiment towards Verizon stock. However, this has not resulted in sustainable bullish momentum similar to AT&T. Verizon’s YTD performance has fallen behind the broader S&P 500 and is far behind AT&T.
Seeking Alpha
Figure: Ratings for Verizon stock over the last 90 days. Source: Seeking Alpha
The debt load has not vanished, and the company has been able to show positive free cash flow growth in the first nine months by reducing the capex. In the first nine months of 2023, Verizon had capital expenditure of $14.2 billion. In the first nine months of 2024, capital expenditure has declined by 15% or $2.2 billion, which helped increase the free cash flow to $14.5 billion, slightly below the $14.6 billion reported a year ago.
Verizon Filings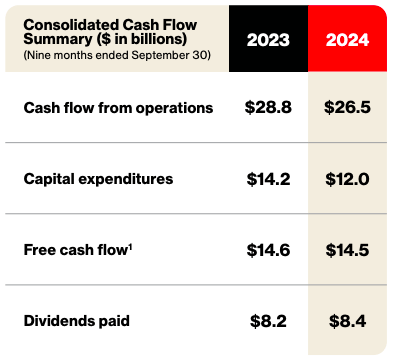
Figure: Improvement in free cash flow by reduction in capex. Source: Verizon Filings
The management has a lot of flexibility in terms of capital expenditure, and we should not take a dip in a few quarters as a big positive signal.
Frontier deal shows possible pitfalls
In the past few years, Verizon has tried to boost its performance by different acquisitions. The recent announcement of a deal to buy Frontier Communications is another effort by the management to ramp up its growth. However, there are a number of pitfalls in this deal. Verizon would be paying a relatively high price for Frontier, which reduces some of the positives spoken about this deal. The complementary fiber network of Frontier is a positive, but the FTC approval of the deal is not guaranteed. If we add this $20 billion to the already massive debt load, the total comes to over $165 billion. At the current point, it is highly likely that the market will be focused on debt-reduction instead of looking at the possible cost-savings through synergies.
Verizon Filings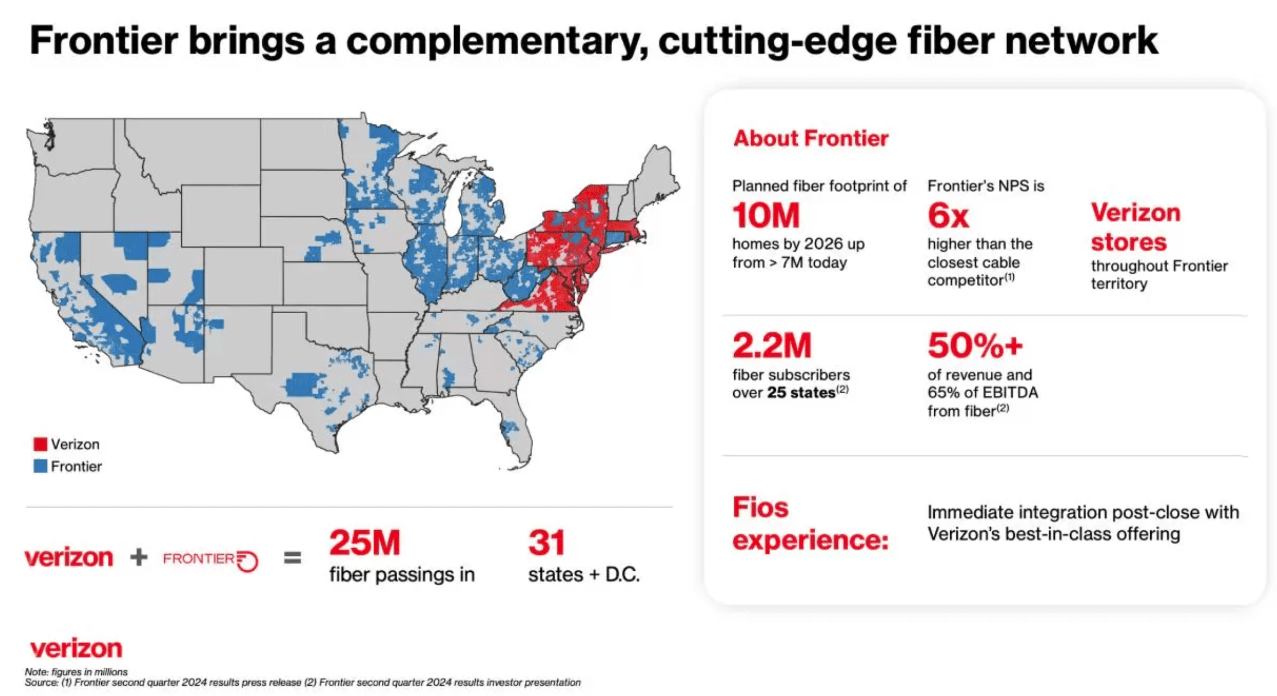
Figure: Complementary fiber network of Frontier. Source: Verizon Filings
Verizon continues to announce dividend hikes to maintain its attraction to income investors. But it also limits the ability of the management to increase the pace of debt reduction. Many analysts have mentioned that the dividends are easily covered by free cash flow and should not be a problem for the company. Verizon pays close to $11 billion in dividends and has earned an average of $14 billion in free cash flow in the trailing twelve months. This makes the dividend payout equal to 78% of the free cash flow. There is very less wiggle room with the management when it needs to allocate a big amount towards dividends.
Figure: Impact of higher debt load on Verizon’s multiple. Source: YCharts
We can clearly see the impact of the higher debt pile on Verizon’s EV to FCF ratio. Verizon’s EV to FCF ratio is only 30% lower than that of rival T-Mobile (TMUS) which has a higher growth trajectory. Even compared with big tech Meta (META), Verizon’s EV to FCF is only 20% lower than Meta. Hence, it is not ideal to look solely on the P/E multiples of Verizon, as it can give a very distorted picture.
Over the past few months, the negative sentiment due to the Verizon’s debt load has reduced. However, it takes only one quarter of higher capex because of which Verizon’s FCF drops below the dividend payout. At this point, we could again see bearish calls against Verizon stock.
Debt reduction projections
Verizon has been making efforts to reduce its debt pile. One of the biggest moves recently was the $3.3 billion deal with Vertical Bridge, where Verizon sold a bunch of towers and then leased them back. This is a trend among telecom operators worldwide who want to bring better financial flexibility to their balance sheets. Verizon has set a long-term target to reduce its debt-to-EBITDA ratio to a range of 1.75 to 2.0. However, this might be difficult to achieve if the current Frontier deal goes ahead. The management has mentioned that they expect the Frontier deal to add 0.2 to 0.3 times to their debt-to-EBITDA ratio.
Verizon has the option to make similar tower deals to bring in cash, but the positive impact would be small compared to the massive debt pile of Verizon. Verizon is still ahead of AT&T in terms of its leverage ratio. However, Verizon has seen a bigger increase in its debt pile over the last few years. The wiggle room available with the management is quite less, and this can hurt the company if there is a higher need for capex or some other challenge.
Risks to the bearish thesis
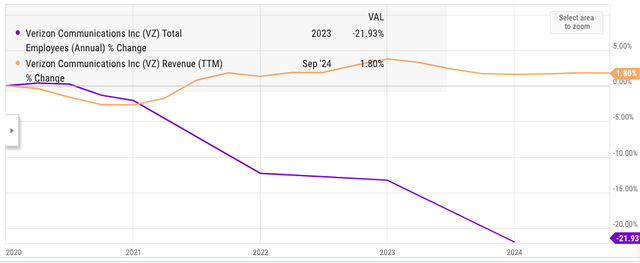
Verizon is a mature business, but it can still deliver good cost optimizations. We have seen both Verizon and AT&T’s management undertake massive job cuts in the last few years. Verizon has recently announced another 5,000 job cut, which should reduce the headcount to below 100,000 for the first time in this century.
Figure: Verizon’s revenue and headcount trends in the last few years. Source: YCharts
In the last five years, Verizon’s revenue has increased by 2%, but its headcount has reduced by 22%. Over the last ten years, Verizon’s headcount has reduced by 40%. This has increased the revenue per employee. We have seen a similar trend in big tech companies like Meta, which saw “year of efficiency” in 2023. Meta reduced its headcount by 20% and saw a massive boost to margin. However, Verizon has not shown any significant improvement in margins despite these job cuts. In most cases, these jobs are given to outside providers, which does not reduce the labor cost significantly. It remains to be seen if Verizon’s management can deliver job cuts and margin improvement at the same time. This would certainly improve the EPS growth trend for the company and change the sentiment towards the stock.
Another tailwind for Verizon is the ability to get synergies from acquisitions. The management has mentioned that the Frontier deal would provide cost synergies of hundreds of millions of dollars. Wall Street would likely wait for positive numbers by Verizon before giving it a better multiple due to these deals.
EPS trajectory of Verizon
Verizon is a very mature business with a stable EPS. This should allow investors to buy at a dip and get out when the stock has seen a big bull run. The forward PE ratio of Verizon is 9.38 compared to the 10-year median of 12.5 and 5-year median of 11.6.
Figure: Comparison of Verizon’s price ratios. Source: YCharts
The forward YoY growth of EPS is also stable, and the company is estimated to deliver $4.9 EPS for the fiscal year ending Dec 2026.
Seeking Alpha
Figure: EPS estimate of Verizon. Source: Seeking Alpha
However, investors should also look at the trajectory of Verizon’s long-term debt. Prior to the 5G rollout, Verizon had close to $100 billion in long-term debt, which has now shot up to close to $150 billion.
Ycharts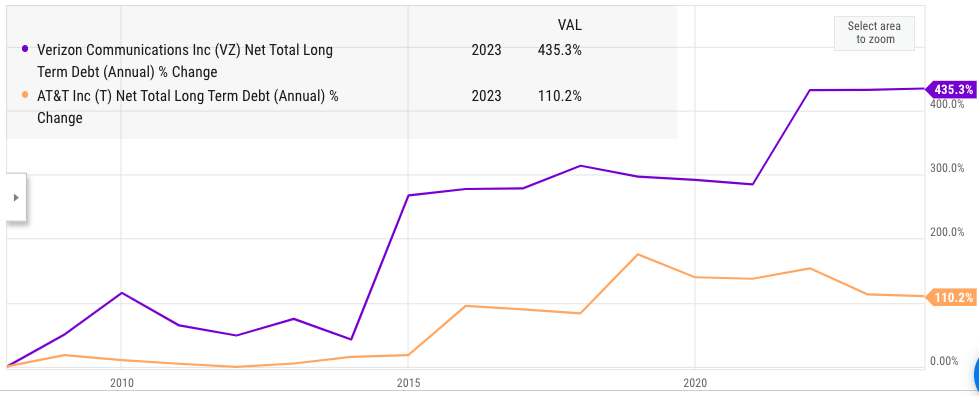
Figure: Growth in net long-term debt of Verizon and AT&T since the recession. Source: YCharts
Both Verizon and AT&T have reached long-term debt of close to $140 billion. However, Verizon’s growth in debt has been faster than AT&T. The recent announcement of the Frontier deal shows that Verizon’s management will keep on looking out for big deals in the hope of improving the growth. However, these deals come at a big price and add to the debt levels.
YCharts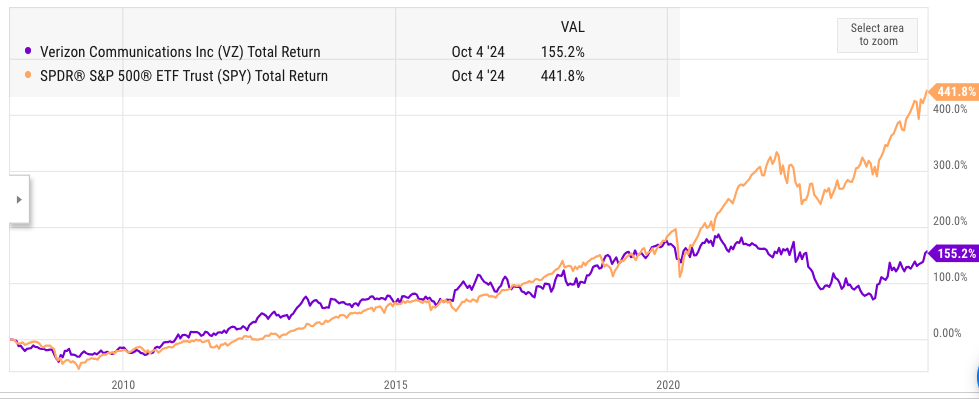
Figure: Total returns of Verizon and S&P 500 since the Great Recession. Source: YCharts
Verizon’s total returns have not been higher than S&P 500 for most of the last decade. Since the pandemic, we have seen a massive divergence as Verizon’s stock underperformed the broader market. However, it is difficult to see Verizon reaching close to the $55-$60 level it enjoyed prior to the pandemic, especially with the massive debt pile. As mentioned above, even a single quarter of FCF dipping below the dividends paid can cause the sentiment to turn around for the stock.
Investor Takeaway
Verizon’s valuation multiples are getting close to historical median when we adjust for the additional debt taken by the company. The announcement of the recent deal with Frontier also shows that the management is not very focused on the debt reduction roadmap. The forward PE ratio is 9.38 which looks modest when we compare to the broader market. But the enterprise value of Verizon is close to rival T-Mobile and even other tech players like Meta. This reduces the upside potential for Verizon stock from the current price making it a Sell.
Analyst’s Disclosure: I/we have no stock, option or similar derivative position in any of the companies mentioned, and no plans to initiate any such positions within the next 72 hours. I wrote this article myself, and it expresses my own opinions. I am not receiving compensation for it (other than from Seeking Alpha). I have no business relationship with any company whose stock is mentioned in this article.
Seeking Alpha’s Disclosure: Past performance is no guarantee of future results. No recommendation or advice is being given as to whether any investment is suitable for a particular investor. Any views or opinions expressed above may not reflect those of Seeking Alpha as a whole. Seeking Alpha is not a licensed securities dealer, broker or US investment adviser or investment bank. Our analysts are third party authors that include both professional investors and individual investors who may not be licensed or certified by any institute or regulatory body.
