Summary:
- Verizon’s stock has shown bullish stabilization post-2023 trough, but still underperforms YTD compared to the S&P 500, suggesting potential gains through mean reversion strategies.
- Mixed earnings report: EPS beat estimates but declined YoY; revenue missed estimates; significant net income drop due to competitive pressures and operational reorganization.
- Strong wireless subscriber growth, yet high-interest rates impact equipment sales; 2025 guidance indicates increased capital spending and modest EBITDA and revenue growth.
- Verizon’s valuation is attractive based on forward P/E and price-book ratios, but slightly elevated on forward price-sales ratio; recent price breakouts suggest potential for long-term growth.
Robert Way
In 2024, Verizon Communications, Inc. (NYSE:VZ) has attempted to generate a sustainable recovery after falling from long-term highs in 2020. Looking back, the stock was trading at highs of $61.95 in early December 2020 and the extended downturn that was experienced by shareholders lasted until October 2023 when a final trough developed with the lows of $30.14 per share. Overall, this massive decline resulted in share price losses of nearly -51.25% in less than three years:
VZ: Significant Long-Term Declines (Income Generator via Trading View)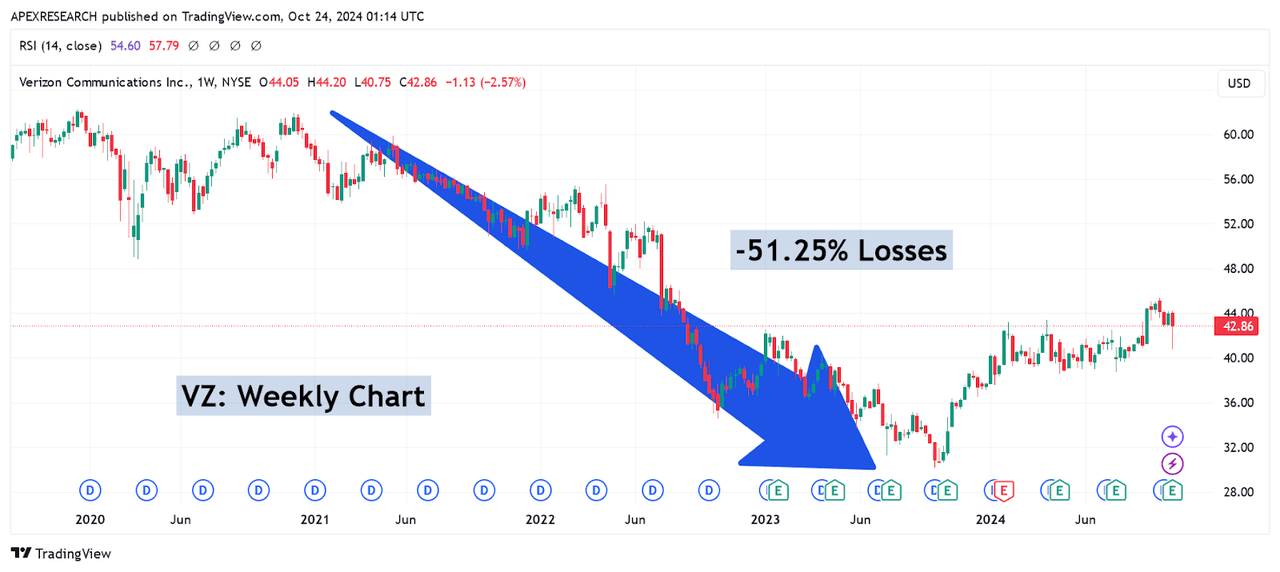
Since then, we have actually started to see a more bullish stabilization in VZ share prices, but the stock is still underperforming on a YTD basis (with gains of just 10.24% versus current gains of 22.24% in the S&P 500). Given this relatively subdued activity in share prices, I think that simple reversion to the mean trading strategies can allow investors to capture fairly significant gains when entering into new long positions near current levels. That said, there were somewhat mixed results in the company’s most recent earnings report and a few different factors that still have the potential to weigh on share prices going forward. For the third quarter period, Verizon Communications posted per-share adjusted earnings of $1.19, which did beat consensus estimates calling for $1.18 in adjusted EPS, but this also indicates a decline of almost -2.46% on an annualized basis. Verizon’s revenue figure came in at $33.3 billion, which fell broadly short of estimates at $33.43 billion, but these numbers were largely flat when compared to the year-ago period (at $33.34 billion).
Verizon Q3 2024 Earnings Figures (Verizon Q3 2024 Earnings Presentation)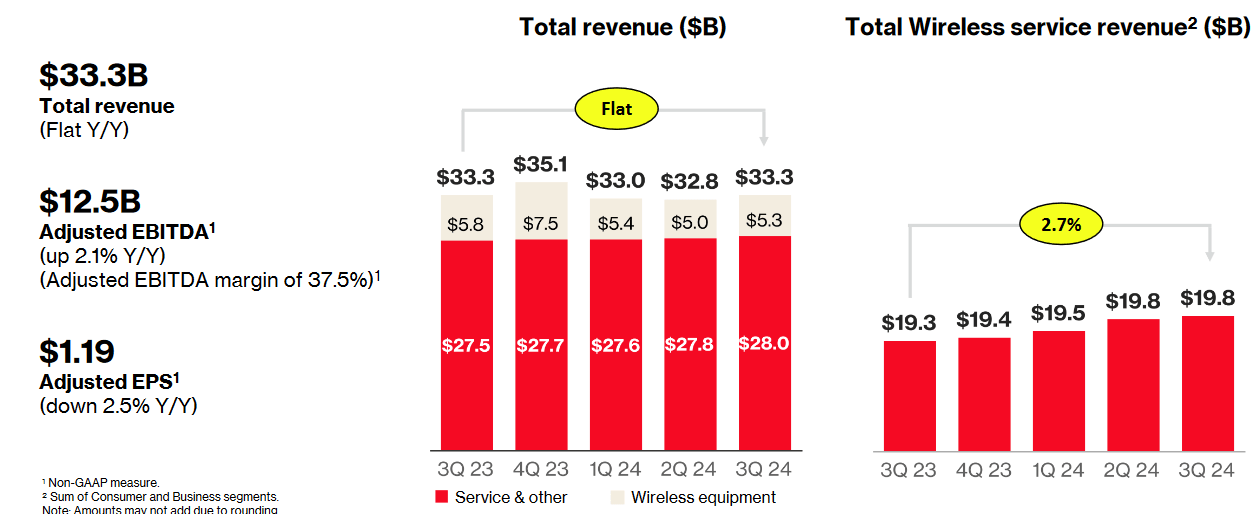
However, in my view, the most striking figure was the change in net income (GAAP), which came in at $3.41 billion and indicated an annualized decline of -30.16% for the period. In large part, these massive declines resulted from reorganized operational activities and a widespread increase in competitive influences throughout the industry, but these declines are quite substantial, and I think this could be one factor that continues to put pressure on share prices. On the positive side, net gains in postpaid wireless subscribers came in at 239,000, and this easily surpassed consensus estimates of 218,000 for the period.
Verizon Q3 2024 Earnings Figures (Verizon Q3 2024 Earnings Presentation)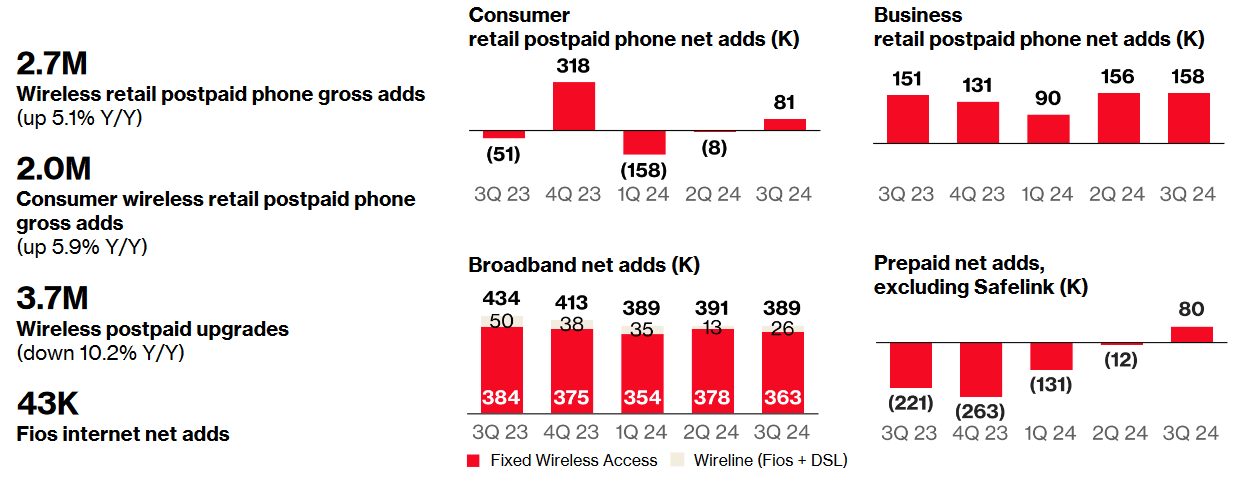
Overall, the company’s total figure for net wireless subscriber additions came in at 363,000, which means that Verizon was more than a year ahead of schedule in terms of meeting its previously stated goals of achieving a user base of 4-5 million. By 2028, the company still aims to reach 8-9 million users within its fixed systems for wireless services. Despite these relatively strong subscriber figures, there is still an argument to be made that these numbers might have been more impressive were it not for the current high-interest rate environment that has limited broader spending activities and made it more difficult for consumers to purchase high-priced items. In part, this likely helps to explain why Verizon’s equipment sales for wireless products saw declines of -9% for the period.
Verizon Q3 2024 Earnings Figures (Verizon Q3 2024 Earnings Presentation)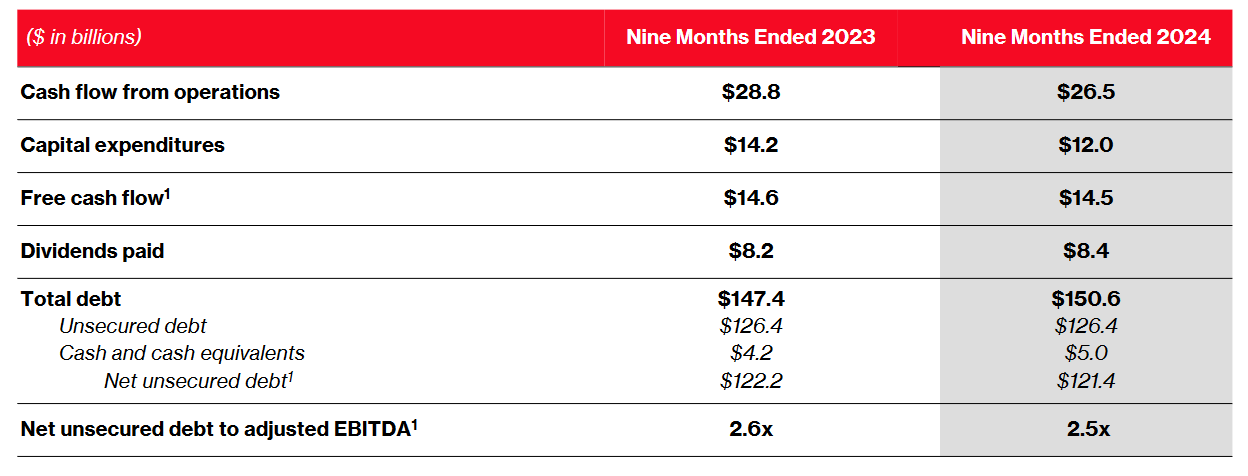
For 2025, Verizon’s current guidance figures imply that capital spending will now fall within a $17.5-18.5 billion range, which gives us an $18 billion mid-point that exceeds prior expectations (which were seen near $17.6 billion). For the full-year period in 2024, Verizon expects to see growth in EBITDA (adjusted) at 1-3% and 2-3.5% growth in revenues from its wireless services. Since these quarterly results are somewhat mixed, it is a good idea for investors to conduct a comparative valuation analysis in order to determine whether the stock is a good value at the moment.
Verizon: Comparative Forward Price to Earnings Valuations (YCharts)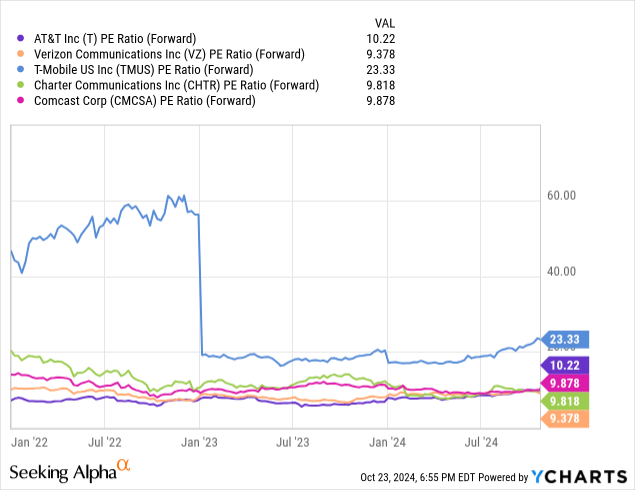
Looking at Verizon’s current forward price-earnings ratio of 9.378x, we can see that the stock is actually looking quite attractively valued at the moment. Industry peers like Charter Communications, Inc. (CHTR) at 9.818x and Comcast Corp. (CMCSA) at 9.878x are trading at slightly higher valuations. However, AT&T, Inc. (T) is a bit more elevated at the moment (at 10.22x) and T-Mobile US, Inc. (TMUS) is much more expensive right now, with a forward price-earnings ratio of 23.33x.
Verizon: Comparative Forward Price to Sales Valuations (YCharts)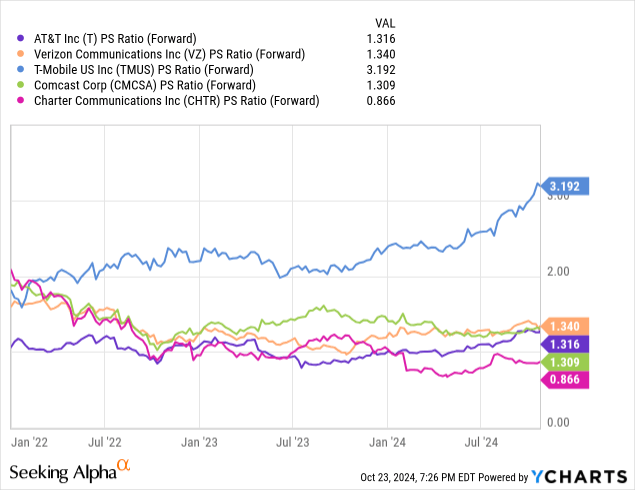
To change the perspective, we can also view these companies based on their comparative forward price-sales ratios and, here, we can see that Verizon (at 1.34x) is in a less favorable position. In this case, only T-Mobile is trading at a more expensive valuation (at 3.192x). In contrast, AT&T (at 1.316x), Comcast (at 1.309x), and Charter Communications (at 0.866x) are all trading at more favorable valuations. With this in mind, we can see that trends in quarterly mobile equipment sales have started to have a comparative impact on Verizon’s current valuation metrics.
Verizon: Comparative Forward Price to Book Valuations (YCharts)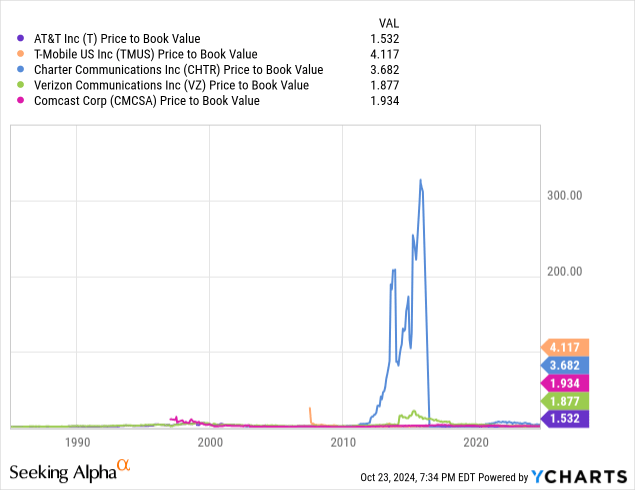
Next, we will comparatively assess these companies based on their relative price-book valuations. Here, we can see that Verizon currently rests toward the middle of the pack (at 1.877x). Using this metric, the three companies with higher price-book ratios can be found with Comcast (at 1.934x), Charter Communications (at 3.682x), and T-Mobile (at 4.117x). In contrast, AT&T remains more cheaply valued (at just 1.532x). Looking at these comparative valuations, we can see that Verizon is quite attractively valued within this peer grouping when we are assessing the stock’s forward price-earnings ratio and price-book ratio. However, VZ is slightly elevated when assessing these stocks based on their comparative forward price-sales ratios.
VZ: Critical Support and Resistance Levels (Income Generator via Trading View)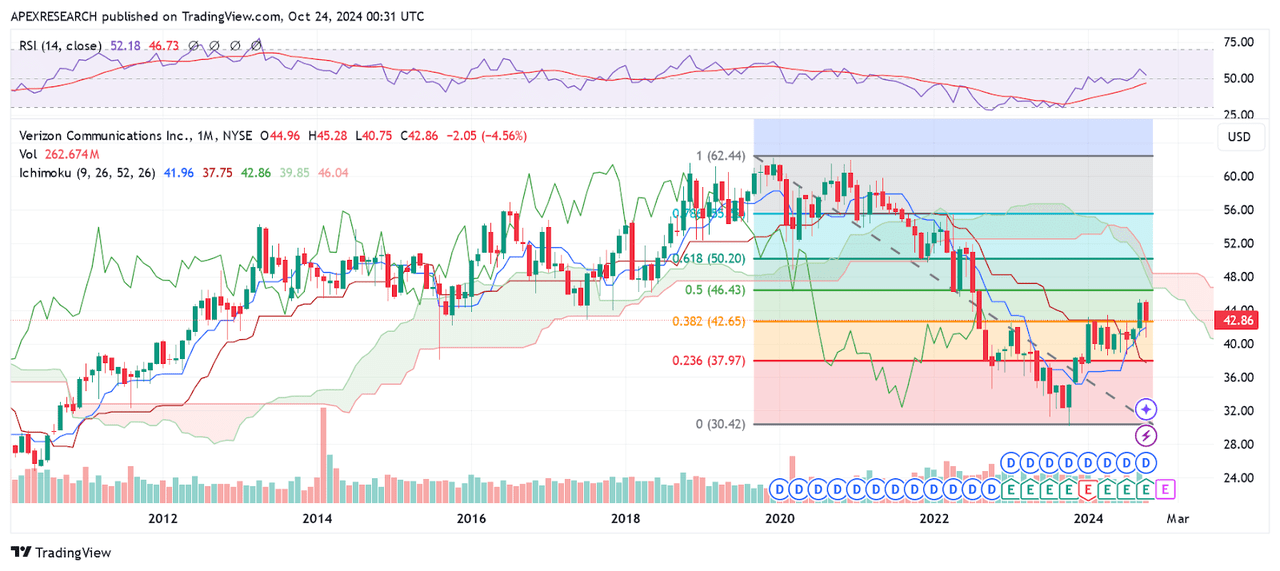
Looking into the long-term price history for this stock, we can see some very interesting developments have recently occurred on the monthly time frames. During the September 10th trading period, we saw share prices break through critical resistance levels at $43.42 (marking the April 4th, 2024 highs). Additionally, the significance of this specific price zone was further strengthened by the fact that this area aligns with the 38.2% Fibonacci retracement level for the declining move from $61.95 (December 2020 highs) to $30.14 (October 2023 lows), which is located near $42.65. Further extensions in the stock’s most recent rally have also forced share prices through the 20-month, 50-month, and 200-month exponential moving averages, and indicator readings in the relative strength index for this time frame are currently holding below the 52.2 level. Essentially, this suggests that share prices could still move quite far to the topside without reaching overbought territory (which would be marked by the 70 level in the relative strength index). From this perspective, recent price breakouts have been quite significant (in several different ways) and this suggests that we have likely established a long-term low near $30.14 and another important region of support near $38.70 (which marks the daily lows from July 1st, 2024). On the whole, I think Verizon’s most recent quarterly figures imply continued potential for stable growth in the company’s wireless segment, although this also needs to be balanced with the fact that competitive pressures throughout the industry have presented profitability challenges that could be encountered heading into 2025. As a result of all of these factors, I will be maintaining my long position in VZ and capturing the stock’s highly attractive 6.44% dividend yield while I wait for new movements higher in share prices.
Analyst’s Disclosure: I/we have a beneficial long position in the shares of VZ either through stock ownership, options, or other derivatives. I wrote this article myself, and it expresses my own opinions. I am not receiving compensation for it (other than from Seeking Alpha). I have no business relationship with any company whose stock is mentioned in this article.
Seeking Alpha’s Disclosure: Past performance is no guarantee of future results. No recommendation or advice is being given as to whether any investment is suitable for a particular investor. Any views or opinions expressed above may not reflect those of Seeking Alpha as a whole. Seeking Alpha is not a licensed securities dealer, broker or US investment adviser or investment bank. Our analysts are third party authors that include both professional investors and individual investors who may not be licensed or certified by any institute or regulatory body.
