Summary:
- We look to generate alpha-producing investment ideas, no matter the market, direction or complexity.
- Right now, Netflix’s short-term implied and realized volatility is at multi-year lows, and trading materially below long-term averages.
- Investing into a Netflix volatility position could produce significant gains, without accompanying directional exposure, as the stock’s realized vol is set to increase.
- This idea isn’t for everyone, but it could provide an uncorrelated return stream for sharp investors who are comfortable trying something new.

TERADAT SANTIVIVUT
If you’re new to the markets, alpha is simply a shorthand way of saying return above a reference market.
Given that we’re all stock investors, that reference market is usually the S&P 500. Thus, our goal is to provide you with ideas and insights that will help you outperform the S&P.
- Sometimes we do this through differentiated stock picks, which you can see an example of here: “UnitedHealth: Our Top Long Idea For 2024“.
- Sometimes, we use options to trade a situation, if it appears like a better way to generate returns: “AT&T: Pay Yourself 11% With This Bond-Like Exposure“.
Today, we’ve got an option idea for you that’s focused on Netflix (NASDAQ:NFLX), the streaming giant.
However, there’s a twist.
Traditionally, our option ideas focus on selling puts, which is a simple transaction that either locks in a solid cash-on-cash gain or allows investors to enter a stock at a price beneath the current market – a win-win proposition if the conditions are right.
Today, we’ve got something a little bit more advanced to show you. If our idea works out as we expect, then you may be able to earn significant gains while taking zero directional risk in Netflix stock.
Sound interesting? Let’s jump in.
Volatility As An Asset Class
When investors think of asset classes, many typically break things down into the usual suspects: Stocks, Bonds, Real Estate, Currencies, Crypto, and Commodities.
However, we’re here to tell you that Volatility itself is an asset class. It’s typically categorized under ‘Alternatives’, and many asset managers and funds all over the world have strategies that are solely dedicated to trading and investing in it.
The category may be a bit confusing, because you can’t ‘point’ at volatility, like you can with a bond or a stock. Those are tangible. However, by using options in certain ways, you can make bets that make or lose money strictly based off of volatility – not the direction of the underlying market.
Investing in volatility is attractive to many market participants because predicting volatility can be a lot easier than predicting the future price of a stock. This is mostly due to the somewhat ‘mechanical’ nature of volatility, and its tendency to return to the mean over time.
Thus, our idea’s profits are dependent on our ability to be right about Netflix’s future level of volatility, not the direction of Netflix’s underlying stock.
Netflix Volatility
So; let’s have a look-see at Netflix’s current volatility situation.
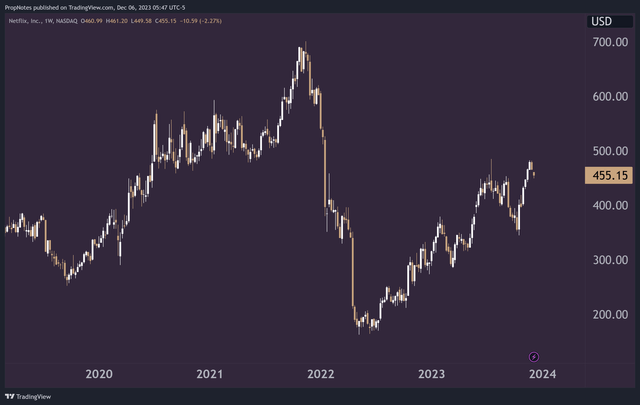
Over the last few years, NFLX stock has been on a wild ride:

TradingView
After rising to new highs during the pandemic, a series of subscriber growth misses and disappointing earnings sent the once-exalted ~$700 stock to under $200 per share.
Following that precipitous drop, the stock has been on a brisk-but-choppy looking comeback rally that has deposited the stock back above $450 as of present writing.
However, this is just the ‘surface-level’ pricing. Let’s have a look at the volatility situation over that time.
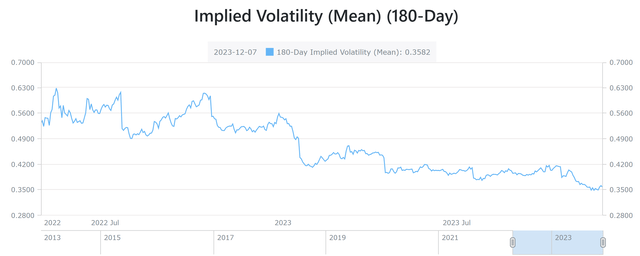
Here’s a quick picture of Implied Volatility in Netflix Stock:

AlphaQuery
As you can see, rolling 30 day IV is at yearly lows, which indicates that market participants see muted volatility over the coming holiday season & new year.
This matches with the situation ‘on-the-ground’ in terms of realized volatility.
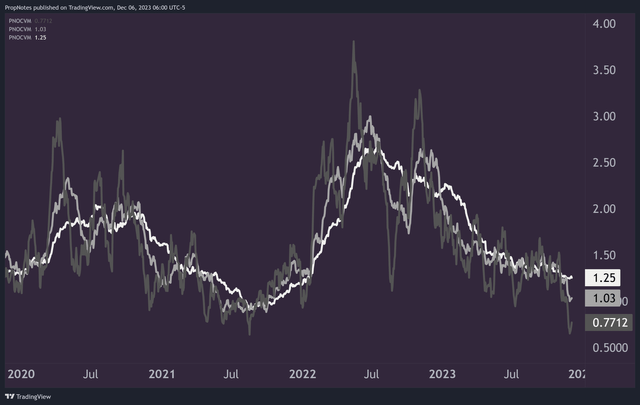
Below, you will see three lines; dark gray, light gray, and white.
The white line is a long-term average of absolute intraday returns. The gray line is a medium-term average of absolute intraday returns. The dark gray line is a short-term average of absolute intraday returns:

TradingView
If you’re unfamiliar, absolute intraday return is simply a metric that tracks the open-to-close range of a stock, not baking in directional bias. Thus, a stock that moves down 4%, then down 3%, then down 5%, will show a higher level of volatility than a stock that moves up 1%, then up 2%, then up 1% over the same 3-day timespan.
If you’re trying to make sense of the chart above, the best way to think about it is that the white line is a sort of slow-moving “fair value” of realized volatility.
The light gray line is a reference line to show how and if things are accelerating or decelerating.
The dark gray line is a representation of short term realized volatility in the market.
The main takeaways from the chart, right now, are as follows:
- Short term realized volatility is at multi-year lows. This means that daily moves recently in the stock have been as small as they have been in a long, long time.
- Short term realized volatility has deviated significantly from long term realized volatility. This means that one would expect volatility to be higher than it has been, based on the average amount of volatility over the last ~6 months or so.
While occasionally there may be differences between IV and RV which can lead to discrepancies, like when an early-stage biotech company has an FDA decision pending, right now, both the realized and implied volatility readings in NFLX are trading at lows, in lockstep.
As investors, this indicates that there may be an opportunity here to make some money.
How?
By betting that volatility will increase.
Why would we expect this? Mainly because volatility is abnormally low to the downside, both on a historical basis vs. itself over the last several years, as well as when compared with realized volatility’s ‘fair value’.
Thus, our trade here should express our view that volatility is set to increase over the next couple months.
Let’s break it down.
The Trade
The first step to taking advantage of this volatility view is purchasing a straddle. A straddle is a type of option structure that is comprised of one long call, and one long put.
Putting the position on costs a debit, which means that you have a cash outlay and capped risk. Because the position is comprised of a long call and long put, the bet makes money if Netflix stock makes a move to either the downside or the upside. The catch is that the stock needs to move more than you paid for the options, between now and option expiry.
In short, when you buy a straddle, you need volatility to increase to make money.
Thankfully, we expect that volatility is set to increase, as we’ve laid out. Plus, implied volatility is at long term lows as well, which indicates that the options we purchase to take advantage of our view should not be adversely priced:

Seeking Alpha
Right now at writing, going out to the May 2024 contracts, this option position would cost about $8,825 to put on, per unit, given a $455 strike price. This is about 19% of the cost of a full 100 share position in the name.
So – we have our option position. On to step two.
Step two is simple; manage the position.
Sure, if you had conviction that the stock would make a massive move over the next 6 months, then it makes sense to simply buy the position and let it ride.
However, there’s a way to adjust the position regularly that increases our chance of making money significantly. It’s called Gamma Scalping, and it’s less complicated than it sounds.
Every day, Netflix stock moves a certain amount. This will lead to our straddle gaining or losing in unrealized profit. In short, the further away we get from our strike price at $455, the more money we make. However, moves back towards $455 will lose us money, as a straddle earns returns when the stock makes a big move in one direction or the other.
For us, we have a view on the amount of volatility, which we expect to increase – not the consistency of the directional move. Thus, by “resetting” the position once per day, we can turn our volatility expectations into returns. This sounds complicated, but it’s very simple to do in practice.
Let’s say NFLX moves from $455 to $470 over a few days. This would likely cause an unrealized profit in our position, as movement is what we’re looking for.
That said, if NFLX moves back to $455 from $470, then we’d likely lose our unrealized gains.
By shorting some underlying stock at $470, we can ‘lock in’ the move that’s happened. If the stock keeps going up, then the straddle makes more money than we lose on the stock. If the stock goes back down, then we can close the stock position to cancel out a chunk of the losses.
The best way to do this is simply to adjust the position to have a ‘Delta’ of 0 at the end of each trading day by buying or selling stock to balance things out.
In this way, all we really need to make money is for volatility to increase, which is what we’re expecting.
This trade idea is a relatively advanced concept, so feel free to ask questions in the comments if it’s not clicking completely.
Upcoming Catalysts
In addition to the volatility irregularity we’ve identified, there’s a few other catalysts upcoming in the stock that could improve the trade’s chance of success.
First, Netflix earnings are in January and April, which is before the option position expires. This increases the chance of a big move that we can gain exposure to in our option position.
Given that volatility around Netflix earnings events has been high in years’ past, we expect that these releases should power big absolute moves in the stock.
Additionally, there are other ongoing catalysts in the stock to consider, including content releases of massively popular shows like ‘The Crown’, potential further partnerships with other telco/media companies, and news of progress on the ad-supported front.
Each of these have the potential to send the stock moving in one direction or the other, given that all of them could materially impact subscriber numbers.
All in all, there are a number of catalysts between now and next May that could provide a potential boost to our selected trade idea.
Risks
The main risk we see is that realized and implied volatility simply stay muted for the next 6 months. This would cause a slow bleed in the option position, which may end up recouping less than 100% of the initial outlay through the hedging process we described.
This could happen as investors look to take a breath following the period of significant volatility that 2022 and 2023 have brought.
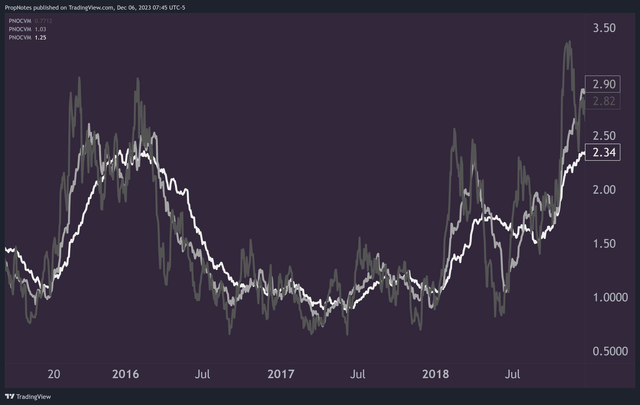
If the stock goes through another period like it did 2017, when it saw very, very low realized volatility, then our position could be in trouble:

TradingView
However, the market is a lot different in many ways than it was back then, and thus we don’t see the period an analogous to the present moment.
Summary
All in all, we think the opportunity right now in Netflix is highly interesting.
It’s not every day that stocks deviate this strongly from their historical means when it comes to realized volatility, and this is something we like the idea of pouncing on.
There are risks, chief among them being that volatility stays muted. However, given the extension of the volatility irregularity, as well as the number of potential future RV catalysts, we’re comfortable with the risk profile here.
Good luck to all. Cheers!
Analyst’s Disclosure: I/we have no stock, option or similar derivative position in any of the companies mentioned, but may initiate a beneficial Long position through a purchase of the stock, or the purchase of call options or similar derivatives in NFLX over the next 72 hours. I wrote this article myself, and it expresses my own opinions. I am not receiving compensation for it (other than from Seeking Alpha). I have no business relationship with any company whose stock is mentioned in this article.
Seeking Alpha’s Disclosure: Past performance is no guarantee of future results. No recommendation or advice is being given as to whether any investment is suitable for a particular investor. Any views or opinions expressed above may not reflect those of Seeking Alpha as a whole. Seeking Alpha is not a licensed securities dealer, broker or US investment adviser or investment bank. Our analysts are third party authors that include both professional investors and individual investors who may not be licensed or certified by any institute or regulatory body.
