Summary:
- Visa is a global payments processing and financial services company based in San Francisco, California.
- V has consistently delivered strong returns for shareholders, including an impressive performance over the last month against SPX.
- This article covers Visa’s one-month technical chart to evaluate various indicators. Each indicator mentioned is defined and analyzed for bullish or bearish signals.
- Investors are advised to be cautious about Visa based on the technical information available. Bulls and bears alike may find opportunity here.
hatchapong
Introduction
Visa Inc. (NYSE:V) is a payments processing and financial services company operating globally out of San Francisco, California. Visa has served shareholders well since its launch, as well as in a much shorter timeframe like the past month.
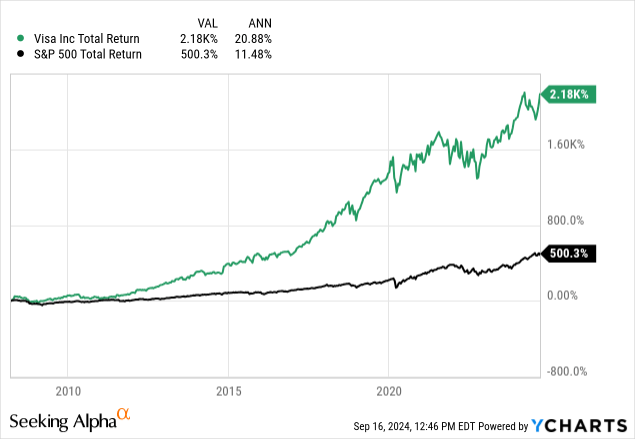
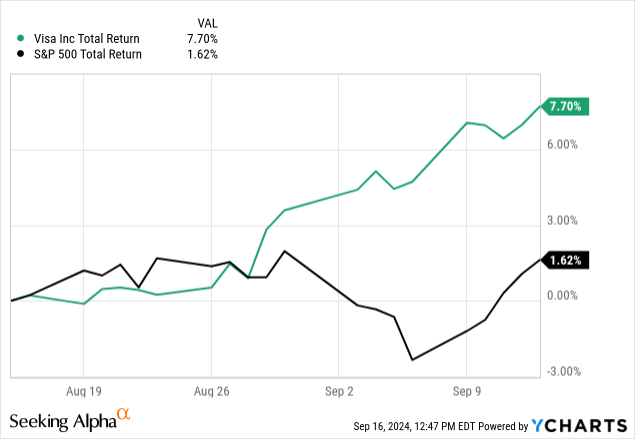
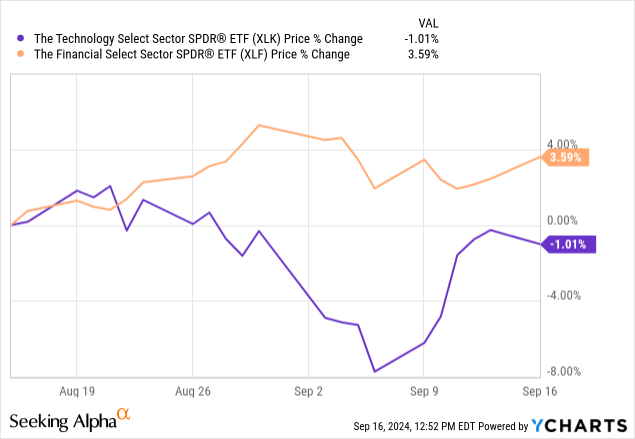
Visa has outperformed the S&P 500 over the past month, primarily due to SPX’s exposure to the tech sector, which has dropped precipitously compared to financials.
What Does The Chart Say?
Looking at Visa’s charts shows us that it has had tremendous momentum getting to this point over the last month, but that momentum may be fading. Here are some of the indications I see in the chart.
Simple Moving Averages & Visa’s Golden Cross
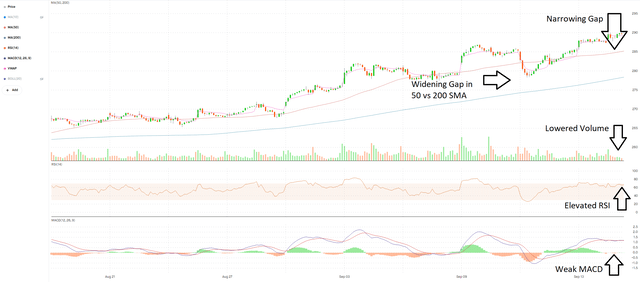
The 50 SMA being above the 200 SMA (simple moving average) is a bullish sign, and the crossing of the 50 over the 200 is known as a “Golden Cross,” and is a very bullish signal. Visa saw this shortly before the chart starts, as you can see by how narrow the gap is initially.
It is bullish to see a widening of the gap between the two as we move into this month, but recent trading sessions have seen this gap narrow.
We should continue watching this, as a cross of the 50 SMA down below the 200 SMA would signal a “death cross,” or a bearish reversal. As it narrows, note that it is still a wide gap, and it could stay at that width for a long time, narrow but not cross, or even reverse trends again and widen. For this metric, it is currently “bullish but cautious,” and we should watch for changes.
Relative Strength & Volume
RSI is a measure of strength, literally the “relative strength index,” which is an oscillator that helps gauge momentum. The top of the red zone is 70, which is a signal for a stock being overbought and losing momentum based on the speed and magnitude of changes in stock price. A current value of 65+ means that we are very close to an overbought signal, which could start a downtrend.
Note how when the RSI has breached the overbought line, we saw a consolidation in price shortly after. Being close to that line now means that we may be close to another consolidation. This is our first bearish signal and one that has me cautious about entering a position in Visa now.
This comes on the back of lowering volume, shown by the bars below the price candles in the chart above. Note that we are currently seeing a significantly lowered volume compared to several weeks ago. This, coupled with slower changes in prices as shown by increased RSI, gives me the impression that momentum (in this case, specifically upward momentum) is fading and may not last much longer. Visa may be due for a correction, signaled by these buyers holding back and waiting, which reduces volume.
MACD Weakness
The Moving Average Convergence Divergence indicator, known as the MACD (I pronounce it “Mac-Dee,” does anyone say it differently?) measures exponential moving averages. The bars at the bottom are a histogram showing the distance between the two lines, the signal line and the MACD line.
Currently, we can see the distance between these two momentum gauges has not only closed but crossed. This is a very bearish sign, as it signals that Visa has lost its exponential momentum (even if it still has its simple momentum, as mentioned above).
A dip of the MACD line down below the signal line (the blue line and the red line respectively), as looks likely from the current momentum, could be bearish for Visa’s price overall, and could kill any positive momentum it otherwise gets from general market trends via Beta.
The flattening of the two lines together, combined with lower volume and a near-overbought RSI, is a bearish sign for Visa, and one that tells me that its momentum is fading even if it won’t reverse into a full downtrend.
Bollinger Says Stay Away
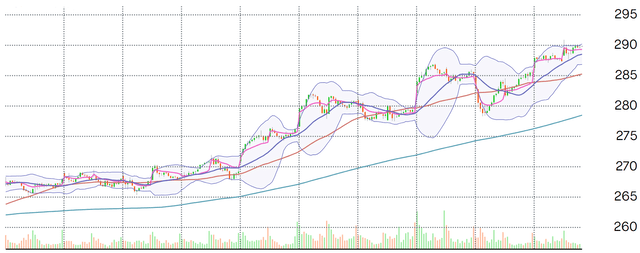
The blue area around Visa’s 1-month price chart above is a Bollinger band. It is essentially a measure of standard deviation, i.e. the likelihood of something happening. In this case, it refers to the likelihood of prices breaking out of their typical movements.
We can see that Visa has hit the top of its band, bouncing against it several times now. Unless there is a catalyst that the market hasn’t already factored in, Visa is at its momentum limit on the upside. It does, however, have plenty of downside room to go while still being within a “standard” range, according to this metric.
This is a bearish sign, but one that can be set aside if there are catalysts ahead, as they tend to break the bands quickly if there are large, sudden movements like after earnings calls.
Conclusion
Visa’s chart is that of a stock that is losing its steam. Momentum is drying up, as is investors’ interest in the stock at its current price. This is reflected in its high RSI, weak MACD, and lowering volume. Its price may be around its peak until there is a positive catalyst either for it or the broader market.
For now, I am assigning Visa a hold rating because I believe it will likely underperform the market over the next month based on these indicators. That being said, it may not lose money and investors are advised not to short Visa either.
Aggressive investors may consider a 2% allocation to Visa but should watch carefully for changes in the aforementioned trends. Conservative investors are advised to consider exposure to Visa only through funds and other diversified investments.
Thanks for reading.
Analyst’s Disclosure: I/we have no stock, option or similar derivative position in any of the companies mentioned, and no plans to initiate any such positions within the next 72 hours. I wrote this article myself, and it expresses my own opinions. I am not receiving compensation for it (other than from Seeking Alpha). I have no business relationship with any company whose stock is mentioned in this article.
Seeking Alpha’s Disclosure: Past performance is no guarantee of future results. No recommendation or advice is being given as to whether any investment is suitable for a particular investor. Any views or opinions expressed above may not reflect those of Seeking Alpha as a whole. Seeking Alpha is not a licensed securities dealer, broker or US investment adviser or investment bank. Our analysts are third party authors that include both professional investors and individual investors who may not be licensed or certified by any institute or regulatory body.

