Summary:
- V remains a Buy, despite the stock’s impressive rally by +27.1% since the October 2023 bottom, well outperforming the wider market at +23.3%.
- The fintech has reported robust performance metrics and expanding profit margins, significantly aided by the accelerating growth in new flows segment, e-commerce, and Tap to Pay digitization.
- V continues to return excellent value to long-term shareholders, through double-digit dividend growth and sustained share repurchases.
- Combined with the management’s promising commentary surrounding consumer spending, corroborated by JPM’s 2024 guidance, we believe that V remains a Buy at every pullback.
Monty Rakusen/DigitalVision via Getty Images
We previously covered Visa (NYSE:V) (NEOE:VISA:CA) in October 2023, discussing its dominance in the global payment processor market, with it accounting for 39% of all payment card purchase transactions globally in 2022.
Despite the uncertain macroeconomic outlook and the intensified write-downs/charge-offs by credit card issuers, we had believed that V continued to offer an attractive risk/ reward ratio, further aided by the management’s promising forward guidance.
In this article, we shall discuss why V remains a Buy, despite the stock’s impressive rally by +27.1% since the October 2023 bottom, well outperforming the wider market at +23.3%.
With the fintech still reporting robust performance metrics and expanding profit margins, the stock continues to demonstrate why it deserves its premium valuations over the sector median, especially given the raised consensus forward estimates.
Combined with the management’s promising commentary surrounding consumer spending, we believe that V remains a Buy at every pullback.
V’s Investment Thesis Remains Robust As A Long-Term Compounder
For now, V has reported a double beat FQ2’24 earnings call (CQ1’24), with net revenues of $8.77B (+1.6% QoQ/ +10% YoY) and adj EPS of $2.51 (+4.1% QoQ/ +20% YoY).
Much of the top-line tailwinds are naturally attributed to its growing payment volume by +8% YoY and cross-border volume by +16% YoY in the latest quarter, further sustaining the robust growth volumes reported in CY2023.
For context, V reports the leading purchase volume of $3.18T for debit cards (+8% YoY) and $3.02T for credit cards (+7% YoY) in the US, with a growing overall market share of 61% (+0.7 points YoY) in CY2023.
This is more than double of MA’s numbers at $1.16T (-31% YoY), $1.43T (+27% YoY), and 25.4% (-3.9 points YoY) in CY2023, respectively, with Q1’24 numbers yet available (earnings call on May 01, 2024).
The Nilson report also expects V to continue growing its payment cards in global circulation from 4.31B in 2023 to 5.04B by 2028, expanding at a CAGR of +3.1%.
This is compared to MA from 2.94B to 3.53B at a CAGR of +3.7%, further underscoring the former’s leadership position in the payment processor market and its long-term growth prospects.
It is apparent from these numbers that the global e-commerce scene continues to be healthy, as similarly reported by Amazon (AMZN) and Shopify (SHOP) in Q4’23, further aided by V’s digitization of in-person payments through Tap to Pay amongst others.
This is on top of the excellent revenue growth reported by the new flows segment by +14% YoY, mostly attributed to Visa Direct’s increased transactions by +31% YoY to $2.3B, as the fintech aims to enter the B2B, B2C, P2P, and remittance market with an estimated $200T in TAM, excluding Russia and China.
At the same time, V’s bottom-line tailwinds are attributed to the fintech’s relatively efficient adj operating expenses of $2.87B (+9.9% QoQ/ +11.2% YoY) and stable adj operating margins of 67.2% (-2.4 points QoQ/ -0.4 YoY) in FQ2’24.
This is compared to FY2023 adj operating margins of 67.9% (inline YoY) and FY2019 margins of 66.9% (inline YoY).
This is on top of the annualized net interest income of $636M in FQ2’24 (+80.6% QoQ/ +374.1% YoY), thanks to the management’s competent use of balance sheet at a time of elevated interest rate environment.
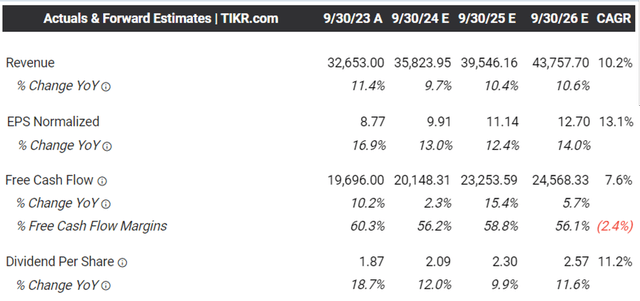
This is also why V has been able to report a rather rich Free Cash Flow generation of $4.25B in FQ2’24 (+27.2% QoQ/ +16.6% YoY) with margins of 48.5% (+9.7 points QoQ/ +2.8 YoY), building upon the FY2023 numbers of $19.69B (+10.2% YoY) and 60.3% (-0.7 points YoY), respectively.
The robust profitability is also why V has been able to return great value to existing shareholders, based on the 5Y Dividend Growth CAGR of +16.09% compared to the sector median of +6.51%, and the last payout hike by +15.5% in October 2023.
This is on top of the -54M shares, or the equivalent -2.5% of its float retired over the last twelve months, and -233M/ -10.2% since FY2019, respectively.
Lastly, V remains well capitalized moving forward, since only $8.26B of its long-term debts are due over the next five years, further aided by its growing cash on balance sheet at $17.7B (-4.7% QoQ/ +6.6% YoY).
The Consensus Forward Estimates
Perhaps this is why the consensus has moderately raised their forward estimates, with V expected to generate an excellent top/ bottom line growth at a CAGR of +10.2% and +13.1% through FY2026.
This is compared to the previous estimates of +10%/ +12.7%, while building upon the historical growth at +11.7%/ +17.5% between FY2016 and FY2023, respectively.
V Valuations
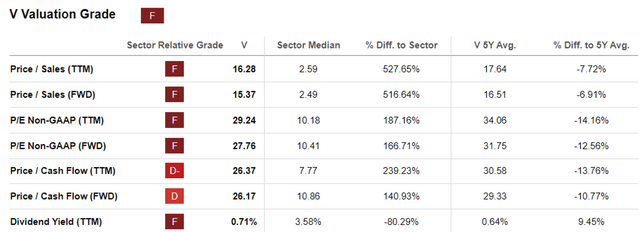
And it is for this reason that we believe that V looks attractive at FWD P/E valuations of 27.76x and FWD Price/ Cash Flow valuations of 26.17x, relatively discounted from its 5Y mean of 31.75x and 29.33x, respectively.
Readers must also note that V is inherently cheaper than its direct peer, Mastercard (MA) at 32.1x/ 28.58x, with the latter expected to generate a higher top/ bottom line growth at +12.4%/ +17% through FY2026.
While market leaders are rarely cheap, we believe that V appears to be very attractive at current levels, allowing investors to add the stock as part of their well-diversified fintech portfolio.
Things To Note Before Adding V Here
We previously highlighted certain growth risks for V in an uncertain macroeconomic environment, with many major credit card lenders already reporting higher average delinquency rate of 3.20% as of February 2024 (-0.4 points MoM/ +0.61 YoY), compared to the 2.85% reported in February 2020.
We have reckoned that 2023/ 2024 may bring forth a slowdown in credit card issuances and deceleration in payment volume growth before the macroeconomic outlook normalizes, naturally impacting V’s near-term prospects as a payment processing service provider, despite the fact that most of the risks will be borne by the issuing banks.
Even so, it appears that we have been wrong after all, with the largest issuer of general purpose credit cards in the US, JPMorgan (JPM), expecting the overall “net charge-off rates to be below 3.5% in 2024,” significantly aided by the robust labor market.
The same has been reported by V in the recent earnings call, with “consumer spend across all segments from low to high spend remaining relatively stable,” and its “data not indicating any meaningful behavior change across consumer segments.”
Even so, while V and the overall fintech industry continue to offer optimistic commentary surrounding consumer spending, we believe that investors may want to monitor the situation for a little longer, with the March 2024 CPI still indicating elevated inflationary pressures and the Fed’s path to a 2% inflation target likely to be prolonged.
So, Is V Stock A Buy, Sell, or Hold?
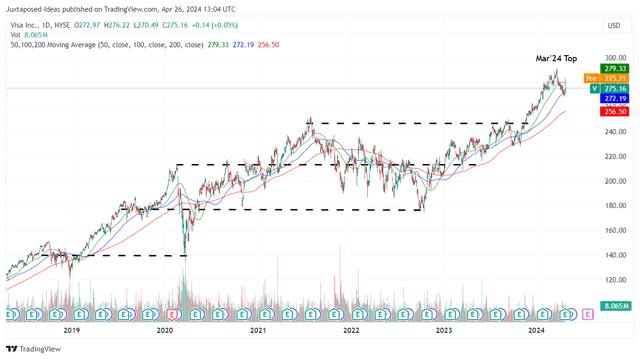
V 5Y Stock Price
For now, V has already charted an impressive rally of +27.1% since the October 2023 bottom, outperforming the wider market at +23.3%.
Thanks to the recent pullback, the stock is also trading near our fair value estimates of $261.20, based on the LTM adj EPS of $9.41 and the FWD P/E valuations of 27.76x.
There appears to be an excellent upside potential of +28.3% to our long-term price target of $352.50 as well, based on the consensus FY2026 adj EPS estimates of $12.70.
While V may offer a relatively underwhelming forward dividend yield of 0.76%, compared to the US Treasury Yields at between 4.66% and 5.39%, it is already improved than the former’s 5Y average yields of 0.44% and MA’s forward yields at 0.57%.
This is on top of the robust shareholder returns as discussed above, exemplifying the management’s excellent use of the growing free cash flow generation.
As a result of the prospective dual pronged returns through capital appreciation and dividend payouts, we are maintaining our Buy rating for the V stock.
Analyst’s Disclosure: I/we have a beneficial long position in the shares of AMZN either through stock ownership, options, or other derivatives. I wrote this article myself, and it expresses my own opinions. I am not receiving compensation for it (other than from Seeking Alpha). I have no business relationship with any company whose stock is mentioned in this article.
The analysis is provided exclusively for informational purposes and should not be considered professional investment advice. Before investing, please conduct personal in-depth research and utmost due diligence, as there are many risks associated with the trade, including capital loss.
Seeking Alpha’s Disclosure: Past performance is no guarantee of future results. No recommendation or advice is being given as to whether any investment is suitable for a particular investor. Any views or opinions expressed above may not reflect those of Seeking Alpha as a whole. Seeking Alpha is not a licensed securities dealer, broker or US investment adviser or investment bank. Our analysts are third party authors that include both professional investors and individual investors who may not be licensed or certified by any institute or regulatory body.


