
Summary:
- Consumer spending and transactions continue to grow in the U.S. and abroad despite macroeconomic uncertainties.
- The consumer remains strong with debt service levels below long-run averages despite record revolving debt balances.
- Visa’s brand strength combined with network effects creates a wide moat that protects the business’ incredible margins and returns on equity.
sinopics/iStock Unreleased via Getty Images
As inflation recedes, driven in large part by tightening monetary policy and waning consumer demand, it is not unreasonable to expect a recession to occur in the U.S. While I would expect any recession to be relatively shallow and short-lived, it is important to seek out investments that can add value in that environment.
During an economic slowdown, it makes sense to add to positions that provide at least one of three outcomes: 1) safety/downside protection, 2) upside opportunity, and/or 3) generate returns that are uncorrelated to the macro environment and are driven by micro factors.
For this article, I will focus on the second option in which we are looking for an investment that can provide upside opportunity during an economic slowdown.
Typically, companies within utilities or consumer staples provide downside protection with some individual names providing opportunity to the upside. The trade-down trade is well-known with names like Dollar General (DG), Walmart (WMT), and to some extent, Amazon (AMZN), being beneficiaries as consumers tighten their belts and try to pinch pennies. While this strategy is legitimate, I would like to focus elsewhere.
Second Quarter Earnings and Future Upside
In its Q2 earnings release today, Visa announced revenue growth of 11% year-over-year and GAAP net income growth of 17% with total processed transactions climbing 12% during the quarter compared to last year.
Given the Q2 performance and outlook, it is reasonable to expect the stock to continue to perform well. Since reaching an all-time high of about $250/share in July 2021, the stock has traded lower with the current rebound beginning in October 2022. The underlying fundamentals of the business, particularly margins and returns on capital, as discussed in the article below, should support continued growth in the stock price. Based on continued transaction growth and stable margins, I expect the stock to surpass its $250 high before year-end with continued annual compounding in the long run at rate comparable to the dividend growth rate in the high teens. This is a secular growth story, and any economic slowdown or pullback in the stock might provide an attractive entry point for long-term investors.
Processing Payments in All Environments
Visa (NYSE:V), the global payments company conducting business across virtually every country and territory on the planet, is well-positioned for most economic scenarios. During periods of growth, consumers and businesses spend more, increasing the demand for credit, and ultimately driving transaction volume higher. As economic conditions slow, those same consumers are slow to reduce spending, and are more likely to trade down than to cut out certain purchases, preserving transaction volume. Given that Visa is the middleman between consumers and merchants, it is well insulated from the volatility in interest rates. In some spending areas, consumers will pivot to using their credit cards more frequently as they become increasingly dependent on access to credit, at least in the near-term. Furthermore, most consumers will continue to pay at least the minimum payment during a slowdown, even if they are unemployed in order to maintain access to credit as it is the lifeline for many individuals and families, and it behooves them to stay current lest they want to be cut off.
International markets continue to be a source of growth for Visa as well with annual transaction revenue growing above a 30% pace as of the last quarter, and stated in the Q2 earnings report released today. This growth has occurred despite many analysts calling for an inevitable recession in Europe last year driven by disruptions caused by the war in Ukraine. Despite those recession calls, consumers in Europe and around the world have remained resilient.
Recent Performance
Visa’s stock is off to a solid start so far in 2023, higher by over 12% on a total return basis. This follows a small decline of about 3% for 2022. The stock has outperformed the S&P 500 so far this year and over the trailing 1-year period. The stock has performed in line with the S&P 500 on a total return basis since it went public in March of 2008.
YTD Total Return versus S&P 500 (Seeking Alpha)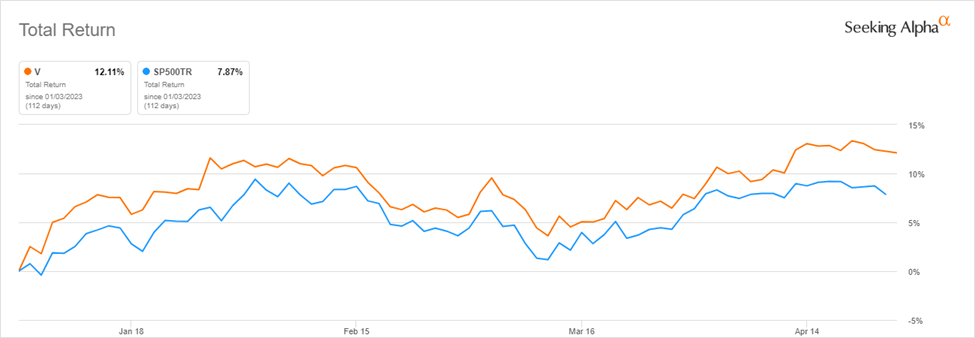
While I believe my thesis on consumer spending and growing transaction volume is valid, it is helpful to look at some additional data points.
Consumer spending made a brisk recovery in the wake of the pandemic and is now (maybe) starting to normalize, back to long-term trends. Despite the surge in spending over the last couple of years, household debt and debt service remain at a lower level than long-term averages. At the end of the first quarter of 2023, according to JPMorgan (JPM) and seen in the chart below, debt payments in the U.S. represented about 9.8% of disposable income, leaving most consumers in a position of strength for future spending. Of course, this is subject to change if/when the unemployment rate rises, forcing many households to rely more on credit cards for daily expenses.
Household Debt Service Ratio Since 1980 (JPMorgan)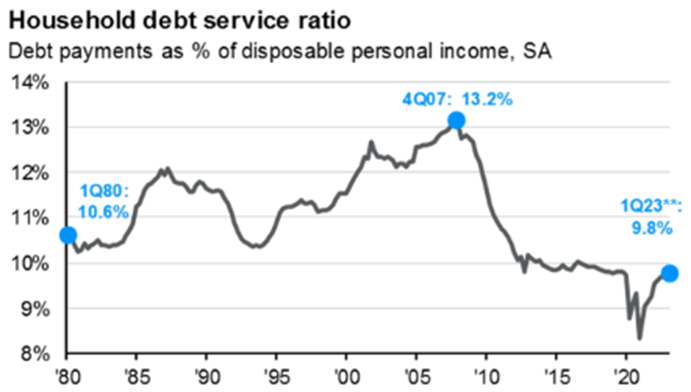
Unsurprisingly, given the surge in spending despite the highest inflation in 40 years, revolving consumer debt is at an all-time high of about $1.2 trillion as of the end of the first quarter, according to JP Morgan.
Revolving Consumer Debt Since 2000 (JPMorgan)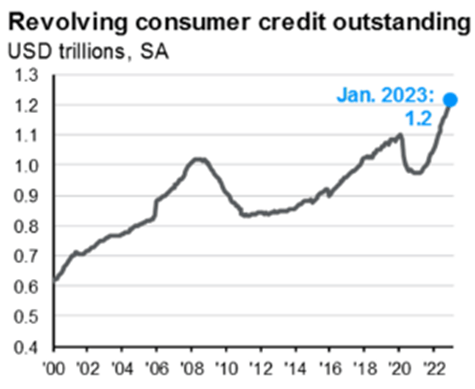
However, despite the rise in outstanding revolving consumer debt, as a percentage of disposable income it remains below the levels of the last 20+ except for the onset of the pandemic and economic lockdowns.
Revolving Consumer Debt As % of Disposable Income (JPMorgan)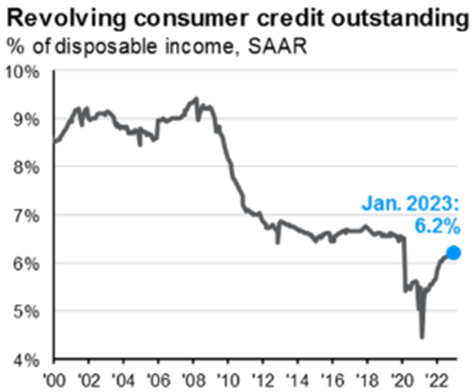
Valuation
While valuation metrics are elevated relative to the broader market, they are largely inline or below the 5-year averages for the company itself. The notable exception in the table below is the Price/Book ratio, which is more than 18% above the trailing 5-year average. Given the profitability, growth, and wide moat exhibited by the business, it is reasonable to expect to pay a premium valuation to own Visa.
|
Valuation Metric |
V |
V 5-Year Average |
% Difference to 5-Year Average |
|
P/E GAAP (FWD) |
28.37 |
32.37 |
-12.37% |
|
EV/Sales (FWD) |
14.98 |
16.80 |
-10.80% |
|
EV/EBITDA (FWD) |
21.41 |
24.16 |
-11.37 |
|
EV/EBIT (FWD) |
22.33 |
25.26 |
-11.62% |
|
Price/Cash Flow (FWD) |
25.42 |
29.37 |
-13.45% |
|
Price/Book (FWD) |
12.57 |
10.61 |
18.40% |
Valuation Versus Peers
Visa is trading inline or below its own historical valuation as well as compared to its rival Mastercard as illustrated in the table below. However, compared to American Express (AXP) and PayPal (PYPL), Visa is trading at a material premium across several metrics. This is likely due to the differences in business models that allow each to generate revenue in various ways. In addition to serving as a middleman, American Express also makes money from annual membership fees and interest income. PayPal also generates most of its revenue from facilitating transactions, but levies charges on both consumers and merchants using their services.
|
Valuation Metric |
V |
MA |
AXP |
PYPL |
|
P/E GAAP (FWD) |
28.37 |
30.67 |
14.53 |
22.08 |
|
EV/Sales (FWD) |
14.98 |
14.50 |
NA |
2.86 |
|
EV/EBITDA (FWD) |
21.41 |
23.77 |
NA |
11.11 |
|
EV/EBIT (FWD) |
22.33 |
25.01 |
NA |
12.55 |
|
Price/Cash Flow (FWD) |
25.42 |
29.22 |
11.29 |
11.74 |
|
Price/Book (FWD) |
12.57 |
44.43 |
4.17 |
3.71 |
Dividend
Visa’s dividend is well covered and growing at an impressive rate. Although the recent growth rates in the 18% range are below long-term averages, the company appears able to maintain this rate or better, an attractive factor for long-term investors.
|
Dividend Growth or Coverage Metric |
V |
V 5-Year Average |
% Difference to 5-Year Average |
|
Cash Dividend Payout Ratio (TTM) (Non-GAAP) |
20.94% |
21.23% |
-1.37% |
|
Interest Coverage (TTM) |
37.46 |
29.13 |
28.60% |
|
Total Debt/Capital (TTM) |
35.68% |
35.46% |
0.64% |
|
Dividend Growth Rate 5Y (CAGR) |
17.55% |
19.61% |
-10.49% |
|
1 Year Dividend Growth Rate (TTM) |
18.71% |
17.93% |
4.31% |
Profitability
The unique business model and global brand strength allows Visa to generate incredible returns on equity and assets driven by its high margins. The ease of use, security, and network effects, among other factors, create a wide moat around this business that would be difficult to replicate or replace.
|
Profitability Metric |
V |
V 5-Year Average |
% Difference to 5-Year Average |
|
Gross Profit Margin (TTM) |
97.58% |
96.91% |
0.69% |
|
Net Income Margin (TTM) |
50.28% |
50.77% |
-0.98% |
|
Return on Common Equity (TTM) |
43.63% |
37.80% |
15.42% |
|
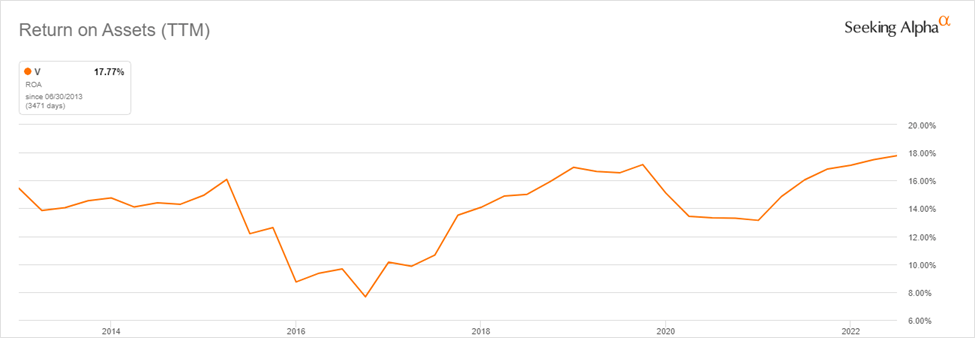
Return on Total Assets (TTM) |
17.77% |
15.46% |
14.94% |
|
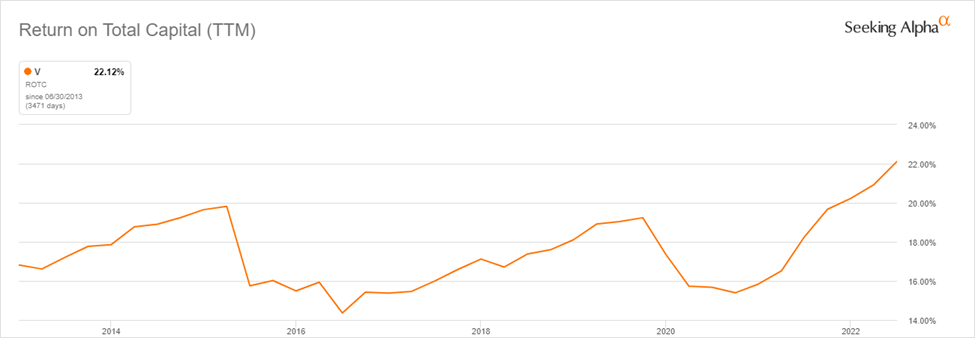
Return on Total Capital (TTM) |
22.12% |
17.90% |
23.55% |
The three charts below illustrate Visa’s ability to generate high, and growing, returns on equity, assets, and capital. In all three cases, Visa is more profitable and more efficiently operated than at any point over the last 10 years.
ROE (TTM) Last 10 years (Seeking Alpha) ROA (TTM) Last 10 years (Seeking Alpha) ROTC (TTM) Last 10 years (Seeking Alpha)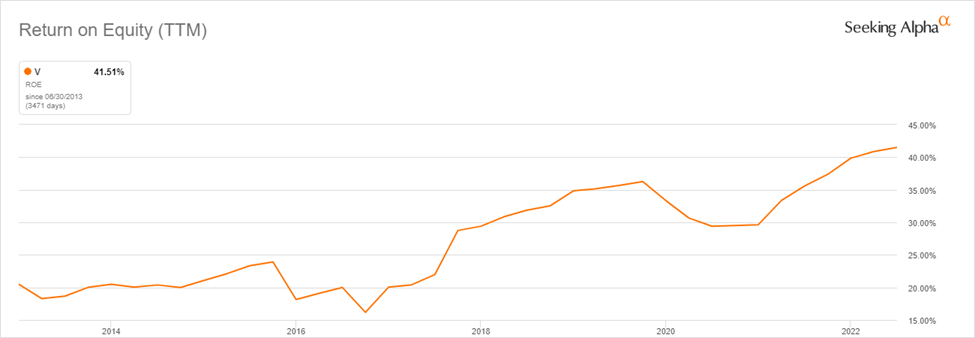
Risks
There are several risks to this thesis. The major risk would occur if there were a deep and sustained economic slowdown during which consumers not only traded down on purchases, but reduced transactions significantly. During the 2008-2009 recession, Visa’s revenue declined significantly, only to quickly rebound off its lows and reach new all-time highs within a year of bottoming. Other risks include those posed by competing services including both longtime rivals like Mastercard (MA) and American Express as well as other payment processors like PayPal, Venmo, Apple Pay (AAPL), etc. While it is reasonable to expect those other services to continue to grow, the total addressable market is also growing globally so the impact on market share in the near to intermediate term is unclear.
Final Thoughts
The uncertainty of economic conditions and their impact on financial markets persists and shouldn’t be surprising. Visa is a global brand that benefits from the growth of capitalism worldwide as it facilitates an ever-increasing number of transactions. The service it provides allows consumers to interact with vendors simply and quickly, and the network the company has built allows those transactions to occur seamlessly across national borders. As discussed above, there are numerous risks with this thesis in the near-term, but regardless of what happens then, Visa is well-positioned to thrive during most economic conditions and create value for shareholders. Although I believe Visa provides an attractive risk/reward for investors, any overweight or underweight position to its stock needs to be considered carefully to understand its impact on long-term total returns and long-term investment objectives. Thank you for reading. I look forward to seeing your feedback and comments below.
Editor’s Note: This article was submitted as part of Seeking Alpha’s Best Investment Idea For A Potential Recession competition, which runs through April 28. This competition is open to all users and contributors; click here to find out more and submit your article today!
Analyst’s Disclosure: I/we have a beneficial long position in the shares of V, AMZN, SPY either through stock ownership, options, or other derivatives. I wrote this article myself, and it expresses my own opinions. I am not receiving compensation for it (other than from Seeking Alpha). I have no business relationship with any company whose stock is mentioned in this article.
Seeking Alpha’s Disclosure: Past performance is no guarantee of future results. No recommendation or advice is being given as to whether any investment is suitable for a particular investor. Any views or opinions expressed above may not reflect those of Seeking Alpha as a whole. Seeking Alpha is not a licensed securities dealer, broker or US investment adviser or investment bank. Our analysts are third party authors that include both professional investors and individual investors who may not be licensed or certified by any institute or regulatory body.