Summary:
- Walmart was in an excellent defensive position in 2022.
- The company is continually adding to an enormous suite of products and services.
- Expected earnings growth is fairly low for the next several years.
- The Wall Street consensus rating continues to be a buy, with high expected return over the next year.
- The market-implied outlook to the middle of 2023 and to the start of 2024 is bullish, with low volatility.

Wolterk
Walmart (NYSE:WMT) shares weathered 2022 surprisingly well, with a total return of 0.39% over the past 12 months, as compared to -2.4% for the discount store industry group as a whole (as tracked by Morningstar), -1.7% for the Consumer Staples Sector SPDR ETF (XLP), and -12.8% for the S&P 500 (SPY). After reaching an all-time high closing price of $159.87 on April 21, 2022, WMT plummeted in mid-May of 2022 after reporting disappointing Q1 results. The shares bottomed out at around $118 in mid-June, subsequently climbing steadily to around $153 at the start of December and then declining with the rest of the market in the final weeks of the year.

Seeking Alpha
12-Month price history and basic statistics for WMT
Walmart is continuing to expand its range of products and services, with a significant focus on healthcare and finance. Walmart is the 5th-largest provider of prescription drugs in the U.S. and the 4th-largest retail seller of optometry products (glasses and contacts). The company is also investing in banking services and clearly has the potential to be a major presence. Walmart’s online sales continue to be a major focus, as the company competes with Amazon for digital retail dominance. While online sales growth has fallen since early 2021, 2022 was a good year, with revenue of $47.8 Billion, up 11% from 2021.
In the quest for dominance across the retail space, Walmart’s physical presence across America is a big advantage. It is estimated that 90% of the U.S. population lives within 10 miles of a Walmart store. The company is betting on the combination of local superstores that provide everything from banking to groceries to primary healthcare, along with a digital marketplace that competes with Amazon.
Walmart’s earnings have been growing steadily, albeit fairly slowly, over the past 4 years. The earnings miss in Q1 of 2022 was such a shock because the quarterly EPS was lower than in any of the 9 previous quarters. Improved results, both beating expectations, in Q2 and Q3 reassured the market and the shares have recovered. The longer-term outlook for growth is fairly weak, however, with a consensus expected EPS growth rate of 5.2% per year over the next 3 to 5 years, as compared to a median for the Consumer Staples sector of 8%.

ETrade
Trailing (4 years) and estimated future quarterly EPS for WMT. Green (red) values are amounts by which EPS beat (missed) the consensus expected value
For the YTD through Q3, WMT paid (see slide 6) $4.6 Billion in dividends and $7.7 Billion in share repurchases, for a total of $13.3 Billion returned to shareholders. The share repurchases supplement WMT’s low dividend yield of 1.59%, well below the Consumer Staples sector average of 2.58% (these are forward dividend yields). In mid-November, the company announced a plan to purchase another $20 Billion in shares.
Walmart’s fair valuation is an interesting question. WMT’s P/E has been on an upward trend for years, rising as the market became more tolerant of higher valuations. The TTM and forward P/E are markedly higher than the median values for Consumer Staples stocks. On the other hand, Walmart’s business is evolving and the historical valuations may not be very representative of the future.
I last wrote about WMT on September 24, 2021, almost 16 months ago, when I upgraded the stock from a hold to a buy. At that time, WMT was lagging the broader market as it tried to catch up with the ongoing shift favoring ecommerce. The forward P/E was 22.7, slightly lower than the value today, and the consensus expected EPS growth rate was 7.75% for the next 3 to 5 years. The Wall Street consensus rating for WMT was a buy and Seeking Alpha calculated the consensus 12-month price target to be 17.25% above the share price at that time. Along with looking at fundamentals and the Wall Street consensus, I rely on the market-implied outlook, a probabilistic price forecast that represents the consensus view implied by the prices of call and put options. The market-implied outlook was bullish to early 2022, shifting to neutral by mid-year, with an expected volatility of 21% to 23% (annualized). As a rule of thumb for a buy rating, I want to see an expected 12-month total return that is at least ½ the expected volatility. Taking the Wall Street consensus price target at face value, WMT considerably exceeded this threshold (17.25% expected price appreciation plus 1.54% dividend yield vs. 23% volatility). With the bullish outlook from Wall Street and the generally favorable view from the options market, a buy rating was a natural choice. In the period since, WMT has essentially broken even on total return as compared to a total return of -10.4% for the S&P 500.

Seeking Alpha
Previous post on WMT and subsequent performance vs. the S&P 500
For readers who are unfamiliar with the market-implied outlook, a brief explanation is needed. The price of an option on a stock reflects the market’s consensus estimate of the probability that the stock price will rise above (call option) or fall below (put option) a specific level (the option strike price) between now and when the option expires. By analyzing the prices of call and put options at a range of strike prices, all with the same expiration date, it is possible to calculate the probable price forecast that reconciles the options prices. This is the market-implied outlook. For a deeper discussion than is provided here and in the previous link, I recommend this outstanding monograph published by the CFA Institute.
I have calculated updated market-implied outlooks for WMT and compared these with the current Wall Street consensus outlook in revisiting my rating.
Wall Street Consensus Outlook for WMT
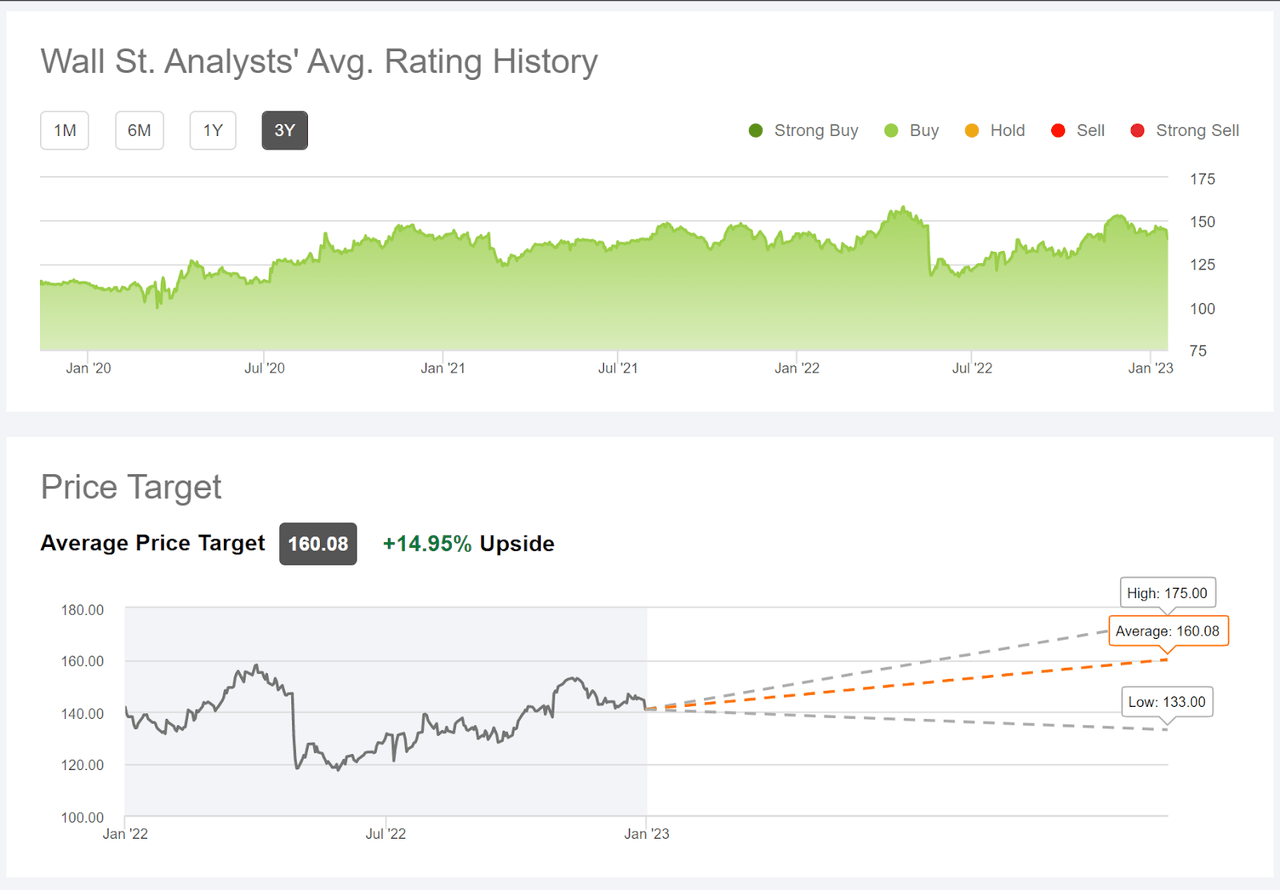
Seeking Alpha calculates the Wall Street consensus outlook for WMT by aggregating the views of 40 analysts who have published ratings and price targets over the last 90 days. The consensus rating is a buy, as it has been for all of the past 3 years. The consensus 12-month price target is 14.95% above the current share price.

Seeking Alpha
Wall Street analyst consensus rating and 12-month price target for WMT
Of the 40 analysts in the consensus cohort, 20 have assigned a Strong Buy rating, 8 have assigned a Buy rating, and the remaining 12 have a hold rating.
Over the past 3 years, during which the consensus rating has been a buy, WMT had annualized total return of 8.65% per year, as compared to 7.4% per year for the S&P 500 (SPY).
Market-Implied Outlook for WMT
I have calculated the market-implied outlook for WMT for the 4.9-month period from now until June 16, 2023 and for the 12-month period from now until January 19, 2024, using the prices of call and put options that expire on these dates. I selected these specific expiration dates to provide a view to the middle of 2023 and through the entire year.
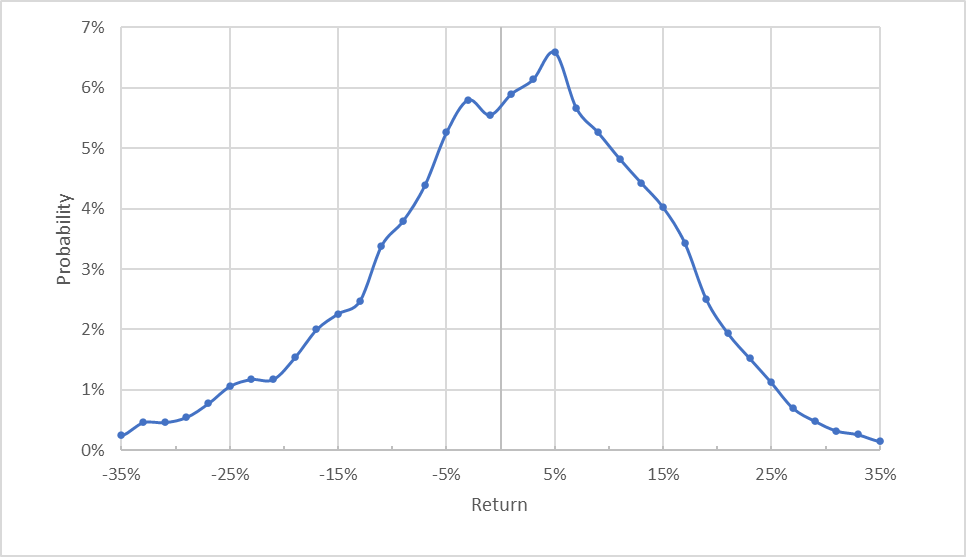
The standard presentation of the market-implied outlook is a probability distribution of price return, with probability on the vertical axis and return on the horizontal.

Geoff Considine’s calculations using options quotes from ETrade
Market-implied price return probabilities for WMT for the 4.9-month period from now until June 16, 2023
The projected distribution of returns is tilted to assign elevated probabilities to positive returns. The maximum probability corresponds to a price return of 5% over this period. The expected volatility calculated from this distribution is 23.8% (annualized). For comparison, ETrade calculates an implied volatility of 22% for the options with this expiration date.
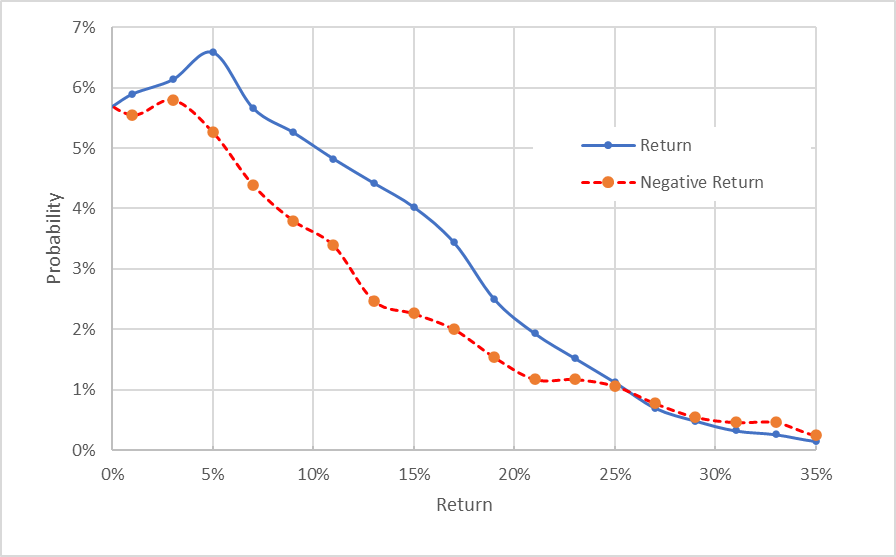
To make it easier to compare the relative probabilities of positive and negative returns, I rotate the negative return side of the distribution about the vertical axis (see chart below).

Geoff Considine’s calculations using options quotes from ETrade
Market-implied price return probabilities for WMT for the 4.9-month period from now until June 16, 2023. The negative return side of the distribution has been rotated about the vertical axis
This view shows the asymmetries in the probabilities of positive and negative returns of the same size, with a substantial tilt favoring positive returns (the solid blue line is well above the dashed red line over a wide range of the most probable outcomes). This is a bullish market-implied outlook to the middle of 2023.
Theory indicates that the market-implied outlook is expected to have a negative bias because investors, in aggregate, are risk averse and thus tend to pay more than fair value for downside protection. There is no way to measure the magnitude of this bias, or whether it is even present, however. The expectation of a negative bias further reinforces the bullishness of this outlook.
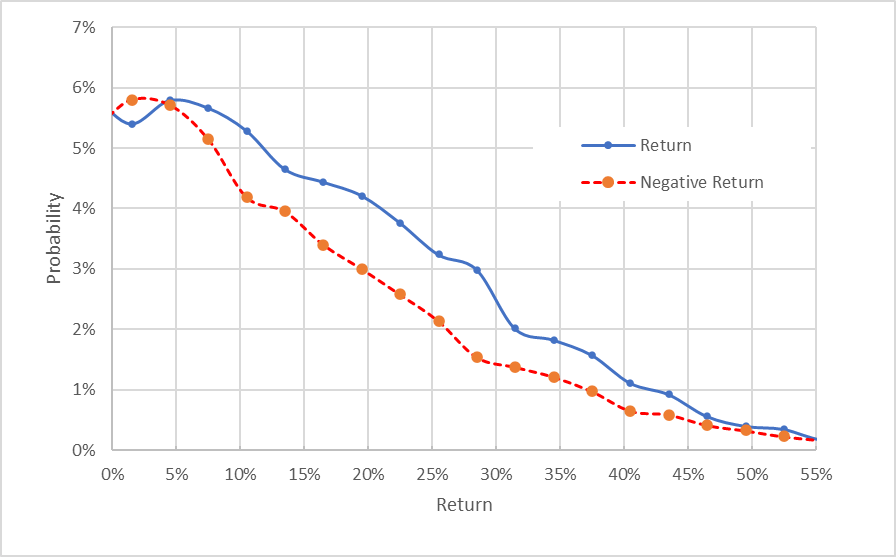
The market-implied outlook for the next 12 months, calculated using the price of options that expire on January 19, 2024, is also bullish. The probabilities of positive returns are consistently higher than the probabilities of negative returns of the same magnitudes. The expected volatility calculated from this distribution is 23.5% (annualized).

Geoff Considine’s calculations using options quotes from ETrade
Market-implied price return probabilities for WMT for the 12-month period from now until January 19, 2024. The negative return side of the distribution has been rotated about the vertical axis
During trading today, I purchased shares of WMT for $139.81 and sold call options with a strike of $140, expiring on January 19, 2024, for $14.26. This net position is expected to provide total income (including expected dividends totaling $2.24) of $16.50 over the next year, for a total income yield of 11.8%. With expected volatility of 23% to 24%, this is an attractive level of income.
Summary
Walmart navigated COVID and 2022’s surging inflation remarkably well. The company is in a unique position to consolidate digital and on-site retail sales across a wide swath of product types, as well as health and financial services. The valuation looks quite high, especially given the fairly low consensus outlook for earnings growth. On the other hand, the company has growing market power, an advantage that is hard to quantify. The Wall Street consensus rating on WMT continues to be a buy. Following the analyst consensus over the past 3 years has been advantageous for investors. The consensus 12-month price target for WMT implies an expected total return of 16.54% over the next year (including dividends). Taking the consensus at face value, this level of expected return is attractive relative to WMT’s low expected volatility (23%-24%). To put this level of return in context, the 70th percentile rolling 12-month total return for WMT over the last 30 years is 16.5%. The market-implied outlooks to the middle of 2023 and into the start of 2024 are both bullish. I am maintaining a buy rating on WMT. Because of the bullish view in the options market, selling covered calls provides an attractive income yield, 11.8%, which is very close to the 61st percentile rolling 12-month total return for WMT over the past 30 years, 11.9%. For income-oriented investors or those who have concerns about WMT’s valuation, a covered call strategy is worth considering.
Disclosure: I/we have a beneficial long position in the shares of WMT either through stock ownership, options, or other derivatives. I wrote this article myself, and it expresses my own opinions. I am not receiving compensation for it (other than from Seeking Alpha). I have no business relationship with any company whose stock is mentioned in this article.
Additional disclosure: I have sold covered calls against my long position, as described in the post.
