Summary:
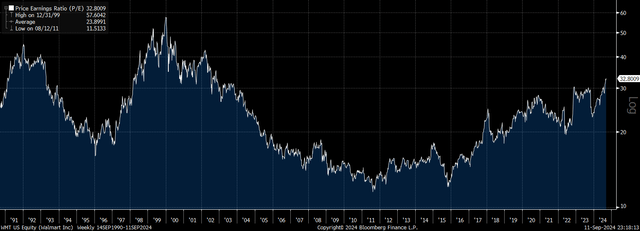
- Walmart’s PE ratio has surged to 33x, its highest since 2002, while the rise in capex has seen the price-to-free cash flow ratio rise above 50x.
- The company’s earnings growth is unlikely to justify current valuations, amid the limited potential for significant sales growth amid rising competition and the company’s already huge scale.
- Upside risks include continued multiple expansion and potential margin growth from high-margin segments like advertising, though these factors already appear priced in.
snyferok
Walmart (NYSE:WMT) has seen its share price surge over recent years, making it one of the best performing US mega cap stocks. However, in contrast to many other companies, Walmart’s earnings growth has been poor, which has driven Walmart’s PE ratio to 33x, its highest multiple since 2002 and a 65% premium to the average S&P 500 stock. Even this lofty figure understates the true multiples that investors are paying for the stock today, as capex has surged relative to depreciation. On a price to free cash flow basis, the earnings multiple rises to above 50x. The earnings growth required to justify current valuations is highly unlikely to be achieved given the company’s already huge scale.
From Fair Value To Bubble Despite Sluggish Earnings Growth
At its lows in 2015, Walmart traded at a PE ratio of just 11x, with a free cash flow yield of a healthy 9% and a respectable dividend yield of 3.5%. At these lows, in order to post long-term returns of 10% in line with historical average market returns, dividends would have to grow by around 6.5% annually on a per-share basis. What ensued over the next 9 years was just 2.3% annual dividend growth, driven entirely by share buybacks. Despite this slow growth, valuations surged, driving almost 20% annual returns. This has left WMT extremely overvalued. At 33x, the trailing PE ratio is now 50% above its long-term median and a full standard deviation above its long-term mean, trading in the 80th percentile of readings.
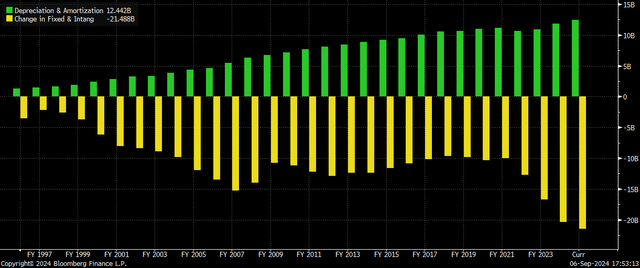
This 33x PE may actually understate how much investors are paying for Walmart’s stock. Due to the recent sharp rise in capital expenditure relative to depreciation expenses, free cash flows have significantly underperformed earnings. As a result, the trailing price to free cash flow ratio now sits at 53x, the 8th highest out of all US mega caps, just behind Costco (COST), which I covered recently here.
Walmart Capex Vs Depreciation (Bloomberg)
Investors Banking On An Unlikely Earnings Boom
It is difficult to figure out exactly why Walmart has seen such a surge in valuation multiples. While the broader market has seen an expansion in multiples, Walmart’s PE ratio has doubled relative to that of the S&P 500 since 2015.
Generally speaking, earnings multiples tend to decline with company size to reflect the expected slowdown in growth owing to existing market size. This growth slowdown has been in effect in the case of Walmart since 2010, when its sales as a share of S&P 500 sales peaked at 5% and its earnings share peaked at 3%. These figures now sit at 4% and 1% respectively.
For investors to justify paying 53x free cash flow, they must expect a major acceleration in earnings growth over the coming years. However, Walmart’s still-dominant share of the US retail market will make it difficult to grow sales significantly, while increasing competition from Costco and Amazon (AMZN) is likely to keep margins depressed.
As has been the case over the past decade, sales growth is likely to capped by real GDP growth, which itself is on a declining long-term trend, while a recession over the next 12 months is looking increasingly likely based on the price action of short-term interest rates. Even if Walmart can manage to grow nominal sales at a rate of trend GDP growth of 4%, and net margins remain at current levels, the 53x FCF ratio means that returns are likely to be capped at 6% annually going forward. This reflects 4% growth plus the 2% FCF yield returned to shareholders in the form of buybacks and dividends. While this may not seem too bad, if the required rate of return on Walmart’s stock were to rise back to 10% for any reason, this would require a two-thirds decline in the stock price to drive the free cash flow yield back up to 6%.
Upside Risks To Bearish View
The main risk to my bearish thesis in the short term is a continuation of the multiple expansion we have seen since 2011, and this will depend on overall market sentiment, given that Walmart trades with a 90% correlation with the S&P 500 on any given day. Longer term, the main risk comes from the potential for the company to leverage its huge customer base to generate service revenue and expand margins. The company’s advertising revenue grew by 28% last fiscal year to reach USD3.4bn, and while this is just a fraction of total revenue, the high margins from this segment could provide the company with potential for significant margin expansion in the future. That said, all the good news already appears priced in at these extreme multiples.
Analyst’s Disclosure: I/we have a beneficial short position in the shares of WMT either through stock ownership, options, or other derivatives. I wrote this article myself, and it expresses my own opinions. I am not receiving compensation for it (other than from Seeking Alpha). I have no business relationship with any company whose stock is mentioned in this article.
Seeking Alpha’s Disclosure: Past performance is no guarantee of future results. No recommendation or advice is being given as to whether any investment is suitable for a particular investor. Any views or opinions expressed above may not reflect those of Seeking Alpha as a whole. Seeking Alpha is not a licensed securities dealer, broker or US investment adviser or investment bank. Our analysts are third party authors that include both professional investors and individual investors who may not be licensed or certified by any institute or regulatory body.

