Summary:
- Walmart faces challenges in the ever-evolving retail landscape, but has demonstrated resilience and steady growth.
- The company’s U.S. operations have shown dependable revenue growth, but face risks from fuel prices.
- Sam’s Club, another revenue pillar for Walmart, has experienced a steeper decline in growth and may need to revisit its business model.
- Yields high return on invested capital.
- Strong earnings should allow management to continue dividend payments.
bgwalker
Thesis Statement
Walmart (NYSE:WMT) presents a compelling dichotomy as an investment vehicle: on the one hand, it has consistently demonstrated resilience through steady growth and reliable dividend yields; on the other, investors would be prudent to scrutinize the intricate operational challenges and Walmart’s long-term viability in an ever-evolving, hypercompetitive retail environment.
Overview: A Multifaceted Retail Landscape
Walmart is a key player in the labyrinthine world of omni-channel retail, with a sprawling presence across diverse global markets. It faces a gauntlet of competition, ranging from traditional brick-and-mortar discount and department stores to sophisticated e-commerce platforms. Many of these competitors wield formidable influence, whether at a regional, national, or global level.
Moreover, the retail landscape is subject to an array of externalities, including but not limited to climate change, global health crises, shifts in consumer behaviour, and macroeconomic volatility. These dynamic forces exert influence not merely on Walmart but serve as industry-wide disruptors.
Strategic Financial Imperatives
Walmart has articulated a comprehensive financial strategy encapsulated in three pillars:
- Growth: Commitment to providing an impeccable, frictionless omni-channel shopping experience.
- Margin: A focus on bolstering operating income margins via strategic initiatives and an agile business mix.
- Returns: Rigorous discipline in capital allocation to optimise Return on Investment, bolstered by margin accretion.
Analyzing Growth Metrics for Walmart’s U.S. Operations
Walmart U.S. Revenue Dynamics: A Case of Measured Stability
Walmart’s U.S. operations have historically displayed a pattern of dependable revenue growth, albeit with a recent, discernible deceleration. Notably, escalating fuel prices pose a nascent risk to revenue stability.
Strategic Implications and Outlook for Walmart U.S.
Walmart U.S. will likely experience more restrained revenue growth if this trend persists. The company has proactively invested in renewable energy to counteract the volatility of fuel prices, a strategy that has succeeded in other sectors, such as Unilever’s “Sustainable Living” initiative.
Sam’s Club Revenue Dynamics: A Steeper Descent
Sam’s Club, another significant revenue pillar for Walmart, has seen a sharper decline in its growth rate, accentuated by the negative impact of fuel prices.
Strategic Implications and Outlook for Sam’s Club
Considering the declining growth trajectory, Sam’s Club may need to revisit its business model. Leveraging data analytics to dissect consumer behaviour, similar to Amazon’s (AMZN) customer-centric model, could provide actionable insights for revitalizing growth.
Total U.S. Operations: An Aggregated View
When aggregating revenue metrics from both Walmart U.S. and Sam’s Club, there’s a moderation in growth compared to the previous fiscal year. This is occurring against increasing market share for competitors like Amazon and Target (TGT).
Strategic Implications and Outlook for Total U.S. Operations
While the overall revenue outlook remains positive, the deceleration may hint at market saturation or elevated competitive pressure. Walmart may need to reevaluate its strategic positioning in light of these challenges.
A Deep Dive into Walmart’s Margin Metrics
Unpacking Revenue Streams: The Paradox of Positive Yet Decelerating Growth
Walmart has charted an optimistic course, experiencing revenue growth despite market uncertainties. However, a nuanced look reveals that its most recent quarter’s 5.9% increase in net sales decelerates compared to an 8.2% increase in the same period last fiscal year.
Gross Profit Margins: A Telling Uptick
A modest increase in gross profit margins indicates Walmart’s potential shift toward higher-margin goods or effective cost optimization.
Strategic Insights and Future Outlook: Gross Profit Margins
Walmart could capitalize on this uptick by refining its product mix or adopting data-driven cost management solutions, akin to the approach used by Procter & Gamble (PG) to enhance its margins.
Operating Expenses: Stability Amid Headwinds
Walmart’s operational stability is evident in its controlled Operating, Selling, General, and Administrative expenses, a crucial marker of long-term viability. However, these costs remain elevated when calculated as a proportion of net sales.
Strategic Insights and Future Outlook: Operating Expenses
Maintaining a disciplined approach to controlling operational costs will be pivotal for Walmart. Adopting technologies like AI for supply chain optimization, as Nike (NKE) employs, could offer avenues for further cost reduction.
Operating Income: The Efficiency Quotient
An upward trajectory in operating income, coupled with a proportionate increase in its relation to net sales, signifies Walmart’s adeptness in revenue conversion.
Strategic Insights and Future Outlook: Operating Income
If Walmart continues to focus on operational efficiencies, sustained growth in operating income is plausible.
Caveats and Anomalies: Areas Requiring Scrutiny
The decelerating pace of revenue growth necessitates close monitoring. Additionally, elevated OSG&A expenses, while stable, limit operational flexibility and may compromise future profitability.
A Comprehensive Examination of Walmart’s Free Cash Flow Dynamics and Financial Health
Free Cash Flow Volatility: A Call to Action
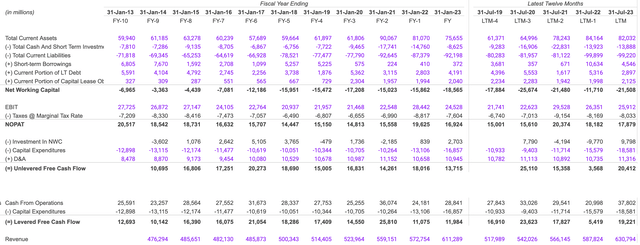
Walmart’s cash flow profile reveals stark fluctuations, presenting an exigency for reevaluating its cash management paradigms.
Walmart could benefit from employing predictive analytics to anticipate cash flow needs, a strategy successfully utilized by Microsoft to stabilize its cash reserves.
Working Capital Management: A Liquidity Conundrum
A sustained trend of negative net working capital may appear advantageous in the short term, but it signals potential liquidity issues.
Walmart might consider revising payment terms with suppliers or optimizing inventory levels, drawing inspiration from Toyota’s Just-in-Time inventory management, to improve its working capital situation.
Quality of Earnings: A Multifaceted Analysis
While the negative net working capital suggests operational efficiency, it raises questions about Walmart’s liquidity. Moreover, fluctuations in net working capital investment and capital expenditures indicate an inconsistent approach to long-term planning.
Levered and Unlevered Free Cash Flows: Stability vs. Opportunity
Although Walmart’s levered and unlevered free cash flows are generally positive, their volatility calls for a more strategic approach. Walmart should consider debt restructuring or diversifying its income streams to create a more stable cash flow profile.
Interpretation of DuPont Analysis Results for Walmart and Peers in Q2 2023
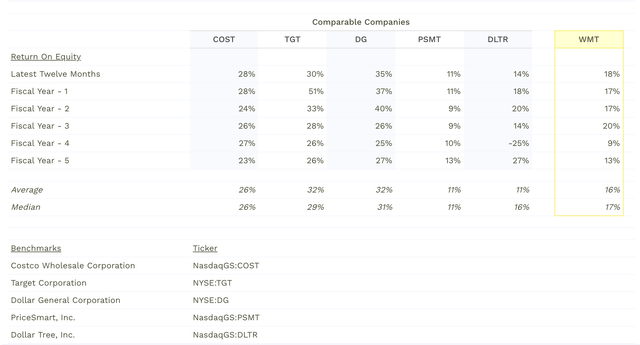
A DuPont analysis can offer valuable insights into a company’s operational efficiency, financial leverage, and overall profitability in the ever-competitive retail landscape. I conduct such an analysis for Walmart, benchmarking it against industry peers like Dollar General, Target, and Costco.
Return on Equity: A Measure of Shareholder Value
Empirical Evidence
Walmart posts an ROE of 18%, which is markedly below the industry benchmark of 26-32%. For context, Dollar General and Target lead the pack with ROEs of 35% and 30%, respectively. Walmart’s five-year ROE trend oscillates between 9% and 20%, averaging 16%.
Strategic Implications and Actionable Insights
The suboptimal ROE necessitates a comprehensive reassessment of Walmart’s financial and operational strategies. Target, for example, enhanced its ROE substantially by diversifying its product range and leveraging data analytics for inventory management. Walmart could benefit from adopting machine learning algorithms to optimize stock levels and improve asset utilization.
Net Profit Margin: The Operational Efficiency Quotient
Empirical Evidence
Walmart’s Net Profit Margin hovers around 2%, lagging behind the industry standard of 3-6%.
Strategic Implications and Actionable Insights
The consistent margin bottleneck points to endemic operational inefficiencies. Case in point: Dollar General amplified its margins by revolutionizing supplier negotiations and adopting Just-in-Time inventory systems. Walmart could explore similar supply chain optimizations through blockchain technologies that ensure transparency and efficiency.
Asset Turnover: Gauging Revenue-Generating Capability
Empirical Evidence
Walmart’s asset turnover ratio stands at an impressive 2.5x, outperforming Dollar General but falling short of Costco.
Strategic Implications and Actionable Insights
Costco’s success in this area is largely attributed to its technological investments in enhancing the customer experience. Walmart could emulate this by investing in customer relationship management software and advanced analytics to personalize the shopping experience, maximizing revenue per asset.
Equity Multiplier: The Leverage Dilemma
Empirical Evidence
With an equity multiplier ranging from 2.6x to 3.2x over five years, Walmart maintains a balanced financial leverage approach that aligns with industry norms.
Strategic Implications and Actionable Insights
While moderate leverage safeguards financial health, there’s room for Walmart to adopt more aggressive growth strategies, perhaps through acquisition or diversification, without incurring undue risk.
Summative Insights: Walmart’s Financial Roadmap
Walmart’s asset utilization and financial leverage metrics are commendable. However, it lags in ROE and Net Profit Margin, raising questions about its operational efficiencies and overall profitability. A fusion of data-driven operational shifts and well-calibrated financial strategies could be the linchpin for sustained growth and competitive advantage.
Valuation of Walmart: A Multi-Faceted Approach to Shareholder Returns
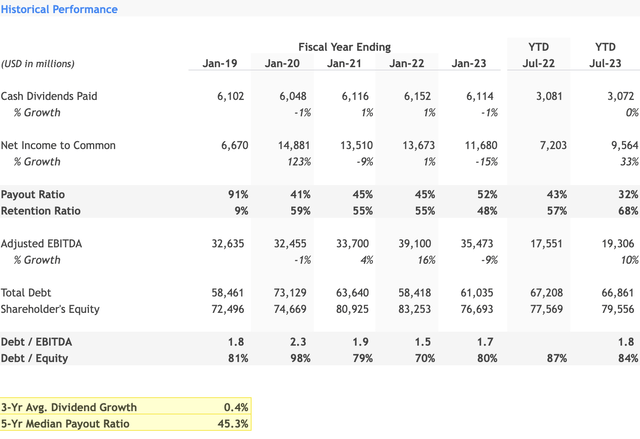
In today’s intricate corporate finance terrain, free cash flow often takes center stage as the foremost determinant of investor returns. Yet, in my valuation, I diverge from the conventional path by adopting a dividend-oriented lens to scrutinize Walmart’s financial prospects, aiming to furnish a nuanced understanding of its shareholder yield.
Key Financial Metrics Informing Dividend Policy
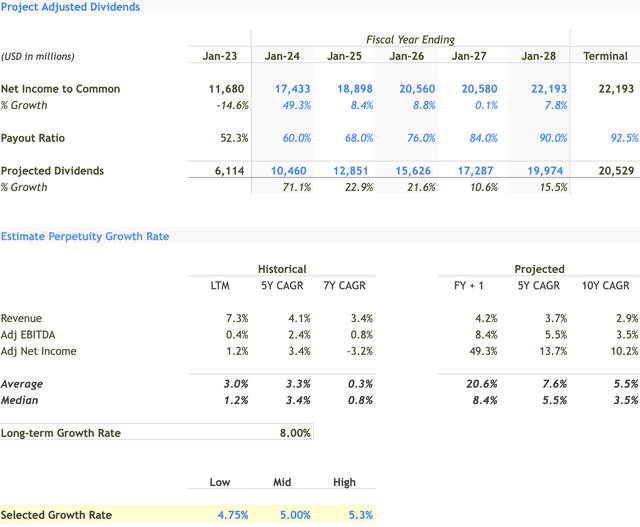
Net Income to Common Shareholders: Walmart’s financial model forecasts a robust growth trajectory in net income, signalling a healthy fiscal outlook.
Payout Ratio: This crucial metric, representing the percentage of net income designated for dividends, is projected to rise. This trend indicates Walmart’s increasing commitment to shareholder enrichment.
Projected Dividends: Notably, the anticipated growth in dividend payouts is fueled by burgeoning net income and an elevated payout ratio.
Revenue and Profitability Analysis
Historical Revenue: Data reveal that the Last Twelve Months registered a 7.3% uptick in revenue. Meanwhile, the 5-year and 7-year Compound Annual Growth Rates stood at 4.1% and 3.4% respectively.
Projected Growth:
Projected Revenue: The model anticipates a 5-year CAGR of 3.7% and a 10-year CAGR of 2.9%.
Interpretation: While Walmart has consistently expanded its revenue streams, a slight deceleration in growth rates is expected, potentially owing to market saturation or increased competition.
Profit Margins and Payout Policy
Net Income Fluctuations: The model projects erratic net income trends, including a 14.6% contraction in January 2023 and a subsequent 49.3% surge in January 2024, eventually stabilizing into single-digit growth rates.
Increasing Payout Ratio: The payout ratio is expected to ascend from 52.3% to 92.5% by the terminal year, which may indicate less capital being reinvested in the business.
Risk and Uncertainty: A Quantitative Perspective
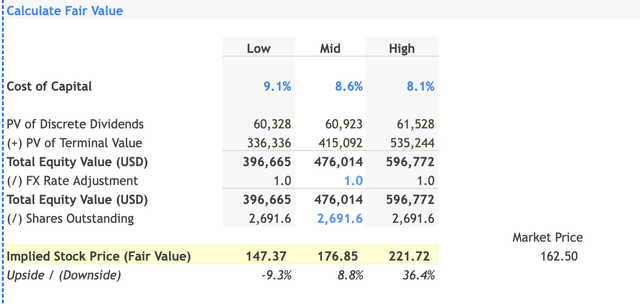
Cost of Capital: The discount rate—between 9.1% and 8.1%—is a pivotal variable in the Discounted Cash Flow model, significantly impacting the stock’s fair value.
Present Value of Dividends: The PV of dividends for discrete and terminal phases fluctuates between $60,328 million and $535,244 million, contingent on the selected discount rate.
Fair Value and Market Sensitivity: The model suggests a fair value per share ranging from $147.37 to $221.72, depending on the discount rate employed. This range indicates the stock’s sensitivity to economic variables and presents both upside and downside risks.
Concluding Remarks and Strategic Insights
Walmart is a financially stable, mature entity with moderate growth prospects. Although a consistent dividend payer, the rising payout ratio necessitates a prudent assessment of its future reinvestment capabilities. The stock may offer short-term appeal for dividend-focused investors, but its long-term growth narrative calls for judicious scrutiny.
Walmart Investment Analysis: A Prudent “Hold” Strategy for Diversified Portfolios
Short-Term Investment Outlook: A Promising Narrative
For investors operating within a short-term investment window, Walmart offers compelling incentives. The retail behemoth is committed to enhancing shareholder value through consistent dividend payouts— a trajectory corroborated by recent fiscal projections. Furthermore, the stock displays a moderate upside potential, attenuating the inherent risks tied to market fluctuations in the short run.
Long-Term Investment Landscape: Caveats and Considerations
In terms of Walmart’s long-term growth outlook, the situation is nuanced. While the projections indicate a rise in the payout ratio— the percentage of net income allocated for dividends—this could constrain the company’s reinvestment capabilities, tempering future growth. As such, long-term investors should exercise prudent judgment, cognizant of these intrinsic limitations.
Final Investment Verdict: A Measured “Hold”
Within a diversified portfolio, Walmart serves as a stable, income-generating asset. While it offers a degree of assurance for short-term yield, long-term investors need to fully grasp the constraints imposed by a progressively rising payout ratio. Therefore, the prudent investment recommendation for Walmart is a measured “Hold.”
Analyst’s Disclosure: I/we have no stock, option or similar derivative position in any of the companies mentioned, and no plans to initiate any such positions within the next 72 hours. I wrote this article myself, and it expresses my own opinions. I am not receiving compensation for it (other than from Seeking Alpha). I have no business relationship with any company whose stock is mentioned in this article.
Seeking Alpha’s Disclosure: Past performance is no guarantee of future results. No recommendation or advice is being given as to whether any investment is suitable for a particular investor. Any views or opinions expressed above may not reflect those of Seeking Alpha as a whole. Seeking Alpha is not a licensed securities dealer, broker or US investment adviser or investment bank. Our analysts are third party authors that include both professional investors and individual investors who may not be licensed or certified by any institute or regulatory body.


