Summary:
- Walmart’s international division is key to growth, focusing on high-growth markets like Mexico and China, while US growth aligns with the economy.
- Operating margins have declined but show signs of stabilization; international margins are improving due to restructuring.
- Walmart’s stock appears overpriced relative to its intrinsic value, with insider trading indicating potential overvaluation.
- Recommend reducing overweight positions in Walmart, taking some trading profits, but not selling all holdings due to potential long-term stability.
jetcityimage/iStock Editorial via Getty Images
Author’s Preamble
I have an actively managed investment portfolio, and I regularly trade stocks within my investing universe (or watch list) depending upon the stock’s price relative to my estimate of its intrinsic value and its market trading patterns (technical indicators).
I share my valuations with readers to get feedback and to gain new insights from other knowledgeable investors.
It has been nearly 2 years since I last wrote about Walmart (Walmart: A Low Risk Play During Market Uncertainty). It’s time to update my thesis so let’s dig in.
Company Description
Walmart (NYSE:WMT) is a global retailer and wholesaler (primarily of grocery and general merchandise items). It also has a significant eCommerce operation. Although predominantly a US company (82% of revenues) it also has operations in Africa, Canada, Central America, Chile, China, India and Mexico.
Since the 1990’s WMT has progressively expanded its geographical footprint through a series of acquisitions. Over the last few years WMT has started to strategically divest out of some international locations because on their limited growth prospects and low margins. Operations have been sold in Argentina (November 2020), the United Kingdom (February 2021), Japan (March 2021) and some parts of Africa (December 2022). In many cases the sales of these businesses has generated significant book losses relative to what WMT had previously paid.
I estimate that WMT is the largest publicly owned retailer in the world by both market capitalization ($739 billion) and annual sales turnover ($665 billion). WMT is currently the 11 th largest public company in the US by market capitalization.
WMT is organized into 3 reportable divisions as shown in the following table (data is for the trailing 12 months at the end of Q3):
Author’s compilation using data from Walmart’s 10-Q filings.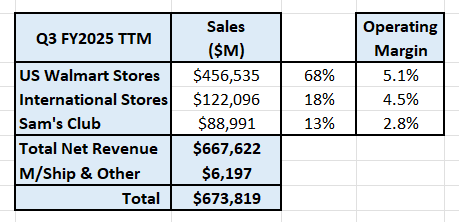
It should be noted that Walmart’s financial year ends in January.
Business Overview
Walmart commenced operations with its first store in 1945. The company’s customer value proposition has always been based on convenience with a wide variety of products. It was the first retailer to implement the concept of “everyday low pricing”.
Addressable Market
WMT targets 2 very large markets – grocery and general merchandise. This is demonstrated by the US sales by category at the end of FY2024:
Author’s compilation using data from Walmart’s 2024 10-K filing.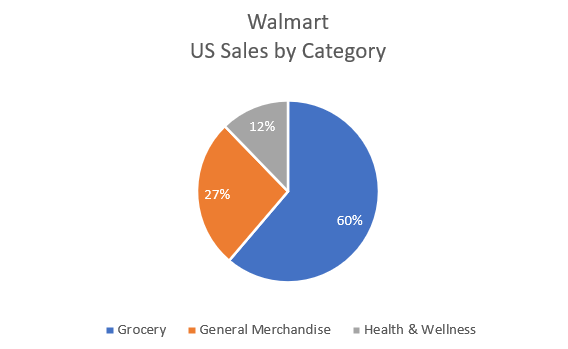
Estimates of the current size of these 2 markets are:
Global Food and Grocery
According to Grand View Research the global food and grocery market at the end of FY2023 was valued at $US 11,933 billion and is expected to grow at a compound rate of 3% per year until 2030.
Global Discount Stores
According to Verified Market Research the global discount store market at the end of FY2022 was $510 billion in size and is projected to grow at 5% per year through to 2030.
Now looking at the historical revenues generated by each of WMT’s divisions:
WMT US Stores & US Sam’s Club
The US stores (including Sam’s Club stores) are the cornerstone of WMT’s operations. Revenue growth unsurprisingly peaked at the end of the Covid pandemic and growth has been slowing every quarter ever since as shown by the following chart:
Author’s compilation using data from Walmart’s 10-K filings.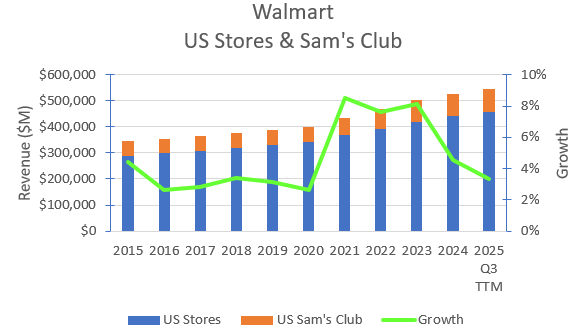
The chart shows that WMT’s US store revenue growth has now returned to its pre-Covid levels.
Of course, an added revenue bonus from the Sam’s Club operations is the separately reported revenues from membership fees. In FY2024, memberships contributed $5,488 M which falls straight to the bottom line and is an added kicker to the system’s profitability.
International Division
WMT’s international expansion started in FY1992 with the formation of a joint venture in Mexico. Over the years the company has increased its international footprint through a series of acquisitions (many of which have proven to be poor investments). The following chart shows the international division’s revenues for the last 10 years:
Author’s compilation using data from Walmart’s 10-K filings.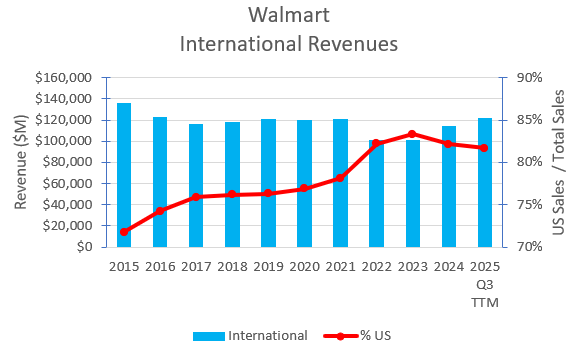
The company’s international expansion peaked in FY2014 and a period of stagnation prompted WMT to sell out of the relatively low growth / low margin markets (Japan, UK and some parts of Africa) where the company was probably struggling to achieve acceptable returns on capital.
The key international markets for WMT are now Mexico, central America and China. These markets currently provide almost 60% of the international division’s revenues and in the last 12 months revenues in these locations have grown by 17%.
Given the growing political tensions between China and the US, investors may ponder the medium-term prospects for their Chinese investments.
Walmart’s Strategy
Walmart’s current strategy is unsurprising for a mature company. It is focusing on strong and efficient growth opportunities within its existing footprint.
The key top-line performance metrics relate to increasing same store and club sales whilst expanding their eCommerce and omni-channel offerings. The remaining elements of the strategy relate to optimizing internal efficiencies to reduce costs and maintain relatively high returns on invested capital.
The success of the strategy should be observable if revenue growth exceeds the sector average, margins increase, and higher returns on capital are achieved. We will review Walmart’s performance against these metrics in the remainder of the report.
Walmart’s Historical Financial Performance
Revenues and Adjusted Operating Margins
WMT’s consolidated historical revenues and adjusted operating margins are shown in the chart below:
Author’s compilation using data from Walmart’s 10-K filings.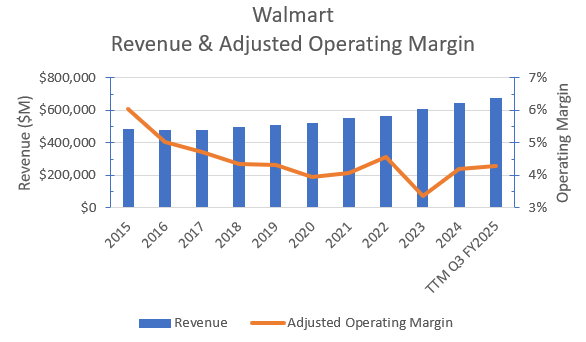
It should be noted that I have adjusted WMT’s reported Operating Income for the impact of the interest charge embedded within the operating lease expense and removing any identifiable one-off expenses.
The chart highlights:
- Revenues have been growing at nearly 5% compounding over the last 10 years (although at a slower rate over the last 5 years due to the impacts of Covid and the sale of several international businesses).
- Operating margins have been in decline for nearly 10 years (although there is evidence that they may have recently bottomed out).
WMT’s financial data indicates that the company has been reasonably diligent in maintaining its gross margins and the decline in operating margins has been caused by increasing overhead expenses. Over the last 10 years gross margins have moved cyclically but are now back to the same level as shown in the following chart:
Author’s compilation using data from Walmart’s 10-K filings.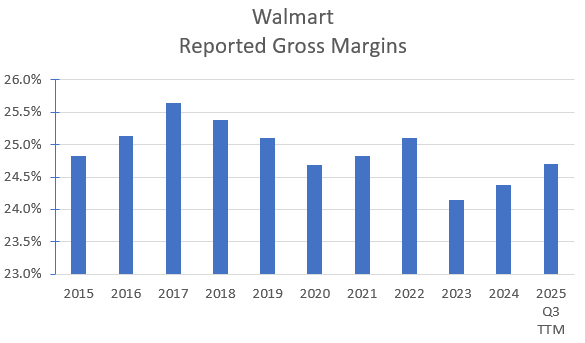
The following chart shows the historically reported margins for Walmart’s operating divisions:
Author’s compilation using data from Walmart’s 10-K filings.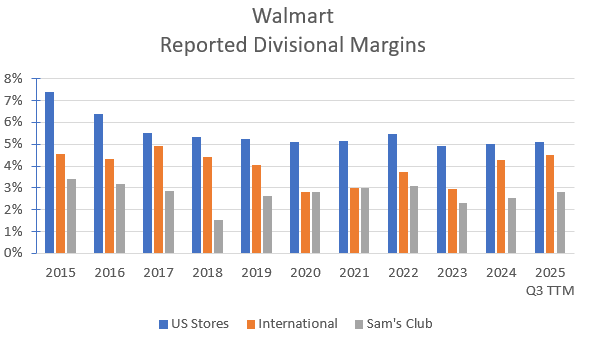
Operating margins had been declining across all divisions particularly since the growth in eCommerce. The data suggests that US margins are now reasonably stable but international margins are now rising following the restructuring of the division’s operations.
WMT has achieved an excellent international outcome – above sector volume growth rates and improving operating margins.
Capital Structure
WMT has been progressively lowering its debt ratio since its peak in FY2016:
Author’s compilation using data from Walmart’s 10-K filings.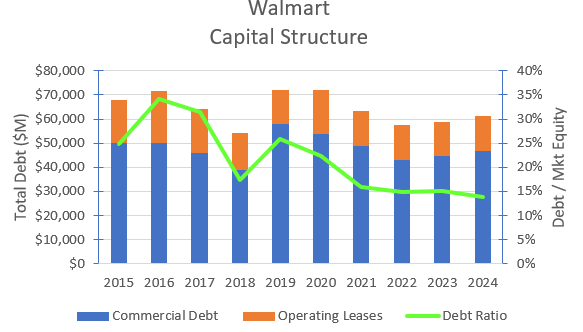
The ratio has now stabilized between the sector’s 25th quartile and median level and it appears that it is being carefully managed to be maintained at this level.
I have no concerns about WMT’s capital structure, and they have sufficient operating cash flows to more than cover their annual interest payments.
The balance sheet could easily absorb additional debt to fund a significant acquisition or to increase the level of stock buybacks.
Cash Flows
The following table summarizes WMT’s cash-flows over the last 10 years:
Author’s compilation using data from Walmart’s 10-K filings.
From the table we can see that WMT’s operations have generated $165,283 M in free cash flow after reinvestment.
WMT increased its debt levels during the Covid pandemic as a precautionary measure in case its cash flows were negatively impacted. Since the pandemic ended, they have begun paying their debt back.
This means that there was $131,374 M available to return to shareholders. WMT has paid $67,030 M in dividends and spent $59,959 M in buying back stock.
Impressively WMT has increased its dividend every year since the dividend was initiated in 1974. Very few large companies return such a high proportion of their free cash flow back in dividends (it is thought to rob the company of financial flexibility.
The dividend is safe at its current level and is easily covered by the free cash flow. I can see no reason why it won’t continue to increase for the foreseeable future if there are no drastic macro changes to the economy.
The table shows that the quantum of share buybacks has been quite volatile. WMT appears to target a specific level of cash on hand (normally around $8 billion to $10 billion) and the level of share buybacks are flexed to manage the targeted cash balance. This will probably continue.
Return on Invested Capital
The following chart shows the history of WMT’s return on invested capital (ROIC) over the last 10 years:
Author’s compilation using data from Walmart’s 10-K filings.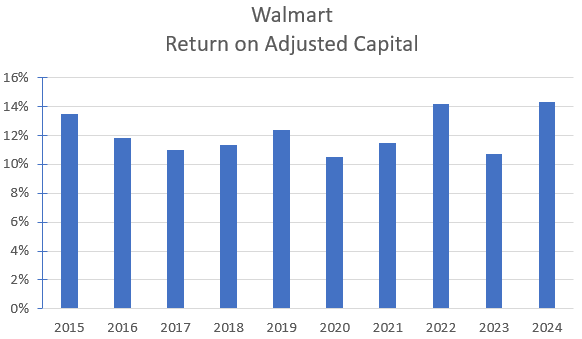
Be careful when making judgements about the trend in this chart. The underlying ROIC is reasonably stable between 10% to 12% and the higher spikes are due to the invested capital calculations immediately following the divestments of certain international businesses.
In summary, WMT’s ROIC has been reasonably flat for many years and is reasonably close to the global sector’s median of 11.6%. The ROIC is comfortably higher than my estimate for WMT’s current cost of capital.
Although WMT has a dominant market position its financial performance is more “workman like” than stunning. It has chosen to position itself as a dominant player in a high volume / low margin sector and as a result its financial performance is stable, reliable but not very spectacular.
My Investment Thesis for Walmart
Retailers can often signal a coming recession when their inventory growth begins to outpace sales growth. The following chart shows WMT’s historical inventory levels and stock turns:
Author’s compilation using data from Walmart’s 10-K filings.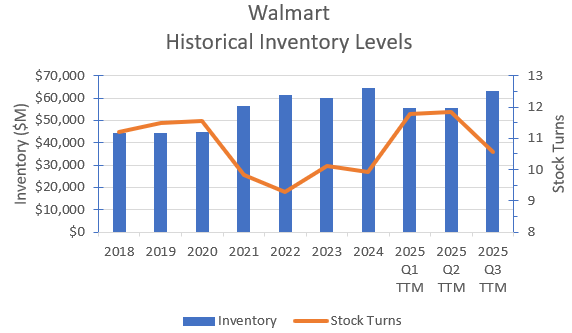
The chart indicates that WMT’s inventory metrics have been improving post-Covid and are currently in better shape than before the Covid pandemic.
I note that the inventory levels for the most recent quarter have increased but this is normal as retailers “gear up” for the peak shopping season which takes place during November and December each year.
The WMT data indicates to me that economic conditions in the near term should remain positive and as a result I am not expecting any significant deterioration in trading conditions. My forecast for the next few years is for a “business as normal” situation.
Growth Story
WMT is working hard to keep its revenues growing above trend and to avoid sliding into the corporate “old age home”.
Due to its size, it is almost impossible for WMT to grow faster than the economy in the US without sacrificing its margins. As a result, I am forecasting that US store revenues (for both Sam’s Club and regular stores) will only grow at the same rate as the US economy (the current 10-year treasury yield is a proxy for this).
The International division is quite different. WMT has focused the division on higher growth / low penetration markets and as a result I am forecasting that divisional revenues may grow at 11% per year for the next 5 years before declining to a terminal growth rate of around 4% by year 10.
Margin Story
Improving margins is an important secondary imperative for WMT. There are 2 strategies at play – improving internal efficiencies and slowly encouraging customers to buy a more profitable product mix.
For competitive reasons I think that there are limited opportunities to significantly improve US margins by any more than 20 to 30 basis points over the next 10 years.
Once again, the opportunities are with the International division. Margins are currently significantly lower than US margins, but I suspect that over time this gap can be closed. I am projecting that the International division margins can improve by 70 basis points over the next 10 years.
Growth Efficiency
WMT’s reinvestment demands are relatively modest. I suspect that management has learnt some valuable lessons from several of their failed international acquisitions. Consequently, I am not forecasting any major acquisitions going forward.
Most new capital will be spent on maintaining the appeal of existing stores and upgrading business systems. I estimate that WMT’s current capital efficiency is in the global sector’s highest quartile and I am not expecting this to deteriorate over time.
Risk Story
I use the Capital Asset Pricing Model (CAPM) as a proxy for reflecting the level of risk associated with a company (the higher the risk the higher the cost of capital).
I estimate that WMT’s current cost of capital is moderately lower than the typical US non-financial listed company. This is driven by the relatively low volatility in WMT’s cash flows (this results in a low beta).
The only significant risk that I currently see with WMT’s future cash flows are associated with their Chinese operations. The near-term political relationship between China and the United States may impact WMT’s cash flows. For this reason, I have increased WMT’s terminal cost of capital to my current estimate of the 25th percentile of all US non-financial listed companies.
Competitive Advantages
In my opinion WMT is a good retailer and is well managed. The company’s key financial metrics (revenue growth, operating margins and return on invested capital) are all reasonably close to the sector’s median.
Any competitive advantage that WMT has established is relatively intangible (associated with its brand, store locations and management skill) without any patentable intellectual property. This type of competitive advantage is difficult to maintain over time, but I expect that WMT’s long-term returns on capital will remain comfortably above its cost of capital.
My estimate for divisional revenue growth and operating margins for FY2025 to FY 2029 are shown in the following table:
Author’s scenario forecast.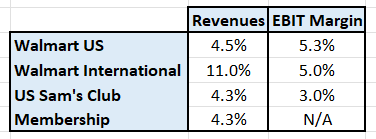
Valuation Assumptions
The following table summarizes the key inputs into the valuation:
Author’s discounted cash flow model inputs.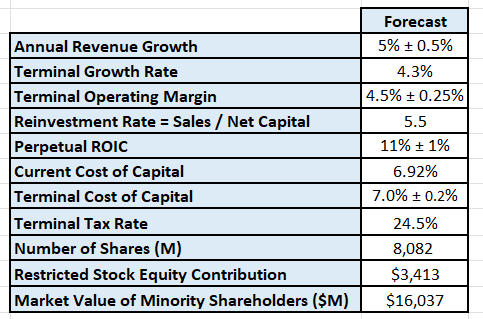
The following calculations should be noted:
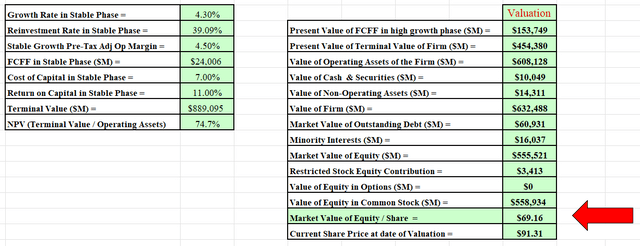
- I have assumed that all the outstanding employee restricted stock is converted into common stock and that there will be a $3,413 M equity contribution from the employees.
- Minority holdings – Walmart provides insufficient information for me to determine a market value for the minority holdings. As a proxy I have used the sector’s median price / book ratio (2.6) to generate a market value for the minority holdings.
Discounted Cash Flow Valuation
A Free Cash Flow to the Firm approach is used with a 3-stage model (high growth, declining growth and maturity). The model only seeks to value the cash flows of the operating assets. The output from the DCF model is in $USD:
Author’s model output. Author’s model output.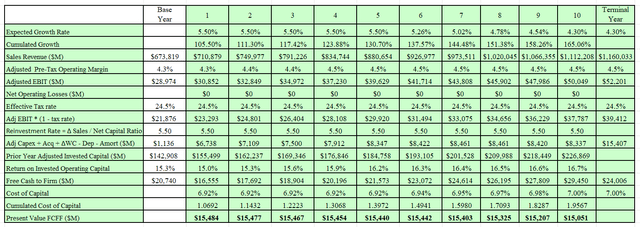
I also developed a Monte Carlo simulation for the valuation based on the range of inputs for the valuation. The output of the simulation is developed after 100,000 iterations.
Author’s Monte Carlo simulation output.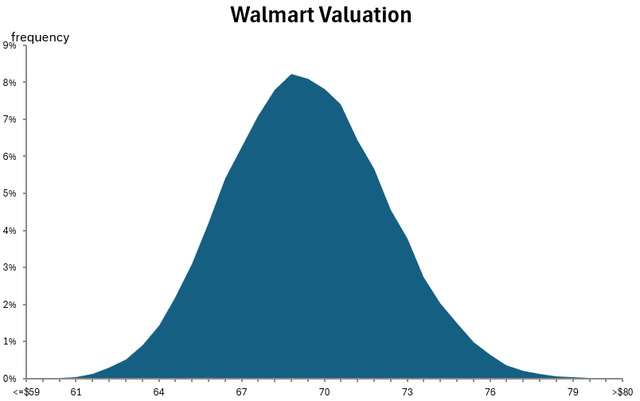
The Monte Carlo simulation can be used to help understand the major sources of input sensitivity in the valuation. The valuation distribution is mainly influenced by the operating margin and the terminal cost of capital.
The simulation estimates that at a discount rate of 7%, WMT’s intrinsic value is currently between $59 and $80 per share with an expected value around $69.
This would indicate that Walmart is currently expensively priced relative to its intrinsic value.
Final Summary and Recommendation
The report highlighted that WMT is the largest retailer in the world. The sector is very mature and is not expected to grow much above the underlying economies of the countries in which it trades. Due to WMT’s dominance of the US market, the international division is the only source of potentially higher growth.
The future play for WMT is to continue to expand in faster growing international markets whilst continuing to improve internal processes to incrementally increase margins.
What have been the returns to long-term shareholders?
WMT has provided outstanding investment returns particularly over the last 5 years as shown in the following table:
Author’s compilation using data from Yahoo Finance.
What trading are insiders doing in WMT stock?
Insiders through their personal trading activities often provide clues for investors about their perceptions of the company’s share price relative to fair value.
I normally show the details of every trade completed by insiders for the last 2 years but in the case of WMT the list is too large so I have chosen to summarize the completed trades:
Author’s compilation using data from GuruFocus.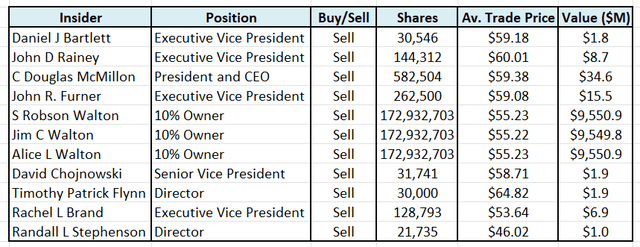
The data indicates that there has been constant selling of shares by insiders (including those by the Walton family). There have been no purchases of shares by insiders over the last 2 years.
The insider trading activity suggests that insiders as group may believe that WMT shares have been over-priced for some time.
Does WMT’s relative valuation provide any additional insights?
Due to WMT’s size and business split it is difficult to define a comparator group of companies from which we can derive any relative pricing insights from which to draw conclusions. Its nearest rival (in terms of market capitalization) may very well be Costco (COST):
Author’s compilation using data from Yahoo Finance.
The problem with this type of analysis is that it only provides relative information and not absolute information. In this instance WMT certainly looks relatively cheaper than COST but we are still in the dark about WMT’s relative valuation.
The following chart shows the historical relationship between WMT’s reported net income (NPAT) and its trailing price to earnings ratio (P/E):
Author’s compilation using data from GuruFocus.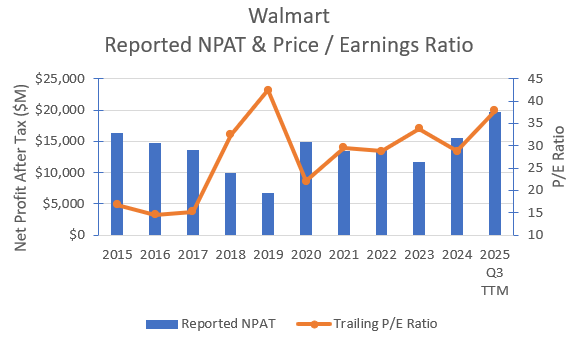
The chart highlights an interesting change in trend which has taken place since the Covid pandemic.
Retailing is a cyclical business. Prior to Covid, when profits were high WMT’s P/E ratio was low and when profits cyclically declined the P/E ratio would increase. This relationship is “normal” for most cyclical companies.
Since the end of the pandemic, WMT’s earnings have cyclically increased but the P/E ratio has also increased and is now at an unusually high level for this part of the economic cycle.
In my opinion, this indicates that WMT is currently overpriced.
Are there any clues from Seeking Alpha’s Quant Factor Grades?
At the time of writing the SA Quant factor grades were:
Seeking Alpha Quant factor ratings.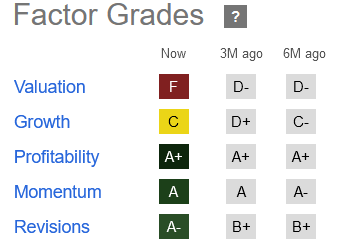
SA is clearly indicating that WMT is expensive.
What should WMT shareholders be doing?
Given the extraordinary increase in WMT’s share price over the last year, holders of WMT may well be significantly overweight in their portfolio. I would recommend that holders develop a strategy to bring their holdings back to at least their target weighting.
Although I think that WMT is significantly overpriced I am not advocating that investors sell all their holdings. Stocks can trade above their intrinsic value for long periods of time but if a market influencing event occurs then I would expect that the stock’s price may fall back to its intrinsic value (or even go lower).
Although I am not proficient in technical analysis, WMT’s chart action potentially looks to be over-bought. This may present the opportunity to take some trading profits and SELL some.
Analyst’s Disclosure: I/we have no stock, option or similar derivative position in any of the companies mentioned, and no plans to initiate any such positions within the next 72 hours. I wrote this article myself, and it expresses my own opinions. I am not receiving compensation for it (other than from Seeking Alpha). I have no business relationship with any company whose stock is mentioned in this article.
Seeking Alpha’s Disclosure: Past performance is no guarantee of future results. No recommendation or advice is being given as to whether any investment is suitable for a particular investor. Any views or opinions expressed above may not reflect those of Seeking Alpha as a whole. Seeking Alpha is not a licensed securities dealer, broker or US investment adviser or investment bank. Our analysts are third party authors that include both professional investors and individual investors who may not be licensed or certified by any institute or regulatory body.
